

Abstract
The capability of Salmonella enterica serovar Typhimurium strain 14028 (S. Typhimurium 14028) to utilize myo-inositol (MI) is determined by the genomic island GEI4417/4436 carrying the iol genes that encode enzymes, transporters, and a repressor responsible for the MI catabolic pathway. In contrast to all bacteria investigated thus far, S. Typhimurium 14028 growing on MI as the sole carbon source is characterized by a remarkable long lag phase of 40 to 60 h. We report here that on solid medium with MI as the sole carbon source, this human pathogen exhibits a bistable phenotype characterized by a dissection into large colonies and a slow-growing bacterial background. This heterogeneity is reversible and therefore not caused by mutation, and it is not observed in the absence of the iol gene repressor IolR nor in the presence of at least 0.55% CO2. Bistability is correlated with the activity of the iolE promoter (PiolE), but not of PiolC or PiolD, as shown by promoter-gfp fusions. On the single-cell level, fluorescence microscopy and flow cytometry analysis revealed a gradual switch of PiolE from the “off” to the “on” status during the late lag phase and the transition to the log phase. Deletion of iolR or the addition of 0.1% NaHCO3 induced an early growth start of S. Typhimurium 14028 in minimal medium with MI. The addition of ethoxyzolamide, an inhibitor of carboanhydrases, elongated the lag phase in the presence of bicarbonate. The positive-feedback loop via repressor release and positive induction by bicarbonate-CO2 might allow S. Typhimurium 14028 to adapt to rapidly changing environments. The phenomenon described here is a novel example of bistability in substrate degradation, and, to our knowledge, is the first demonstration of gene regulation by bicarbonate-CO2 in Salmonella.
Phenotypic variation is widespread among prokaryotes, and its underlying molecular mechanisms include genetic changes such as genomic inversion and strand-slippage mechanisms, epigenetic variations depending on DNA methylation, and feedback-based multistability characterized by at least two distinct phenotypes within an isogenic population (36). Per definition, bistability must arise stochastically at the cellular level (9). A common regulatory arrangement exhibiting bistability includes a positive-feedback loop with a cooperative response to an activator (10). This was first described for lactose utilization by Escherichia coli in which a population is split into cells highly or not at all expressing the lac operon (11, 28). Further prominent examples are the bistable switch between lysogeny and lysis of bacteriophage λ depending on the fragile balance between the regulators Cro and CI (4), and the Bacillus subtilis K-status (competence) system in which 10 to 20% of the cells in stationary phase highly express genes permitting transformation competence (24, 35). The survival of Staphylococcus aureus against antibiotic treatment requires that some cells called persisters enter a condition of reduced growth (5), and population heterogeneity is also observed during B. subtilis sporulation (13). Very recently, it was demonstrated that biofilm formation by Salmonella enterica serovar Typhimurium strain 14028 (S. Typhimurium 14028) involves the bistable expression of CsgD, the major biofilm regulator (14). Even more intriguing, when this pathogen infects hosts, a stochastic switch takes place that results in a self-destructive fraction and another that benefits from the dying one (3).
myo-Inositol (MI) is a polyol abundant in soil. The iol genes of S. Typhimurium 14028 responsible for utilization of MI as carbon and energy source are located on a 22.6-kb genomic island (GEI4417/4436) that is absent in all but six Salmonella serovars sequenced thus far (21). All genes on this island necessary for MI degradation are induced during growth with this substrate as the sole carbon source. The catabolic pathway requires IolG and IolE converting MI to 3D-trihydroxycyclohexane-1,2-dione, which is further hydrolyzed by IolD. 5-deoxy-glucuronic acid is isomerized by IolB to 2-deoxy-5-keto-d-gluconic acid that is then phosphorylated by the kinase IolC and degraded to dihydroxyacetone phosphate, acetyl coenzyme A, and CO2. In rich medium, the negative regulator IolR represses all but one promoter of the iol divergon, including its own (21). A protein belonging to the major facilitator superfamily, IolT1, has recently been identified as the predominant MI transporter of S. Typhimurium 14028, and IolR was revealed to also inhibit the transcription of iolT1 (22).
The ability to degrade MI is known for the Gram-positive species Bacillus subtilis (26, 39, 41), Corynebacterium glutamicum (20), Clostridium perfringens (17), and Lactobacillus casei BL23 (38), as for several Gram-negative species such as Serratia, Klebsiella, and Pseudomonas (6, 12, 23, 30). Although a comparison of the respective gene clusters revealed a high variability of their chromosomal organization, the negative regulation of the iol genes by the IolR repressor is a common feature of all MI divergons investigated thus far. An intermediate of MI degradation, 2-deoxy-5-keto-d-gluconic acid 6-phosphate (DKP), has been shown to antagonize IolR binding, thus inducing the expression of iol genes (40, 42).
A remarkable and unique property of S. Typhimurium 14028 is its long lag phase in the presence of MI. We show here for the first time that phenotypic variation is involved in this growth phenomenon and that the deletion of IolR and the addition of bicarbonate induce growth of the pathogen in MI. A model of the molecular mechanism underlying bistability in the presence of MI is proposed.
MATERIALS AND METHODS
Bacterial strains, plasmids, and growth conditions.
Bacterial strains and plasmids used in the present study are listed in Table 1. S. Typhimurium 14028 cultures were grown at 37°C in Luria-Bertani (LB) broth (10 g of tryptone, 5 g of yeast extract, and 5 g of NaCl/liter) or in minimal medium (MM). MM is M9 medium supplemented with 2 mM MgSO4, 0.1 mM CaCl2, 55.5 mM (1% [wt/vol]) MI, or 27.8 mM (0.5% [wt/vol]) glucose. For plasmid maintenance, the media were supplemented with the antibiotics ampicillin (150 μg/ml) or kanamycin (50 μg/ml). For solid media, 1.5% agar (wt/vol) was added. The cultures were incubated at an atmospheric CO2 concentration or with elevated CO2 concentrations in a cell culture incubator. When necessary, 200 μM ethoxyzolamide dissolved in dimethyl sulfoxide was added. For all growth and promoter probe experiments, bacterial strains were grown in LB medium overnight at 37°C, washed twice in phosphate-buffered saline (PBS) and then adjusted to an optical density at 600 nm (OD600) of 0.005 in the desired liquid growth medium or streaked onto agar plates. Growth curves were obtained from bacterial cultures incubated at 37°C without agitation in 250-ml bulb flasks with 50 ml of MM. The OD600 was measured in time intervals as indicated.
TABLE 1.
Strains, plasmids, and oligonucleotides used in this study
| Strain, plasmid, or oligonucleotide | Description, relevant features, and/or sequence (5′-3′)a | Source or reference |
|---|---|---|
| Strains | ||
| 14028 | Spontaneous streptomycin-resistant mutant of S. enterica serovar Typhimurium 14028 wild-type strain ATCC 14028 | 21 |
| 14028 ΔiolR | In-frame iolR (STM4417) deletion mutant | 21 |
| 14028 ΔiolI1 | In-frame iolI1 (STM4427) deletion mutant | 21 |
| 14028 ΔiolG2 | In-frame iolG2 (STM4433) deletion mutant | 21 |
| 14028 ΔiolH | In-frame iolH (STM4436) deletion mutant | 21 |
| Plasmids | ||
| pBR322 | Ampr Tetr | Fermentas |
| pBR322-iolR | iolR cloned into pBR322 with putative promoter region | 21 |
| pPROBE-NT | Promoter probe vector, pBBR1 replicon, gfp reporter, Kanr | 25 |
| pNT-PiolE | pPROBE-NT with 300 bp of iolE upstream sequence cloned in front of the gfp reporter | This study |
| pDEW201-PiolE | pDEW201 with 321 bp upstream of iolE (STM4424) | 21 |
| pDEW201-PiolC | pDEW201 with 117 bp upstream of iolC1 (STM4430) | 21 |
| pDEW201-PiolD | pDEW201 with 138 bp upstream of iolD1 (STM4431) | 21 |
| Oligonucleotides | ||
| PiolE HindIII | TTTAAGCTTAGGACTATCGTAAAGC, cloning oligonucleotide | This study |
| PiolE EcoRI | TTGAATTCTTAATGAAACGCTTTTACTG, cloning oligonucleotide | This study |
| PiolD1 HindIII | TTTAAGCTTCAAGATCACAGAAATGGC, cloning oligonucleotide | This study |
| PiolD1 EcoRI | TTGAATTCTTTTCATGTACCCCACC, cloning oligonucleotide | This study |
| PiolC1 HindIII | TTTAAGCTTTTCATTTATGGGAAGG, cloning oligonucleotide | This study |
| PiolC1 EcoRI | TTGAATTCATTCATTGACATATCC, cloning oligonucleotide | This study |
| Control | CCGTATGTTGCATCACC, sequencing primer | This study |
Tetr, tetracycline resistance; Ampr, ampicillin resistance; Kanr, kanamycin resistance.
Standard procedures.
DNA manipulations and isolation of chromosomal or plasmid DNA were performed according to standard protocols (32) and according to the manufacturers' instructions. Plasmid DNA was transformed via electroporation using a Bio-Rad Gene Pulser II as recommended by the manufacturer and as described previously (18). PCRs were carried out with Taq polymerase (Fermentas, St. Leon-Rot, Germany). As a template for PCR, chromosomal DNA, plasmid DNA, or cells from a single colony was used. S. Typhimurium 14028 gene numbers refer to the LT2 annotation (NC 003197).
Quantification of promoter activity.
Bioluminescence measurements were performed in 96-well plates. For growth in MM containing 55.5 mM MI, bacterial cells were grown at 37°C for 74 h in 15-ml centrifuge tubes without agitation. At appropriate time points, 200 μl of each sample was transferred to the 96-well plate, and the OD600 and the bioluminescence, measured as relative light units (RLU), were recorded in a Wallac Victor3 1420 multilabel counter (Perkin-Elmer Life Sciences, Turku, Finland).
Cloning of iol promoters into the gfp reporter plasmid pPROBE-NT.
The iolE, iolC1, and iolD1 promoters identified recently (21) were amplified from chromosomal DNA of wild-type S. Typhimurium 14028 by PCR using the oligonucleotides listed in Table 1. The fragments were cloned via HindIII and EcoRI (Fermentas) upstream of gfp into the multiple cloning site of pPROBE-NT. After transformation into S. Typhimurium 14028 cells, plasmids containing the correct transcriptional gfp fusions were isolated and verified by PCR, restriction analysis, and sequencing. pNT-PiolE, pNT-PiolD, and pNT-PiolC were then transformed into S. Typhimurium 14028 and 14028 ΔiolR.
Fluorescence microscopy and FC.
Fluorescence microscopy was performed using an Olympus BX51 microscope equipped with a F-view camera. Flow cytometry (FC) was carried out on a Becton Dickinson LSR II cytometer at 488-nm excitation wavelength. Light emission was measured between 515 and 545 nm. The population of bacteria was gated in forward and side scatter, which were both amplified logarithmically. For all assays, overnight cultures of S. Typhimurium 14028 carrying pNT-PiolE, pNT-PiolC, or pNT-PiolD were washed twice in PBS and inoculated in 50 ml of MM containing 55.5 mM MI and kanamycin (50 μg/ml) in 250-ml bulbed flasks at an OD600 of 0.005. The cells were harvested at different time points and concentrated by centrifugation (1 min at 2,000 × g). For fluorescence microscopy, 5 μl of a concentrated cell suspension was applied to a glass slide. In FC experiments, 100,000 events were measured, and the collected data were analyzed by using winMDI (v2.9).
RESULTS
S. Typhimurium 14028 shows a bistable phenotype in the presence of MI.
To investigate the genetics of MI utilization by S. Typhimurium 14028, this strain was streaked on MM agar plates with 55.5 mM MI and grown for at least 100 h at 37°C or diluted 1:1,000 into liquid MM containing MI and incubated for at least 100 h. Under these conditions, two interesting phenotypes appeared. (i) On MI agar plates, a small portion of the whole-cell population grew earlier than the residual cell population and formed colonies on a background of a thin bacterial lawn (Fig. 1A). (ii) In liquid cultures, the end of the lag phase was highly variable, a phenomenon that could not be reduced despite various efforts to apply reproducible conditions. On average, a lag phase of 40 to 60 h was determined, but in some experiments no growth was observed at all. The same bistable phenotype on solid medium appeared when deletion mutants of iolI1, iolG2, and iolH were tested, indicating no role of these genes of unknown function in the underlying molecular mechanism (data not shown). To test a possible temperature-dependency of the bistable phenotype, an overnight culture of S. Typhimurium 14028 was diluted, and aliquots were plated on MI agar plates. After incubation for 48 h to 72 h, bistability was observed on plates incubated at 20, 25, and 30°C (data not shown). This phenomenon was not observed in the presence of glucose (Fig. 1A). When single colonies or background bacteria were further propagated on MI agar plates, only bacteria from the background showed a dissection into two phenotypes (Fig. 1B).
FIG. 1.

Bistable phenotype on agar plates and involvement of iolR. (A) An equal number of S. Typhimurium 14028 cells were plated on MM agar plates with MI or glucose as the sole carbon source. Colonies on a bacterial background lawn manifested a bistable phenotype. (B) Bacteria from a colony and the background were picked and restreaked on MI agar plates. Dissection into two phenotypes was only observed for the background bacteria. (C) Dense streak out of S. Typhimurium 14028 and its deletion mutant 14028 ΔiolR on solid MM with 55.5 mM MI. (D) Diluting streak out of the same strains.
Reversibility of bistability.
To exclude the possibility that the observed bistability is the result of an irreversible genetic effect such as a mutation or phase variation, 18 colonies grown on MM agar plates with MI as described were isolated to inoculate liquid LB medium and cultivated overnight at 37°C, followed by two additional passages in LB medium. Cells were then spread on MM agar plates with MI, and all cultures again showed the bistable phenotype. Also, a delayed start of the logarithmic growth phase in MI medium was observed. One intermediate cultivation in LB medium, however, was not sufficient to reverse the bistable phenotype under these conditions. These data indicate that bistability of S. Typhimurium 14028 cultures in the presence of MI is reversible and that it is not caused by any kind of mutation.
Involvement of the repressor IolR.
IolR has been characterized as a repressor of iol gene expression and is known to bind to all but one promoter of the genes required for MI degradation, including its own promoter. Furthermore, its deletion resulted in a significantly reduced lag phase during growth in liquid medium (21). We therefore investigated the role of IolR by plating the deletion mutant 14028 ΔiolR on agar plates with MM and MI. Instead of single colonies on a thin bacterial background layer reflecting a bistable phenotype, a homogenous bacterial lawn identical to that of a wild-type strain growing on LB agar plates was observed (Fig. 1C and D). Complementation of the iolR deletion using plasmid pBR322-iolR restored the phenotype of S. Typhimurium 14028 (data not shown), clearly suggesting a role of IolR in bistability in the presence of MI.
Fluorescence microscopy reveals bistability of PiolE.
Bistability is caused by the existence of two status of gene expression in an isogenic cell population under identical conditions. For a single cell analysis, the promoter PiolE was chosen, which drives the expression of IolE and IolG1 required for the initial enzymatic steps of MI degradation by S. Typhimurium 14028. In a previous study, PiolE showed a very low basal expression in MM with glucose or LB but a high induction during growth in MM with MI (21). A complete expression profile of PiolE was derived during growth of S. Typhimurium 14028 in MM with MI (Fig. 2A). Two levels of bioluminescence were observed with strain 14028/pDEW201-PiolE. After 56 h, a strong 3-fold increase of promoter activity was detected. The logarithmic growth phase started only 2 to 4 h after this iolE induction, demonstrating the feasibility of a PiolE::gfp fusion product to investigate bistability on a single cell level during growth in medium with MI.
FIG. 2.

Transcriptional activity of PiolE during growth of S. Typhimurium 14028 in MM with MI. (A) Growth curve of 14028/pDEW201-PiolE and expression profile of PiolE. The OD600 and bioluminescence (in RLU) were measured in parallel. (B) Aliquots of two 14028/pNT-PiolE cultures independently inoculated in MM with MI were analyzed by fluorescence microscopy. Cells without or with low and high fluorescence activity were observed. The lack of simultaneous growth reflects the random switch between the “off” and the “on” status of the iolE promoter. Magnification is 400-fold. The time point postinoculation and the OD600 are indicated. No fluorescence was observed at any time point when strain 14028/pNT-PiolE was cultivated in MM with glucose as a control. The respective images show cells in the late exponential growth phase at 8 h postinoculation.
For this purpose, MM containing MI was inoculated with S. Typhimurium 14028 cells harboring a gfp fusion to PiolE on the low-copy-number plasmid pPROBE-NT (pNT-PiolE). The reporter response during growth of several cultures was monitored by fluorescence microscopy. Images of cells taken from the late lag and the early growth phase of two representative experiments are shown in Fig. 2B. In comparison to a probe yielded 49 h after inoculation near the end of the lag phase at an OD600 of 0.089 that shows only four cells with fluorescent activity, a much higher cell number of a probe taken 4 h later at an OD600 of 0.107 obviously express IolE and IolG1. During early logarithmic growth, three distinct cell populations with no, low, or high fluorescence were detectable, demonstrating the bistability on a cellular level. As a control, strain 14028/pNT-PiolE was grown in MM with glucose, but no cells expressing iolE could be observed before or during exponential growth.
Temporal analysis of Piol::gfp fusion constructs by FC.
For a more detailed and quantitative analysis, aliquots of a 14028/pNT-PiolE culture in MM with MI were taken at appropriate time points during the lag and log phases, and the transition between them, and analyzed by FC. The results of a representative experiment are shown in Fig. 3. Three distinct levels of iolE expression could be discriminated, represented by cells in the “off” status or in the “on” status. Cells in the “on” status dissected in fraction with low and transient, or high and long-lasting fluorescence activity. Only 3% of S. Typhimurium 14028 cells expressed green fluorescent protein (GFP) at an OD600 of 0.037. The fraction with the iolE promoter in “on” status then rapidly increased to 70% (OD600 = 0.076) and to a maximum of 97% (OD600 = 0.600). These data correlate well with the fluorescence images of Fig. 2B. The activities of PiolC and PiolD were measured as control (Table 2). Although both promoters showed two fraction of distinct fluorescence activity appearing at a low OD600 of 0.05, this phenotype was rapidly resolved. All three promoters were also tested in the 14028 ΔiolR background. Very similar FC histograms without a transient fluorescent fraction only was obtained for all three promoters, indicating a complete loss of PiolE bistability in the absence of IolR (Fig. 3B).
FIG. 3.

FC analysis of PiolE. (A) 14028/pNT-PiolE was grown in MM containing MI. Cells expressing GFP were quantified by using an LSR II flow cytometer. The abscissa of the histogram represents the green fluorescence intensity at 515 to 545 nm as arbitrary units in a logarithmic scale and the ordinate the cell count or events. The time points and OD600 are indicated. The initial peak adding to 100% summarizes events out of range and might represent dead cells or cells in the “off” status. The insert illustrates the growth phase that corresponds to the OD600 values. (B) Investigation of the PiolC activity in S. Typhimurium 14028 (control) and of the PiolE and PiolC activity in the ΔiolR deletion mutant. OD600 values are indicated in parentheses. See the text for further details.
TABLE 2.
FC analysis of PiolE, PiolC, and PiolD
| Promoter | Strain background | Growth condition | OD600 | % Valuesa |
|
|---|---|---|---|---|---|
| “Off” | “On” | ||||
| PiolE | 14028 | MI | 0.037, 0.076, 0.094, 0.103, 0.250, 0.300, 0.600 | 97, 30, 22, 18, 10, 9, 3 | 3, 70, 78, 82, 90, 91, 97 |
| PiolC | 14028 | MI | 0.005, 0.05, 0.08, 0.1 | 95, 59, 31, 18 | 5, 41, 69, 82 |
| PiolD | 14028 | MI | 0.005, 0.05, 0.08, 0.1 | 94, 85, 53, 39 | 6, 15, 47, 61 |
| PiolE | 14028 ΔiolR | MI | 0.005, 0.05, 0.08 | 32, 7, 6 | 68, 93, 94 |
| PiolC | 14028 ΔiolR | MI | 0.005, 0.05, 0.08 | 34, 6, 4 | 66, 94, 96 |
| PiolD | 14028 ΔiolR | MI | 0.005, 0.05, 0.08 | 51, 5, 4 | 49, 95, 96 |
| PiolE | 14028 | MI + bicarbonate | 0.011, 0.052, 0.077, 0.088 | 100, 27, 16, 12 | 0, 73, 84, 88 |
| PiolC | 14028 | MI + bicarbonate | 0.012, 0.054, 0.089, 0.115 | 84, 36, 19, 14 | 16, 64, 81, 86 |
| PiolE | 14028 | MI + bicarbonate + EZAb | 0.027, 0.03, 0.048, 0.056, 0.065 | 33, 27, 23, 32, 32 | 66, 73, 77, 68, 68 |
| PiolE | 14028 ΔiolR | MI + bicarbonate | 0.072 | 18 | 82 |
The “off” and “on” values are given respective to the corresponding OD600 values in column 4.
EZA, ethoxyzolamide.
Bistability is abolished by carbon dioxide.
pH modifications of the medium from pH 2 to pH 12 in 0.5 increments, or low phosphate concentrations known to induce virulence properties (8) did not significantly change the growth phenotype. However, significantly less retarded growth of S. Typhimurium 14028 was observed when cells were grown on MM agar plates with MI in the presence of 5% CO2. To determine a minimal concentration of carbon dioxide sufficient to abolish bistability, S. Typhimurium 14028 was grown in the presence of CO2 in concentrations of 0% to 5% (Fig. 4A). While a concentration of 0.2% CO2 still resulted in a bistable phenotype, a concentration of 0.55% CO2 was identified as the minimal CO2 concentration required to release bistability of S. Typhimurium 14028 on solid medium. As expected, no bistability was observed when the iolR deletion mutant was grown in the presence of 5% CO2. However, when the complementing plasmid pBR322-iolR was present in the mutant 14028 ΔiolR, the bistable phenotype reappeared (Fig. 4B), indicating that the IolR overexpression in this strain at least partially neutralizes the effect of 5% CO2 on iol gene regulation. The effect of bicarbonate on the activity of PiolC and PiolE was then tested by FC. Both PiolE and PiolC showed a short transition phase from lower to higher fluorescence intensity, and the maximal activity was observed in the early log phase. Carbon dioxide diffuses into the cell where it is converted to bicarbonate by the activity of bacterial carboanhydrases (CAs). CA candidates of S. Typhimurium 14028 are encoded by yadF (STM0171) or the virulence plasmid-encoded gene PSLT046. To test the involvement of CAs in the bistability phenomenon, ethoxyzolamide, a CA inhibitor, was added, and the fluorescence of 14028/pDEW201-PiolE cells was measured (Table 2). In the presence of 200 μM ethoxyzolamide, a higher fraction of cells exhibited low fluorescence, and an elongation of the lag phase by approximately 7 h was observed.
FIG. 4.
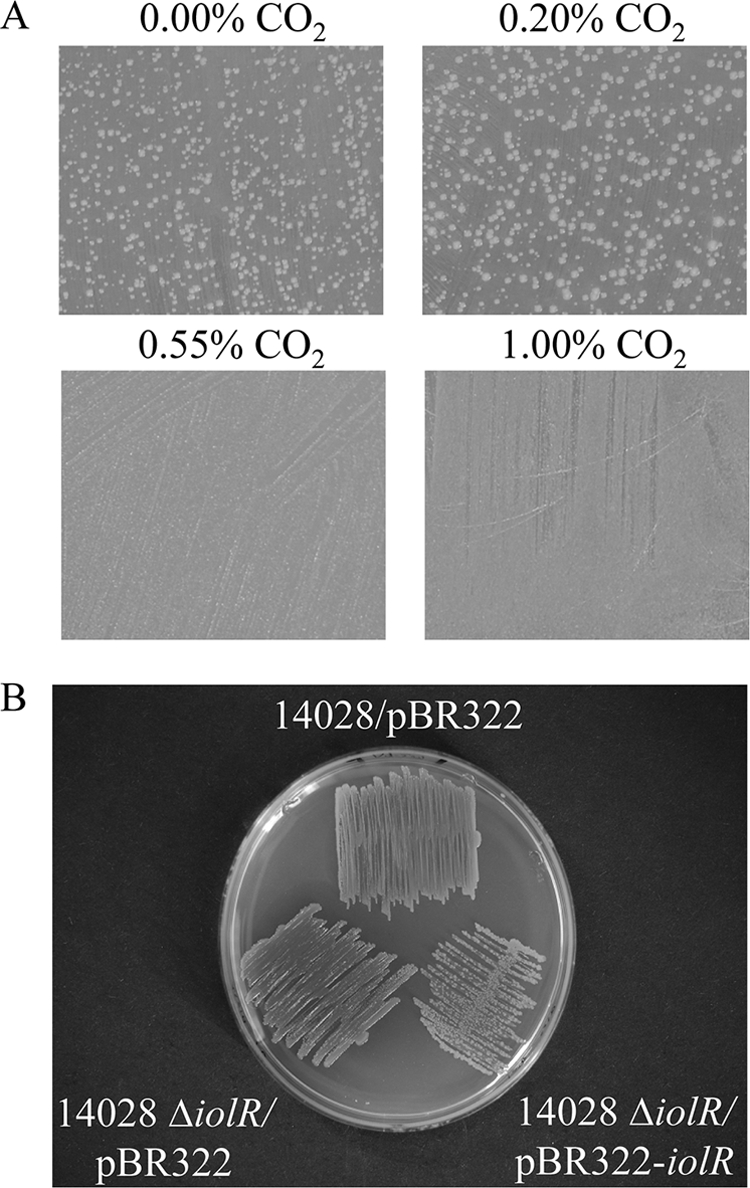
Effect of CO2 on bistability. (A) MM agar plates with 55.5 mM MI were incubated for 100 h in the presence of various concentrations of CO2. A loss of bistability was observed in the presence of at least 0.55% CO2. (B) A concentration of 5% CO2 was applied in this experiment. Upon complementation with pBR322-iolR, the bistable phenotype is restored, thus compensating for the CO2 effect. Both experiments were repeated several times.
Influence of bicarbonate as growth signal.
In order to investigate the effect of bicarbonate on the length of the lag phase, we diluted an overnight culture of S. Typhimurium 14028 into MI-containing MM without NaHCO3, or with 0.01, 0.1, 0.18%, 0.4, 0.8, and 1% NaHCO3. Incubation was performed without shaking because agitation, for unknown reasons, reduced the reproducibility with respect to the start of the logarithmic growth phase. The shortest lag phase of the Salmonella cells was obtained with 0.1% NaHCO3 (Fig. 5), while it was significantly longer when the medium contained higher or lower concentrations of NaHCO3 (data not shown). It is known that 10 mM NaHCO3 strongly reduces the lag phase of E. coli in glucose-containing medium (27). A S. Typhimurium 14028 culture was diluted 1:10,000 into MM with glycerol to provoke a longer lag phase, and the bacteria were then grown with or without bicarbonate. Bicarbonate induced a shorter generation time, but not a reduced lag phase (data not shown), indicating a specific effect of bicarbonate during Salmonella growth with MI.
FIG. 5.

Early growth start of mutant 14028 ΔiolR in MM with MI in the presence of 0.1% NaHCO3. Growth curves of S. Typhimurium 14028 and 14028 ΔiolR. Average values of three independent experiments are shown, and standard deviations are indicated. Representative graphs are shown due to the highly variable start points of the logarithmic phase, which are indicated by dashed lines. The arrow depicts the maximal reduction of the lag phase.
Deletion of iolR and the presence of 0.1% bicarbonate result in a minimal lag phase.
Bistability of S. Typhimurium 14028 growing with MI could be abolished by iolR deletion, or by the addition of bicarbonate. This effect was quantified by monitoring the growth of S. Typhimurium 14028 and 14028 ΔiolR in MM with 55.5 mM MI without agitation. Under these conditions, deletion of IolR or addition of 0.1% (11.9 mM) bicarbonate reduced the lag phase by approximately 10 to 20 h in each case. An additive effect on lag phase reduction was obtained when 14028 ΔiolR was incubated in MM with MI and bicarbonate. Here, the logarithmic growth phase started approximately 30 h earlier than that of the wild-type strain in the absence of bicarbonate, and only approximately 10 h later than that of S. Typhimurium 14028 in MM with glucose (Fig. 5). S. Typhimurium 14028 cells precultivated in MM with glucose showed preadaptation to MM and thus a further reduced lag phase (data not shown). FC analysis of a 14028 ΔiolR culture in a MM with MI and 0.1% bicarbonate confirmed this observation. Already 15 h postinoculation and near the end of the lag phase, a majority of 82.19% of all cells shows an active iolE promoter, in contrast to only 19.35% in the wild-type in MM with MI and without bicarbonate (Fig. 3 and Table 2).
DISCUSSION
Bistability is defined as the occurrence of two stable subpopulations within an overall genetically homogeneous population (36). The underlying mechanism is assumed as a specific feedback that acts in combination with a nonlinear response within a network generating a bistable phenotype (36). In the present study, we introduced a metabolic property, MI degradation, as a novel example of such a phenotypic variation. MI utilization in S. Typhimurium 14028 is characterized by an extraordinarily long lag phase on MI that is absent in all other bacteria investigated thus far with respect to this metabolic pathway, indicating a tight regulation of the responsible genes. The early appearance of a few colonies, as well as the weak reproducibility of growth curves reflecting the stochastic variability between the “off” and “on” status within a population, are characteristic features of bistability of S. Typhimurium 14028 in the presence of MI. This phenotypic variation reminds of an observation by D. C. Old, who reported unstable and “leaky” growth of S. Typhimurium 14028 biotype 9 strains in peptone water with MI (29). This phenotype, however, disappears when the repressor IolR lacks or is released from iol gene promoters, possibly by binding the MI degradation intermediate DKP as shown for B. subtilis (40). Slight overexpression of IolR in the iolR deletion mutant restored bistability even in the presence of 5% CO2 (Fig. 4B), probably due to a tighter repression of the iol genes.
Loss of bistability and lag phase reduction was also obtained when the cells were cultivated in the presence of higher concentrations of CO2 or HCO3−. The behavior of PiolE and PiolC/PiolD on a single-cell level corresponds well to the phenotypic effects observed for a iolR negative strain or for cultures in CO2 atmosphere. In the presence of bicarbonate, PiolC also exhibited a short phase of bistability, which, however, was completely abolished in the case of PiolE and PiolC upon iolR deletion. CO2 and the absence of IolR independently affect the lag phase because addition of NaHCO3 further reduced the lag phase of the iolR deletion mutant.
These data allow two conclusions: (i) the proposed regulatory impact of bicarbonate is comparable to that of IolR with respect to the switch of a Salmonella population from an “off” to an “on” status in MI utilization, and (ii) bicarbonate does not seem to directly interact with IolR. Two distinct molecular mechanisms might regulate MI utilization. The promoter PiolE used for fluorescence analysis in the present study drives the expression of IolE and IolG1 required for the first two enzymatic steps of MI degradation, and IolR has been demonstrated not to bind to PiolE (21). We therefore postulate that HCO3− interacts with PiolE directly or, more probably, indirectly via binding to a second regulatory protein, thus inducing the transcription of iolE and iolG1. A promising candidate for such a positive regulator is STM4423, an AraC-like regulator, which is expressed in the gut of infected mice (31) and is localized directly upstream of iolE, STM4424.
An increasing number of reports demonstrate the regulatory role of bicarbonate in pathogenic bacteria. This environmental molecule is involved in virulence gene transcription of Bacillus anthracis, in a change of the antigenic profile of Borrelia burgdorferi, and in M protein expression in group A streptococci (7, 15, 16, 19, 34). Regulation of virulence factors by bicarbonate may especially occur in enteropathogenic bacteria, because HCO3− is secreted from the pancreas for stomach acid neutralization. Experimental examples are the activity of RegA on the two putative virulence determinants adcA and kfc of Citrobacter rodentium, the cholera toxin induction in Vibrio cholerae by ToxT, and the expression of locus of enterocyte effacement-encoded genes in enterohemorrhagic Escherichia coli O157:H7 (1, 2, 37). In the duodenum, HCO3− might reach concentrations between 70 and 150 mM (33), exceeding the 11.9 mM (0.1%) used in our experiments. To our knowledge, an effect of CO2-HCO3− on gene regulation in Salmonella has not been described thus far.
The following model for the regulation of MI utilization by S. Typhimurium 14028 is proposed. In environments lacking MI, most iol gene promoters are repressed by IolR (21). When MI is added, only a few molecules will enter the cell due to the repression of iolT1 encoding the major facilitator of MI (22). MI is degraded to intermediates such as DKP, which is now present at suboptimal levels but induces bistability by binding to IolR. Later on, the DKP level reaches a threshold concentration that releases more IolR from its promoters. Thus, a positive-feedback loop is initiated by inducing iolT1 expression and the MI degradation enzymes, and most cells reach the “on” status with respect to MI catabolism. Interestingly, HCO3− might act as an environmental signal stimulating MI degradation by inducing iolE/G1 via a second regulator predicted above. If this signal is not appropriate due to the absence of MI, IolR activity will ensure that most Salmonella cells remain in the “off” status.
Acknowledgments
We thank Siegfried Scherer for financial support of this study, and Steven Broadley for critical reading of the manuscript. Patrick Schiwek is acknowledged for technical assistance.
Footnotes
Published ahead of print on 14 January 2011.
REFERENCES
- 1.Abe, H., I. Tatsuno, T. Tobe, A. Okutani, and C. Sasakawa. 2002. Bicarbonate ion stimulates the expression of locus of enterocyte effacement-encoded genes in enterohemorrhagic Escherichia coli O157:H7. Infect. Immun. 70:3500-3509. [DOI] [PMC free article] [PubMed] [Google Scholar]
- 2.Abuaita, B. H., and J. H. Withey. 2009. Bicarbonate induces Vibrio cholerae virulence gene expression by enhancing ToxT activity. Infect. Immun. 77:4111-4120. [DOI] [PMC free article] [PubMed] [Google Scholar]
- 3.Ackermann, M., et al. 2008. Self-destructive cooperation mediated by phenotypic noise. Nature 454:987-990. [DOI] [PubMed] [Google Scholar]
- 4.Arkin, A., J. Ross, and H. H. McAdams. 1998. Stochastic kinetic analysis of developmental pathway bifurcation in phage lambda-infected Escherichia coli cells. Genetics 149:1633-1648. [DOI] [PMC free article] [PubMed] [Google Scholar]
- 5.Balaban, N. Q., J. Merrin, R. Chait, L. Kowalik, and S. Leibler. 2004. Bacterial persistence as a phenotypic switch. Science 305:1622-1625. [DOI] [PubMed] [Google Scholar]
- 6.Berman, T., and B. Magasanik. 1966. The pathway of myo-inositol degradation in Aerobacter aerogenes. J. Biol. Chem. 241:807-813. [PubMed] [Google Scholar]
- 7.Caparon, M. G., R. T. Geist, J. Perez-Casal, and J. R. Scott. 1992. Environmental regulation of virulence in group A streptococci: transcription of the gene encoding M protein is stimulated by carbon dioxide. J. Bacteriol. 174:5693-5701. [DOI] [PMC free article] [PubMed] [Google Scholar]
- 8.Deiwick, J., T. Nikolaus, S. Erdogan, and M. Hensel. 1999. Environmental regulation of Salmonella pathogenicity island 2 gene expression. Mol. Microbiol. 31:1759-1773. [DOI] [PubMed] [Google Scholar]
- 9.Dubnau, D., and R. Losick. 2006. Bistability in bacteria. Mol. Microbiol. 61:564-572. [DOI] [PubMed] [Google Scholar]
- 10.Ferrell, J. E., Jr. 2002. Self-perpetuating states in signal transduction: positive feedback, double-negative feedback and bistability. Curr. Opin. Cell Biol. 14:140-148. [DOI] [PubMed] [Google Scholar]
- 11.Gardner, T. S., C. R. Cantor, and J. J. Collins. 2000. Construction of a genetic toggle switch in Escherichia coli. Nature 403:339-342. [DOI] [PubMed] [Google Scholar]
- 12.Gauchat-Feiss, D., J. Frey, M. Belet, and J. Deshusses. 1985. Cloning of genes involved in myo-inositol transport in a Pseudomonas sp. J. Bacteriol. 162:324-327. [DOI] [PMC free article] [PubMed] [Google Scholar]
- 13.Gonzalez-Pastor, J. E., E. C. Hobbs, and R. Losick. 2003. Cannibalism by sporulating bacteria. Science 301:510-513. [DOI] [PubMed] [Google Scholar]
- 14.Grantcharova, N., V. Peters, C. Monteiro, K. Zakikhany, and U. Romling. 2010. Bistable expression of CsgD in biofilm development of Salmonella enterica serovar Typhimurium. J. Bacteriol. 192:456-466. [DOI] [PMC free article] [PubMed] [Google Scholar]
- 15.Hoffmaster, A. R., and T. M. Koehler. 1997. The anthrax toxin activator gene atxA is associated with CO2-enhanced non-toxin gene expression in Bacillus anthracis. Infect. Immun. 65:3091-3099. [DOI] [PMC free article] [PubMed] [Google Scholar]
- 16.Hyde, J. A., J. P. Trzeciakowski, and J. T. Skare. 2007. Borrelia burgdorferi alters its gene expression and antigenic profile in response to CO2 levels. J. Bacteriol. 189:437-445. [DOI] [PMC free article] [PubMed] [Google Scholar]
- 17.Kawsar, H. I., K. Ohtani, K. Okumura, H. Hayashi, and T. Shimizu. 2004. Organization and transcriptional regulation of myo-inositol operon in Clostridium perfringens. FEMS Microbiol. Lett. 235:289-295. [DOI] [PubMed] [Google Scholar]
- 18.Klumpp, J., and T. M. Fuchs. 2007. Identification of novel genes in genomic islands that contribute to Salmonella typhimurium replication in macrophages. Microbiology 153:1207-1220. [DOI] [PubMed] [Google Scholar]
- 19.Koehler, T. M., Z. Dai, and M. Kaufman-Yarbray. 1994. Regulation of the Bacillus anthracis protective antigen gene: CO2 and a trans-acting element activate transcription from one of two promoters. J. Bacteriol. 176:586-595. [DOI] [PMC free article] [PubMed] [Google Scholar]
- 20.Krings, E., et al. 2006. Characterization of myo-inositol utilization by Corynebacterium glutamicum: the stimulon, identification of transporters, and influence on l-lysine formation. J. Bacteriol. 188:8054-8061. [DOI] [PMC free article] [PubMed] [Google Scholar]
- 21.Kröger, C., and T. M. Fuchs. 2009. Characterization of the myo-inositol utilization island of Salmonella enterica serovar Typhimurium. J. Bacteriol. 191:545-554. [DOI] [PMC free article] [PubMed] [Google Scholar]
- 22.Kröger, C., J. Stolz, and T. M. Fuchs. 2010. myo-Inositol transport by Salmonella enterica serovar Typhimurium. Microbiology 156:128-138. [DOI] [PubMed] [Google Scholar]
- 23.Legakis, N. J., J. T. Papavassiliou, and M. E. Xilinas. 1976. Inositol as a selective substrate for the growth of klebsiellae and serratiae. Zentralbl. Bakteriol. 235:453-458. [PubMed] [Google Scholar]
- 24.Maamar, H., and D. Dubnau. 2005. Bistability in the Bacillus subtilis K-state (competence) system requires a positive feedback loop. Mol. Microbiol. 56:615-624. [DOI] [PMC free article] [PubMed] [Google Scholar]
- 25.Miller, W. G., J. H. Leveau, and S. E. Lindow. 2000. Improved gfp and inaZ broad-host-range promoter-probe vectors. Mol. Plant-Microbe Interact. 13:1243-1250. [DOI] [PubMed] [Google Scholar]
- 26.Miwa, Y., and Y. Fujita. 2001. Involvement of two distinct catabolite-responsive elements in catabolite repression of the Bacillus subtilis myo-inositol (iol) operon. J. Bacteriol. 183:5877-5884. [DOI] [PMC free article] [PubMed] [Google Scholar]
- 27.Neidhardt, F. C., P. L. Bloch, and D. F. Smith. 1974. Culture medium for enterobacteria. J. Bacteriol. 119:736-747. [DOI] [PMC free article] [PubMed] [Google Scholar]
- 28.Novick, A., and M. Weiner. 1957. Enzyme induction as an all-or-none phenomenon. Proc. Natl. Acad. Sci. U. S. A. 43:553-566. [DOI] [PMC free article] [PubMed] [Google Scholar]
- 29.Old, D. C. 1972. Temperature-dependent utilization of meso-inositol: a useful biotyping marker in the genealogy of Salmonella typhimurium. J. Bacteriol. 112:779-783. [DOI] [PMC free article] [PubMed] [Google Scholar]
- 30.Reber, G., M. Belet, and J. Deshusses. 1977. Myo-inositol transport system in Pseudomonas putida. J. Bacteriol. 131:872-875. [DOI] [PMC free article] [PubMed] [Google Scholar]
- 31.Rollenhagen, C., and D. Bumann. 2006. Salmonella enterica highly expressed genes are disease specific. Infect. Immun. 74:1649-1660. [DOI] [PMC free article] [PubMed] [Google Scholar]
- 32.Sambrook, J., and D. W. Russell. 2001. Molecular cloning: a laboratory manual, 3rd ed. Cold Spring Harbor Laboratory, Cold Spring Harbor, NY.
- 33.Sewell, W. A., and J. A. Young. 1975. Secretion of electrolytes by the pancreas of the anaesthetized rat. J. Physiol. 252:379-396. [DOI] [PMC free article] [PubMed] [Google Scholar]
- 34.Sirard, J. C., M. Mock, and A. Fouet. 1994. The three Bacillus anthracis toxin genes are coordinately regulated by bicarbonate and temperature. J. Bacteriol. 176:5188-5192. [DOI] [PMC free article] [PubMed] [Google Scholar]
- 35.Smits, W. K., et al. 2005. Stripping Bacillus: ComK auto-stimulation is responsible for the bistable response in competence development. Mol. Microbiol. 56:604-614. [DOI] [PubMed] [Google Scholar]
- 36.Smits, W. K., O. P. Kuipers, and J. W. Veening. 2006. Phenotypic variation in bacteria: the role of feedback regulation. Nat. Rev. Microbiol. 4:259-271. [DOI] [PubMed] [Google Scholar]
- 37.Yang, J., et al. 2008. Bicarbonate-mediated transcriptional activation of divergent operons by the virulence regulatory protein, RegA, from Citrobacter rodentium. Mol. Microbiol. 68:314-327. [DOI] [PubMed] [Google Scholar]
- 38.Yebra, M. J., et al. 2007. Identification of a gene cluster enabling Lactobacillus casei BL23 to utilize myo-inositol. Appl. Environ. Microbiol. 73:3850-3858. [DOI] [PMC free article] [PubMed] [Google Scholar]
- 39.Yoshida, K., et al. 2004. The fifth gene of the iol operon of Bacillus subtilis, iolE, encodes 2-keto-myo-inositol dehydratase. Microbiology 150:571-580. [DOI] [PubMed] [Google Scholar]
- 40.Yoshida, K., et al. 2008. myo-inositol catabolism in Bacillus subtilis. J. Biol. Chem. 283:10415-10424. [DOI] [PubMed] [Google Scholar]
- 41.Yoshida, K. I., D. Aoyama, I. Ishio, T. Shibayama, and Y. Fujita. 1997. Organization and transcription of the myo-inositol operon, iol, of Bacillus subtilis. J. Bacteriol. 179:4591-4598. [DOI] [PMC free article] [PubMed] [Google Scholar]
- 42.Yoshida, K. I., T. Shibayama, D. Aoyama, and Y. Fujita. 1999. Interaction of a repressor and its binding sites for regulation of the Bacillus subtilis iol divergon. J. Mol. Biol. 285:917-929. [DOI] [PubMed] [Google Scholar]