Abstract
Like other Alphaherpesvirinae subfamily members, bovine herpesvirus 1 (BHV-1) establishes latency in sensory neurons. The latency-related RNA (LR-RNA) is abundantly expressed in latently infected sensory neurons. An LR mutant virus with stop codons at the amino terminus of the first open reading frame (ORF) in the LR gene (ORF2) does not reactivate from latency, in part because it induces higher levels of apoptosis in infected neurons. ORF2 is not the only viral product expressed during latency, but it is important for the latency reactivation cycle because it inhibits apoptosis. In this study, a yeast 2-hybrid screen revealed that ORF2 interacted with two cellular transcription factors, Notch1 and Notch3. These interactions were confirmed in mouse neuroblastoma cells by confocal microscopy and in an in vitro “pulldown” assay. During reactivation from latency, Notch3 RNA levels in trigeminal ganglia were higher than those during latency, suggesting that Notch family members promote reactivation from latency or that reactivation promotes Notch expression. A plasmid expressing the Notch1 intercellular domain (ICD) stimulated productive infection and promoters that encode the viral transcription factor bICP0. The Notch3 ICD did not stimulate productive infection as efficiently as the Notch1 ICD and had no effect on bICP0 promoter activity. Plasmids expressing the Notch1 ICD or the Notch3 ICD trans-activated a late promoter encoding glycoprotein C. ORF2 reduced the trans-activation potential of Notch1 and Notch3, suggesting that ORF2 interfered with the trans-activation potential of Notch. These studies provide evidence that ORF2, in addition to inhibiting apoptosis, has the potential to promote establishment and maintenance of latency by sequestering cellular transcription factors.
Bovine herpesvirus 1 (BHV-1) is an Alphaherpesvirinae subfamily member that causes significant economical losses to the cattle industry (60). The ability of BHV-1 to suppress the immune system can result in life-threatening pneumonia due to secondary bacterial infections, and this multifactorial disorder is known as bovine respiratory disease complex (reviewed in references 28, 31, and 32). As with other human Alphaherpesvirinae subfamily members, the primary site for BHV-1 latency is sensory neurons within trigeminal ganglia (TG). Viral gene expression (56) and infectious virus (21) are detected in TG from 1 to 6 days after infection, but latency is then established. Stress (due to confinement, transporting cattle, restricting food and water, or weaning) increases corticosteroid levels and can initiate reactivation from latency (31). Administration of a synthetic corticosteroid, dexamethasone (DEX), to calves or rabbits latently infected with BHV-1 reproducibly leads to reactivation from latency, as judged by virus shedding from ocular or nasal cavities and a secondary antibody response (21, 26, 27, 29, 30, 52). Induction of lytic cycle viral gene expression is also consistently detected in TG neurons of calves latently infected with BHV-1 following DEX treatment.
Many Alphaherpesvirinae subfamily members, including human herpes simplex virus type 1 (HSV-1) and HSV-2, express abundant levels of a latency-associated transcript (LAT) during latency (reviewed in references 26, 27, and 49). The BHV-1 latency-related (LR) gene, which is in a genomic position similar to that of LAT, expresses an abundant transcript (LR-RNA) in latently infected sensory neurons (53, 54). LAT and the LR gene are antisense with respect to important viral transcriptional regulators, ICP0 and bICP0, respectively, suggesting that they reduce the levels of ICP0 and bICP0. A mutant BHV-1 strain with 3 stop codons at the N terminus of open reading frame 2 (ORF2) (LR mutant virus) does not express ORF2 or reading frame C (RF-C) (25), but it expresses reduced levels of ORF1 (42). The LR mutant virus does not reactivate from latency following DEX treatment (21), suggesting that expression of LR proteins regulates the latency reactivation cycle. Insertion of the LR gene into an HSV-1 LAT null mutant increases the frequency of reactivation from latency (45, 48), indicating that the LR gene can substitute for LAT functions in small-animal models of infection. Although LR gene products or LAT is important for the latency reactivation cycle, it is not clear whether they directly participate in reactivation from latency or if they promote establishment and/or maintenance of latency.
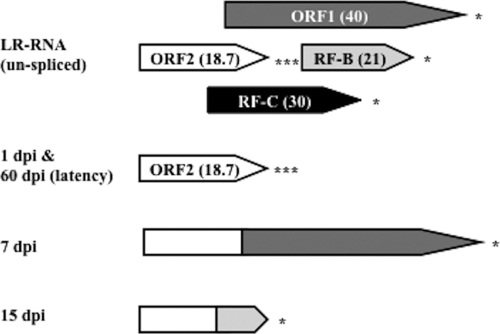
The LR gene encodes more than one product that may be important for the latency reactivation cycle. For example, the LR gene contains two-well defined ORFs (ORF2 and ORF1) (Fig. 1) and two reading frames that lack an initiating methionine (RF-B and RF-C). As a result of alternative splicing of poly(A)+ LR-RNA in TG of infected calves (11, 12), ORF2 can be fused with ORF1 protein coding sequences (cDNA at 7 days postinfection [7 dpi cDNA]) or RF-B (15 dpi cDNA). At 1 day after infection of calves and during latency, splicing occurs in the TG such that ORF2 is intact (Fig. 1). Two micro-RNAs that are expressed during latency are located upstream of ORF2 (24, 25, 42). LR gene products inhibit cell proliferation, bICP0 RNA expression (4, 16, 24, 57), and apoptosis (8). The LR mutant virus induces higher levels of apoptosis in TG neurons of infected calves during establishment of latency (41) than wt BHV-1, and plasmids with the same stop codon mutations exhibit little or no antiapoptosis activity (8, 18). ORF2 coding sequences inhibit apoptosis in transiently transfected cells (58), suggesting that ORF2 is the most important function encoded by the LR gene in the context of the latency reactivation cycle.
FIG. 1.
Schematic of protein coding regions within the LR genes and ORF2 isoforms encoded by alternatively spliced LR transcripts. ORF1 and ORF2 are the open reading frames present in the LR gene (36). RF-B and RF-C each contain an open reading frame that lacks an initiating methionine. The numbers in parentheses are the approximate sizes (in kilodaltons) of the ORFs that are located in the LR gene sequences. The ORF2 isoforms encoded by alternatively spliced LR transcripts detected in TG at 1 dpi and latency, 7 dpi, and 15 dpi (11) are shown as a comparison to ORF2 present in the LR gene. Although the LR-RNA is differentially spliced at 1 day after infection in TG of cattle, both transcripts encode an intact ORF2. Asterisks denote the positions of stop codons that are in frame with the respective ORFs.
Notch receptor family members (Notch1 to -4) are membrane-tethered transcription factors that regulate numerous developmental and physiological processes (5, 14). For example, Notch promotes neuronal maintenance, development, and differentiation (2, 10, 33). Notch3 (61) and Notch1 (46, 55) promote cell survival by activating a protein kinase, AKT, that inhibits apoptosis. Other studies have concluded that Notch family members induce apoptosis (5, 14), suggesting that Notch influences cell survival in a cell- type-dependent fashion. When the Notch receptor is engaged by one of its five transmembrane ligands (Jagged1, Jagged2, Delta-like1, Delta-like3, or Delta-like4), the Notch intracellular domain (ICD) is cleaved by specific proteases and is subsequently translocated to the nucleus. The Notch ICD interacts with members of the CSL family of transcriptional repressors, CBF1, Su(H), or Lag1 (also referred to as RBP-Jκ binding proteins). In general, the Notch ICD-CSL complex binds to specific DNA sequences in certain promoters and subsequently activates genes that regulate growth, cell survival, and differentiation (5, 14).
In this study, we provide evidence that ORF2 interacts with Notch3 and Notch1 proteins. Additional studies suggest that Notch family members promote reactivation from latency or that reactivation from latency activates the Notch signaling pathway. For example, the Notch1 ICD stimulates productive infection; Notch1 protein expression increased during the course of productive infection, and the Notch1 ICD trans-activated the bICP0 immediate early (IE) and early (E) promoters. Notch1 and Notch3 trans-activated a late BHV-1 promoter, glycoprotein C (gC). In addition, ORF2 interfered with the ability of the Notch1 or Notch3 ICD to trans-activate the bICP0 E and gC promoters. Finally, Notch3 RNA levels in TG were higher during DEX-induced reactivation from latency than during latency.
MATERIALS AND METHODS
Cells and viruses.
Murine neuroblastoma (neuro-2A) cells, rabbit skin (RS) cells, and CRIB (bovine kidney) cells were grown in Earle's modified Eagle's medium (EMEM) supplemented with 5% fetal calf serum (FCS), penicillin (10 U/ml), and streptomycin (100 μg/ml).
The Cooper strain of BHV-1 was obtained from the National Veterinary Services Laboratory, Animal and Plant Health Inspection Services, Ames, IA. Stock cultures of BHV-1 were prepared in CRIB cells. A BHV-1 mutant containing the LacZ gene in place of the gC gene was obtained from S. Chowdhury (Baton Rouge, LA) (gCblue virus). The virus grows to similar titers as the wild-type (wt) virus and expresses the LacZ gene as a true late gene.
Plasmids.
The construction and characteristics of the bICP0 E promoter-CAT (chloramphenicol acetyltransferase) constructs (EP-172, EP-143, EP-133, EP-71, EP-50, and EP-42) used in this study were described previously (65, 66). The numbers in the plasmid names refer to the length (in bases) of the bICP0 E promoter fragment cloned into the promoterless vector pCATbasic.
The mammalian ORF2 construct was described previously (58). Briefly, sequences derived from cDNA at 1 day postinfection (dpi) were cloned into pCMV-Tag-2B (Stratagene, La Jolla, CA) downstream of a Flag epitope using BamHI-HindIII restriction enzymes. ORF2 was also codon optimized for bacterial expression and synthesized by IDT (Coralville, IA). XhoI and HindIII restriction enzyme sites were introduced at the 5′ and 3′ ends of the ORF2 gene, respectively. The ORF2 fragment was cleaved with XhoI and HindIII and subsequently ligated in frame into similar sites of a polyhistidine tag within the vector pRSET-A (Invitrogen).
Constructs containing the Notch1 ICD or the Notch3 ICD were cloned into a human cytomegalovirus (CMV) expression construct. These constructs were gifts from U. Lendahl, Karolinska Institute, Sweden (37).
The bICP0 plasmid contains the bICP0 coding sequence under the control of the human CMV promoter and was described previously (23). The empty vector pcDNA3.1 was purchased from Invitrogen.
Yeast 2-hybrid analysis.
Yeast 2-hybrid analysis was performed by Hybrigenics (France), using ORF2 as the prey. The screen was performed using a mouse cDNA library from brain as bait.
Immunofluorescence.
Neuro-2A cells in 60-mm dishes were cotransfected with the plasmids indicated in the respective figure legends by using TransIT Neural (MIR2145; Mirus) according to the manufacturer's instructions. After 48 h, cells were washed twice with warm EMEM without serum and fixed in 4% paraformaldehyde for 10 min at 37°C. Cells were permeabilized with cold 100% ethanol at −20°C for 5 min. After three washes with phosphate-buffered saline (PBS), slides were blocked with 3% bovine serum albumin (BSA) in PBS for 2 h and then incubated with mouse anti-Flag antibody (F1804; Sigma) (1:250) (Flag-ORF2), rabbit anti-Notch1 (6238S; Cell Signaling) (1:250), or rabbit anti-Notch3 (sc-5593; Santa Cruz Biotechnology) (1:250) for 2 h at room temperature. The secondary antibody, goat anti-mouse-Alexa Fluor 633 (A21050; Invitrogen/ Molecular Probes) (1:100) or goat ant-rabbit-Alexa Fluor 488 (A11008; Invitrogen/Molecular Probes) (1:100), was added, and cells were incubated for 1 h at room temperature in the dark. DAPI (4′,6-diamidino-2-phenylindole) (46190; Thermo Scientific) (1:1,000) was used to stain the nucleus. An Olympus IX 81 inverted confocal laser scanning microscope was used to collect images, with excitation/emission of 488/520 nm and 633/660 nm.
Histidine-tagged pulldown assays.
Polyhistidine-tagged ORF2 protein (His-ORF2) or polyhistidine alone (His) was expressed in Escherichia coli BL21(DE3)/pLysS after induction of mid-log-phase bacteria by treatment with 1 mM IPTG (isopropyl-β-d-thiogalactopyranoside) for 4 h. Notch proteins were expressed in neuro-2A or human embryonic kidney (HEK293) cells and collected 2 days after transfection. For the pulldown assay, 2 mg of crude extracts containing His or His-ORF2 was mixed with 200 μl of a 50% slurry of His60 Ni resin (Clontech) for 2 h in binding buffer (50 mM phosphate buffer [pH 7.4], 300 mM NaCl, and 10 mM imidazole). Unbound proteins were subsequently washed off using binding buffer, and nonspecific binding was inhibited by 5% BSA for 3 h. Beads were incubated with 0.25 mg of mammalian cell extract containing exogenously expressed Notch1 or Notch3 ICD for 1 h at 4°C. Pellets were washed 5 times with phosphate buffer containing 500 mM NaCl and 1% NP-40 and then boiled in Laemmli sample buffer for 5 min. Bound proteins were separated by a 12% SDS-polyacrylamide gel and analyzed by Western blot analysis.
CAT reporter assays.
Neuro-2A cells grown in 60-mm dishes were cotransfected with the plasmids indicated in the respective figure legends by using TransIT Neural according to the manufacturer's instructions. After 48 h, cell extract was prepared by three freeze-thaw cycles in 0.25 M Tris-HCl, pH 7.4. Cell debris was pelleted by centrifugation, and protein concentration was determined. CAT activity was measured in the presence of 0.1 μCi [14C]chloramphenicol (CFA754; Amersham Biosciences) and 0.5 mM acetyl coenzyme A (acetyl-CoA) (A2181; Sigma). The reaction mixture was incubated at 37°C for 15 min to 1 h. All forms of chloramphenicol were separated by thin-layer chromatography. CAT activity in 50 μg cell lysate was quantified using a Bio-Rad molecular imager FX (Molecular Dynamics, CA). Levels of CAT activity are expressed as fold induction relative to the vector control level.
β-Gal assay.
The gCblue virus grows to similar titers as wt BHV-1 and was grown in CRIB cells. Procedures for preparing BHV-1 genomic DNA were described previously (66). RS cells grown in 6-well plates were cotransfected with 0.83 μg of the gCblue viral genome and various amounts of plasmid expressing bICP0, Notch1 ICD, or Notch3 ICD using Lipofectamine 2000 (11668-019; Invitrogen). Twenty-four hours after transfection, cells were fixed (2% formaldehyde, 0.2% glutaraldehyde in PBS) and the number of β-galactosidase (β-Gal)-positive cells counted as described previously (66). The number of β-Gal-positive cells in cultures expressing the blank vector was set to 100%. The number of blue cells in cultures transfected with the blank vector was used to calculate fold difference by being divided by the number of blue cells in cultures transfected with bICP0 or Notch. The results are averages from three independent experiments.
RNA preparation and RT.
Neuro-2A cells were cultured in the presence of 1 μM dexamethasone (D2915; Sigma). Total RNA was prepared from cells using TRIzol reagent (Life Technologies) as previously described (65, 66). Three micrograms of RNA was treated with amplification-grade DNase I (Invitrogen). Reverse transcription (RT) was performed using SuperScript III reverse transcriptase (Invitrogen) according to the manufacturer's directions. RNA was reverse transcribed using oligo(dT) primers (Invitrogen). A portion (100 ng) of the resulting cDNA was used as a template for PCR with specific primers for Notch. PCR was performed using GoTaq DNA polymerase (Promega) and initiated at 95°C for 5 min. This was followed by 30 cycles of 95°C for 45 s, 55°C (Notch3) or 65°C (Notch1) for 45 s, and 72°C for 45 s. Final extension was at 72°C for 10 min. PCR products were analyzed on a 1.2% agarose gel. The following primer sequences were used for Notch: Notch1 forward, 5′-TCCTACCTCTGCTTATGCCTCAAG-3′; Notch1 reverse, 5′-GTATCCAGCGACATCATCAATGC-3′; Notch3 forward, 5′-GCTTTGGTCTGCTCAATCCTGTAG-3′; and Notch3 reverse, 5′-TTGGGGGTAACTTCTGGTTGG-3′. GAPDH (glyceraldehyde-3-phosphate dehydrogenase) was used as a control for equivalent sample loading (forward primer, 5′-CCATGGAGAAGGCTGGGG-3′; reverse primer, 5′-CAAAGTTGTCATGGATGACC-3′).
TG from BHV-1-infected calves were collected at necropsy at 60 days after infection and at 6 or 24 h after DEX treatment. TG were stored at −80°C for nucleic acid extraction. TG were minced into small pieces, placed into 3 ml of TRIzol reagent, and processed as stated above.
RESULTS
Notch1 and Notch3 interacted with ORF2 in a yeast two-hybrid screen.
We previously found that a protein encoded by an alternatively spliced LR transcript (7 dpi cDNA) interacts with a cellular transcription factor, C/EBP-alpha (43). The protein encoded by the 7 dpi cDNA is a fusion between ORF2 and ORF1 (11, 12) (Fig. 1). Approximately 2/3 of this fusion protein is derived from ORF1. Recent studies have demonstrated that just ORF2 amino acid sequences (Fig. 1) reduce cold-shock-induced apoptosis in transfected mouse neuroblastoma (neuro-2A) cells (58). The LR mutant virus does not express LR proteins, including ORF2 (25), and induces higher levels of apoptosis in TG neurons during late stages of acute infection (41) than wt BHV-1 indicating that the antiapoptosis functions of ORF2 are important for the latency reactivation cycle. Consequently, we were interested in identifying cellular proteins that interact with just ORF2. To this end, a yeast two-hybrid assay was performed using only ORF2 sequences. Multiple clones of Notch3 and Notch1 were identified in the yeast two-hybrid screen, suggesting that ORF2/Notch interactions were stable. Since Notch family members regulate many developmental processes (2, 10, 33), we focused our studies on the interactions between ORF2 and Notch1 or Notch3 and the potential of Notch family members to regulate productive infection.
ORF2 colocalizes with Notch1 and Notch3.
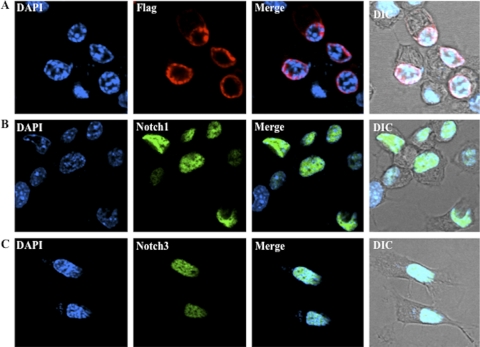
Additional studies were performed to verify that ORF2 interacted with Notch1 and Notch3. Initially, studies were performed to localize ORF2, Notch1, and Notch3. A plasmid that expresses a Flag-tagged ORF2 (58) was transfected into mouse neuroblastoma (neuro-2A) cells to determine its subcellular localization by confocal microscopy. We have consistently detected ORF2 near the periphery of the nucleus (Fig. 2A). As expected, the Flag-specific monoclonal antibody did not stain mock-transfected cells (data not shown). Plasmids that express the ICD of Notch1 or Notch3 were used for these studies because they are constitutively activated and the respective proteins localize to the nucleus (5, 14). As expected, the Notch1 ICD (Fig. 2B) and the Notch3 ICD (Fig. 2C) were detected throughout the nuclei of neuro-2A cells.
FIG. 2.
Localization of ORF2 and Notch family members in neuro-2A cells. Neuro-2A cells were transfected with 4 μg of plasmids expressing Flag-tagged ORF2 (A), Notch1 ICD (B), or Notch3 ICD (C). Cultures were prepared for confocal microscopy at 48 h after transfection as described in Materials and Methods. Cells were stained with anti-Flag antibody (red), anti-Notch1 or -Notch3 antibody (green), or DAPI to visualize ORF2, Notch1/Notch3, and the nucleus, respectively. Differential interference contrast (DIC) was used to show the unstained cells. The images are representative of more than 5 experiments.
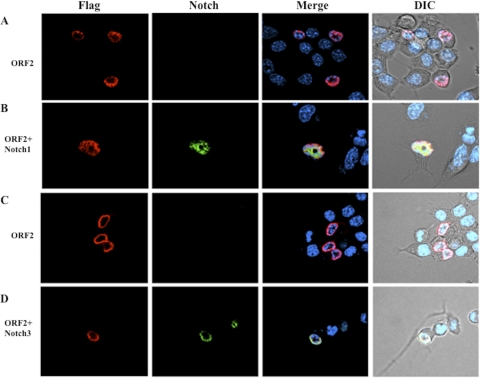
We found that more than 97% (38 of 39) of neuro-2A cells that expressed ORF2 and the Notch1 ICD (Fig. 3B) contained ORF2 diffusely localized throughout the nucleus, and ORF2 appeared to colocalize with the Notch1 ICD. Conversely, the Notch3 ICD localized to the peripheral area within the nucleus in 18/25 cells that expressed both proteins (Fig. 3D), which suggested that Notch3 colocalized with ORF2. Consistent with the results shown in Fig. 2A, ORF2 localized to peripheral areas of the nucleus in the absence of the Notch1 ICD or the Notch3 ICD (Fig. 3A and C). In summary, these results supported the yeast two-hybrid findings demonstrating that Notch1 and Notch3 interacted with ORF2.
FIG. 3.
Colocalization of ORF2 with Notch1 and Notch3. (A and C) Neuro-2A cells were transfected with 4 μg of the plasmid expressing N-terminally Flag-tagged ORF2 and then prepared for confocal microscopy as described in Materials and Methods. Notch1 and Notch3 antibodies (green) and DAPI (blue) were used to stain cells. (B and D) Neuro-2A cells were cotransfected with 4 μg of plasmids expressing N-terminally Flag-tagged ORF2 and the Notch1 or Notch3 ICD. Empty pCMV-Tag-2B was used to equalize DNA amounts. At 48 h after transfection, cells were prepared for confocal microscopy. Cells were stained with anti-Flag antibody (red), anti-Notch1 or -Notch3 antibody (green), and DAPI (blue) to visualize ORF2, Notch1/Notch3, and the nucleus, respectively. The images are representative of at least three independent experiments.
ORF2 interacts with the Notch1 and Notch3 ICDs in pulldown assays.
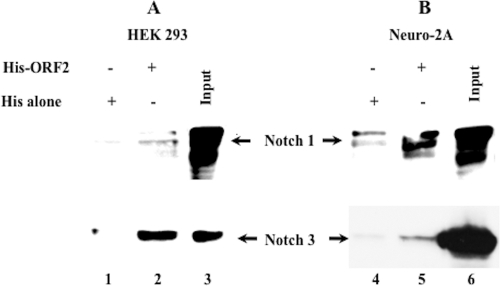
A His-tagged ORF2 fusion protein was expressed in E. coli to further examine interactions between ORF2 and Notch1 or Notch3. The Notch1 ICD or the Notch3 ICD that was expressed in human embryonic kidney (HEK293) (Fig. 4A, lane 2) or neuro-2A (Fig. 4B, lane 5) cells interacted with ORF2 immobilized to the nickel column. Although low levels of Notch1 ICD or Notch3 ICD nonspecifically interacted with the nickel column when cell lysate from HEK293 or neuro-2A cells was incubated with the nickel column (Fig. 4A and B, lanes 1 and 4, respectively), clear-cut differences were observed when ORF2 was bound to the nickel column. We have also attempted coimmunoprecipitation studies to further examine the interactions between Notch1 or Notch3 and ORF2. In some experiments, we could detect coimmunoprecipitation, but the results were not convincing. Since ORF2 is tightly associated with the nucleus (data not shown), we believe that the harsh conditions used to extract it from the nucleus disrupted the association between ORF2 and Notch1 or Notch3. Collectively, these studies indicated that ORF2 interacted with the Notch1 ICD and the Notch3 ICD.
FIG. 4.
Pulldown assay of ORF2 binding to Notch proteins. HEK293 or neuro-2A cells were transiently transfected with DNA constructs that express the Notch1 ICD or the Notch3 ICD. Crude extracts from transfected HEK293 or neuro-2A cells were incubated with His-ORF2 immobilized on nickel beads (lanes 2 and 5) or His alone immobilized on nickel beads (lanes 1 and 4) and probed with antiserum directed against Notch1 or Notch3 after immunoblotting. Input (lanes 3 and 6) equals approximately 20% of the amount of crude extract prepared from E. coli that was used in the pulldown assay. The results are representative of at least 3 independent experiments.
DEX increases steady-state levels of Notch RNA in neuro-2A cells and TG of latently infected calves.
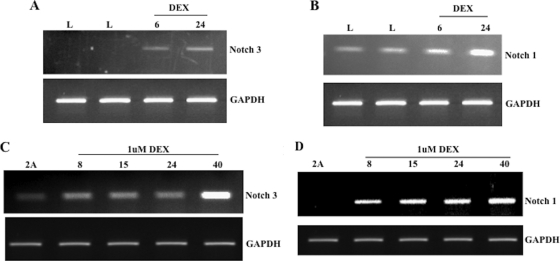
We previously found that the protein encoded by the 7 dpi cDNA interacted with C/EBP-alpha, a cellular transcription factor, and that C/EBP-alpha expression was stimulated during DEX-induced reactivation from latency (43). To examine Notch1 and Notch3 RNA expression in TG, we performed RT-PCR with RNA samples prepared from TG of latently infected calves or latently infected calves treated with DEX to initiate reactivation from latency. In TG of calves treated with DEX, Notch3 RNA levels were induced at 6 and 24 h after treatment (Fig. 5A). Notch1 levels were increased slightly 24 h after DEX treatment (Fig. 5B).
FIG. 5.
DEX treatment induces Notch RNA levels. TG from BHV-1-infected calves were collected at 60 days after infection (latency [L]) and at 6 or 24 h after DEX treatment of latently infected calves. These TG were obtained during the course of other published studies (21, 47, 65). TG were minced into small pieces and then processed as described in Materials and Methods. cDNA was used as the template for PCR with specific primers for Notch1 (B) or Notch3 (A). Neuro-2A cells were cultured in the presence of 1 μM DEX for the designated times (hours). Total RNA was collected and RT-PCR performed using oligo(dT) primers. cDNA was used as the template for PCR with specific primers for Notch1 (D) or Notch3 (C) as described in Materials and Methods. GAPDH was used as a loading control for all studies.
C/EBP-alpha RNA levels are also stimulated by DEX treatment in neuro-2A cells (65). Thus, it was of interest to compare Notch expression levels in neuro-2A cells with and without DEX treatment. In neuro-2A cells treated with DEX, Notch1 but not Notch3 cDNA levels were increased 8 h after treatment (Fig. 5C and D). Notch3 RNA levels were elevated slightly 40 h after DEX treatment (Fig. 5C). GAPDH levels remained the same after DEX treatment, which was expected.
Effect of Notch on productive infection.
Studies with results shown in Fig. 5 demonstrated that in TG of calves latently infected with BHV-1, DEX treatment led to increased Notch3, and to a lesser extent Notch1, RNA levels. Since DEX stimulates BHV-1 reactivation from latency (reviewed in references 27 and 32), we speculated that Notch family members regulate certain aspects of productive infection.
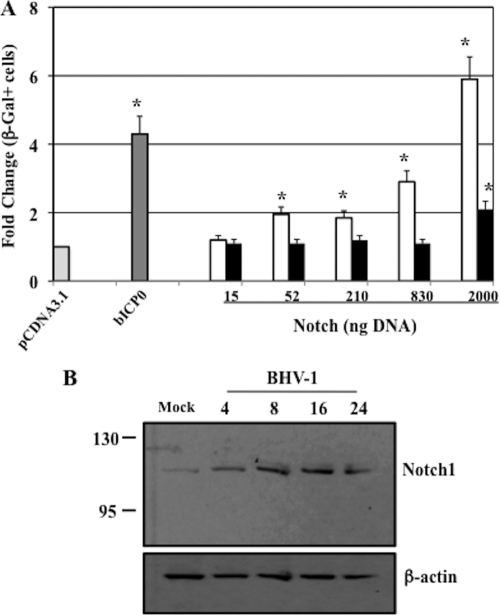
To test whether Notch1 or Notch3 regulated productive infection, rabbit skin (RS) cells were cotransfected with increasing concentrations of a plasmid expressing the Notch1 or Notch3 ICD and with the BHV-1 gCBlue virus, and the efficiency of productive infection was measured. The gCblue virus contains the LacZ gene downstream of the gC promoter, which allows one to measure productive infection by counting β-Gal-positive cells. The number of β-Gal-positive cells directly correlates with plaque formation (15, 16, 22, 43). The gCblue virus grows to similar titers as wt BHV-1 in bovine cells (15, 16, 22, 43). RS cells were used for these studies because they are permissive for BHV-1 and they do not express high levels of Notch proteins. At 24 h after transfection, Notch1 (52, 210, 830, or 2,000 ng plasmid DNA) significantly increased (P < 0.05) the number of β-Gal-positive cells relative to the number achieved with the empty vector (pcDNA3.1) (Fig. 6A, open columns). In contrast, only the highest concentration of Notch3 (2,000 ng plasmid DNA) significantly increased (P < 0.05) the number of β-Gal-positive cells compared to the number with pcDNA3.1 (Fig. 6A, filled columns). As expected, bICP0 (15, 16, 22, 43) increased the number of β-Gal-positive cells.
FIG. 6.
Notch1, but not Notch3, stimulated productive infection. (A) Rabbit skin (RS) cells were cotransfected with increasing amounts of the Notch1 ICD plasmid (open columns) or the Notch3 ICD plasmid (filled columns) (15 ng, 52 ng, 0.21 μg, 0.83 μg, or 2 μg) or bICP0 (52 ng) and the BHV-1 gCblue virus genome (0.83 μg) using Lipofectamine 2000. A blank expression vector (pcDNA3.1) was used to maintain equivalent amounts of DNA. Twenty-four hours after transfection, cells were fixed and stained, and the number of β-Gal-positive cells was counted. The number of β-Gal-positive cells in the vector control was set to 1-fold, and the number of β-Gal-positive cells in each plate was calculated as the fold difference relative to the vector control value. The results are the averages from three independent experiments. An asterisk denotes significant differences (P < 0.05) from the pcDNA3.1 value as determined by the Student t test. (B) RS cells were infected with wt BHV-1 (multiplicity of infection [MOI] of 1) for the designated times (hours). Cell lysate was prepared as described previously, and Western blot assays were performed. Values at left indicate molecular sizes in kilodaltons. The rabbit anti-Notch1 primary antibody was purchased from Cell Signaling (catalogue no. 32685). Rabbit IgG was detected using a donkey anti-rabbit IgG (catalogue no. NA934V; GE Healthcare). The goat antiactin antiserum was purchased from Santa Cruz Biotechnology (catalogue no. sc-1616). Donkey anti-goat IgG was purchased from Santa Cruz Biotechnology (catalogue no. sc-2020).
During productive infection of RS cells, we observed an increase in Notch1 protein levels (Fig. 6B). By 4 or 8 h after infection, we detected levels of Notch1 protein higher than that in mock-infected cells. The size of the Notch1-specific band was the predicted size of the Notch1 ICD (5, 14), suggesting that productive infection stimulated the Notch1 signaling pathway. Confocal microscopy confirmed that higher levels of Notch1 were detected in the nuclei of infected cells than in those of mock-infected cells (data not shown), which supported the finding that Notch1 ICD protein levels were higher in RS cells after infection. As expected, β-actin protein levels did not increase after infection. We also examined Notch3 protein levels during the course of productive infection, but the results were inconclusive (data not shown).
Notch1 ICD induces bICP0 promoter activity.
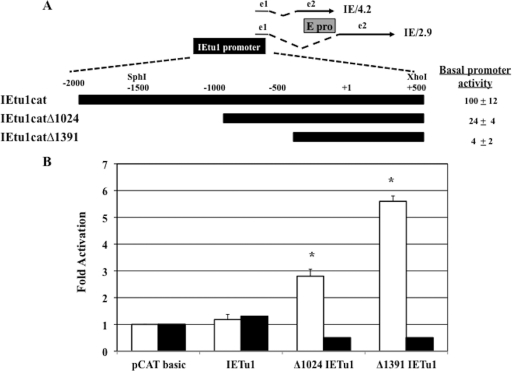
Additional studies were performed to test whether Notch1 or Notch3 trans-activated the immediate early transcription unit 1 (IEtu1) promoter or the bICP0 early (E) promoter. Neuro-2A cells were used for these studies because they are similar to neuronal cells and they do not express detectable levels of Notch1 or Notch3 protein. The IEtu1 promoter activates immediate early expression of two transcripts, IE/2.9 and IE/4.2, which encode the transcriptional regulatory proteins bICP0 and bICP4, respectively (62, 64) (see Fig. 7A for a schematic of the IEtu1 region). Although the largest IEtu1 promoter construct was not trans-activated by Notch1 or Notch3, two smaller constructs, IEtu1catΔ1024 and IEtu1catΔ1391 (with 1,024- and 1,391-bp sequences, respectively, removed from the 5′ terminus), were trans-activated by Notch1 approximately 3-fold and 5-fold, respectively (Fig. 7B), which was significantly different than the pCATbasic values (P < 0.05). The basal promoter activity of IEtu1cat (which contains 1.5 kb of upstream sequences cloned at the 5′ terminus of pSV0CAT) was more than 20-fold higher than that of IEtu1catΔ1391 in neuro-2A cells, suggesting that Notch1 activation was evident only when basal levels of the IEtu1 promoter activity were low. Alternatively, upstream sequences may have a negative impact on Notch-induced trans-activation. Notch3 did not stimulate any of the IEtu1 promoter constructs but consistently reduced the promoter activity of IEtu1catΔ1024 or catΔ1391 IEtu1 approximately 2-fold.
FIG. 7.
Notch1, but not Notch3, stimulates IEtu1 promoter activity. (A) Positions of transcripts that encode bICP4 and bICP0 are shown. Immediate early transcription unit 1 (IEtu1) encodes bICP4 (IE/4.2) and bICP0 (IE/2.9) (63, 64). The IEtu1 promoter activates IE expression of IE/4.2 and IE/2.9. E/2.6 is the early transcript that encodes bICP0, and an early promoter (E pro) activates expression of this early transcript (62). Exon 2 (e2) of bICP0 contains all of the protein coding sequences of bICP0. The dashed lines are intron sequences. IEtu1cat contains 1.5 kb of upstream sequences cloned at the 5′ terminus of pSV0CAT (a promoter minus the CAT expression vector). V. Misra, Saskatoon, Canada, provided the IEtu1cat plasmid (44). The two deletion constructs Δ1024 IEtu1 and Δ1391 IEtu1 have 1,024- and 1,391-bp sequences, respectively, removed from the 5′ terminus. The basal promoter activities of the respective constructs were measured in neuro-2A cells. The basal promoter activity of IEtu1cat was normalized to 100%, and results for the other 2 promoters were compared to this value (percentages shown at right). The results are the averages from 3 independent experiments. (B) Neuro-2A cells were cotransfected with the designated IEtu1 promoter constructs (1 μg DNA) and plasmids expressing the Notch1 ICD (open columns) or the Notch3 ICD (filled columns) using 1 μg of plasmid DNA. The CAT activity of cells transfected with the control CAT vector was set to 1-fold. All other values are expressed as fold activation with respect to the control value. The results are the averages from three independent experiments. An asterisk denotes significant differences (P < 0.05) from the pCATbasic trans-activation value as determined by the Student t test.
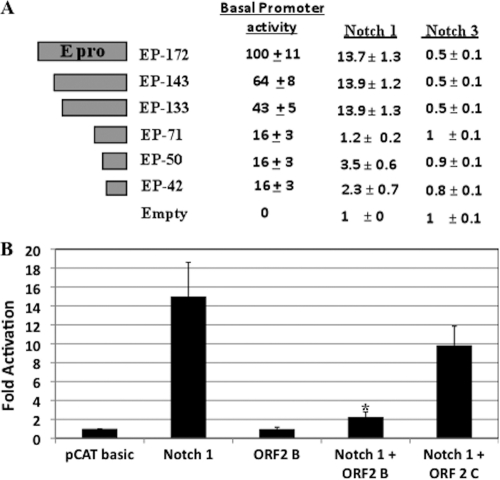
The bICP0 E promoter also activates bICP0 expression (62) (see Fig. 7A for the location of the bICP0 E promoter). Recent studies concluded that the bICP0 E promoter is preferentially stimulated during reactivation from latency (65). Three bICP0 E promoter constructs (EP-172, EP-143, and EP-133) were stimulated approximately 13-fold by Notch1 but not Notch3 (Fig. 8A). Conversely, EP-71, EP-50, and EP-42 were not trans-activated more than 4-fold by Notch1 or Notch3. Sequences that are present in EP-133 but lacking in EP-71 were important for Notch1 trans-activation and basal activity. Conversely, the additional sequences in EP-172 played no role in Notch1 trans-activation, but these sequences enhanced basal promoter activity of EP-172 approximately 2-fold relative to that of EP-133. In summary, these studies demonstrated that Notch1 trans-activated the IEtu1 and bICP0 E promoters.
FIG. 8.
Notch1 stimulates bICP0 E promoter activity. (A) Neuro-2A cells were cotransfected with 1 μg of the designated bICP0 E promoter construct and 1 μg of a plasmid that expresses the Notch1 ICD or the Notch3 ICD. DNA amounts were equalized for all transfections using pcDNA3.1, a blank expression vector. For further details of the respective bICP0 E promoter constructs, see Materials and Methods and references 65 and 66. At 48 h posttransfection, cells were collected and processed for CAT activity as described in Materials and Methods. The basal promoter activity of EP-172 was set at 100%, and the values of the other constructs were compared to that for EP-172. For the Notch1 and Notch3 columns, the CAT activity of cells transfected with the control CAT vector was set to 1-fold. All other values are expressed as fold activation with respect to that for the control. The results are the averages from three independent experiments. (B) Neuro-2A cells were cotransfected with 1 μg EP-172 and 1 μg of the plasmid that expresses the Notch1 ICD along with 1 μg of empty vector (pcDNA3.1), ORF2 in the correct reading frame (ORF2B), or ORF2 in the incorrect reading frame (ORF2C). At 48 h after transfection, cells were collected and processed for CAT activity as described in Materials and Methods. The CAT activity of cells transfected with the control CAT vector was set to 1-fold. All other values are expressed as fold activation with respect to that for the control. The results are the averages from three independent experiments. An asterisk denotes significant differences (P < 0.05) from the Notch1 trans-activation value as determined by the Student t test.
ORF2 inhibits Notch-induced trans-activation.
Since ORF2 interacted with the Notch1 and Notch3 ICDs, we tested whether ORF2 affected trans-activation of the bICP0 E promoter by Notch1. The ORF2 plasmid that expresses the ORF2 protein (ORF2B) reduced the ability of Notch1 to trans-activate EP-172 promoter activity approximately 4-fold (Fig. 8B), which was significantly different than the trans-activation value of Notch1 (P < 0.05). Conversely, the ORF2B construct had no effect on EP-172 promoter activity in the absence of Notch1. We also examined a construct that was cloned such that the ORF2 protein is not expressed but LR-RNA is expressed, because it is not in frame with the FLAG tag (ORF2C) (58). Relative to results for the ORF2B construct, the ORF2C construct reduced trans-activation of EP-172 by Notch1 less than 2-fold, which was not significantly different from the trans-activation value of Notch1 alone.
Notch1 and Notch3 ICDs stimulate a viral late promoter.
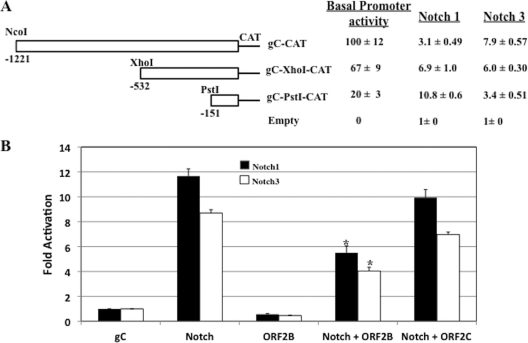
To further examine the ability of the Notch1 and Notch3 ICDs to regulate viral transcription, we tested whether a late promoter, glycoprotein C (gC), could be trans-activated by the Notch1 or Notch3 ICD. For these studies, we used three gC promoter constructs, which were described previously (67) (Fig. 9A). As expected, deletion of the gC promoter sequences led to reduced basal promoter activity. In neuro-2A cells, a plasmid expressing the Notch1 ICD trans-activated the smallest gC promoter construct (gC-PstI-CAT) 10-fold, whereas it stimulated the larger constructs less efficiently (Fig. 9A). The Notch3 ICD-expressing plasmid stimulated gC-CAT approximately 8-fold, but lower levels of trans-activation were observed with the two smaller constructs (gC-XhoI-CAT and gC-PstI-CAT).
FIG. 9.
Notch stimulates glycoprotein C promoter activity. (A) Neuro-2A cells were cotransfected with 1 μg of the designated glycoprotein C (gC) promoter construct and 1 μg of a plasmid expressing the Notch1 ICD or the Notch3 ICD. DNA amounts were equalized for all transfections using pcDNA3.1. The gC promoter constructs were described previously (67). The basal promoter activity of gC-CAT was assigned the value of 100%. For the Notch1 and Notch3 columns, the values are expressed as fold stimulations. The value for the empty vector was set at 1. The level of Notch stimulation is denoted as fold activation. (B) Neuro-2A cells were cotransfected with 1 μg gC-PstI-CAT or gC-CAT, 1 μg of the Notch1 ICD or the Notch3 ICD, respectively, and ORF2 in the correct reading frame (ORF2B) or ORF2 in the incorrect reading frame (ORF2C). As a control for basal promoter activity, the respective promoters were cotransfected with ORF2B. Empty vector (pcDNA3.1) was used to keep the same amount of DNA in the transfection mixture. At 48 h after transfection, cells were collected and processed for CAT activity as described in Materials and Methods. The CAT activity of cells transfected with the control CAT vector was set to 1-fold. All other values are expressed as fold activation with respect to that for the control. The results are the averages from three independent experiments. An asterisk denotes significant differences (P < 0.05) from the Notch-alone trans-activation value as determined by the Student t test.
Although ORF2 reduced the ability of the Notch1 ICD to trans-activate the gC-CAT promoter approximately 2-fold (Fig. 9B), expression of ORF2 (ORF2B) had little effect on basal promoter activity. The ability of ORF2 to inhibit gC promoter activity was not as efficient as that observed with the bICP0 E promoter (Fig. 8B). The ORF2 construct that was out of frame (ORF2C) had little effect on Notch1 ICD trans-activation (Fig. 9B). Likewise, ORF2 inhibited the ability of the Notch3 ICD to trans-activate gC-PstI-CAT promoter activity approximately 2-fold, but the ORF2B construct had little effect on basal promoter activity. ORF2B, but not ORF2C, significantly reduced the levels of Notch1 and Notch3 trans-activation (P < 0.05). In summary, these studies demonstrated that the Notch1 and Notch3 ICDs stimulated gC promoter activity and that ORF2 protein expression reduced Notch trans-activation.
DISCUSSION
Several lines of evidence presented in this study indicated that ORF2 interacted, directly or indirectly, with Notch1 and Notch3. To the best of our knowledge, this is the first example of a protein encoded by a herpesvirus member that directly interacts with a Notch family member. Notch family members control the developmental pathway of many cell types in mammals and Drosophila (reviewed in references 5 and 14). A previous study demonstrated that a protein encoded by the alternatively spliced LR transcript (7 dpi cDNA) interacts with C/EBP-alpha, a cellular transcription factor (43). In the previous two-hybrid screen, we did not detect an interaction between Notch1 or Notch3 and the protein encoded by the 7 dpi cDNA (11, 12). Since the protein encoded by the 7 dpi cDNA contains 2/3 of its amino acid sequences from ORF1 and the rest from ORF2, the two-hybrid screen likely detected cellular proteins that interacted with ORF1 sequences. These findings also suggested that alternative splicing of LR-RNA in TG of infected cattle leads to expression of a family of LR proteins. The LR family of proteins is predicted to interact with different cellular proteins and perform specific functions during the latency reactivation cycle.
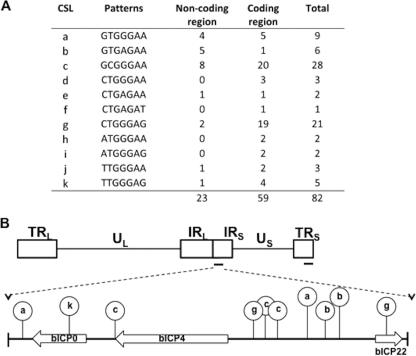
Eleven known consensus binding sites for CSL (RBP-Jκ) exist (50). The BHV-1 genome contains 82 potential binding sites for CSL, of which 22 are located in noncoding regions (Fig. 10A ). Interestingly, six CSL binding sites are near the 5′ terminus of bICP4 and bICP22 (Fig. 10B). We suggest that CSL binding sites in the BHV-1 genome were partially responsible for the ability of Notch1 to stimulate productive infection. Further support for Notch stimulating productive infection comes from the finding that the Notch1 ICD trans-activated the bICP0 E promoter, the IEtu1 promoter, and certain gC promoter constructs. With respect to the IEtu1 promoter, we observed higher levels of trans-activation with the smallest promoter fragment (Δ1391 IEtu1) (Fig. 7B) than with the other constructs. All three promoter constructs are efficiently trans-activated by b-TIF, the BHV-1 functional homologue of VP16 (44). The basal activity of IEtu1cat was higher than Δ1024 IEtu1 or Δ1391 IEtu1 promoter basal activity (Fig. 7A), suggesting that the high basal activity of IEtu1cat masked the trans-activation of Notch1. Conversely, it is possible that upstream sequences within the IEtu1 promoter have a negative impact on Notch1-induced trans-activation. The Notch1 responsive domain within the bICP0 E promoter was localized to 62 bases present in EP-133 but lacking in EP-71 (Fig. 8A). Within these 62 bases, there are no identical matches to known CSL binding sites. However, there are 8 CSL-like motifs that contain mismatches in 2 bases. This may be significant, because a recent report concluded that overlapping CSL-like binding sites can confer Notch responsiveness dependent on dimerization of Notch family members (40). Additional studies are necessary to identify the cis-acting sequences in the bICP0 E, IEtu1, or gC promoter that are necessary for Notch trans-activation and to determine whether activation is by a direct mechanism.
FIG. 10.
Predicted CSL binding sites in the BHV-1 genome. (A) Eleven variants of known canonical CSL binding sites have been identified (50). The numbers of CSL consensus binding sites identified in the noncoding and coding regions of the BHV-1 genome are denoted. (B) Schematic of the entire BHV-1 genome, which consists of two unique regions, UL and US; terminal repeats, TRL and TRS; and internal repeats between the unique regions, IRL and IRS. Six potential CSL binding sites are located within the intergenic region between the bICP4 and bICP22 coding regions. At least one CSL binding site is detected upstream of bICP0. Lowercase letters correspond to the CSL binding sites characterized in panel A.
In the absence of Notch family members, CSL binding proteins interact with transcriptional repressors (3), including the histone demethylase KDM5A (39). These findings suggest that CSL binding proteins may help maintain latency by recruiting transcriptional repressor complexes to the BHV-1 genome. During the course of DEX-induced reactivation, increased expression levels of Notch family members may result in the displacement of repressors from the BHV-1 genome. Microarray analysis revealed that several genes in the Notch signaling pathway, including those encoding the proteases that cleave and activate Notch, are stimulated in TG of latently infected calves following DEX treatment for 6 h (unpublished data), adding further support to the concept that the Notch signaling pathway is activated during early stages of reactivation from latency. Productive infection also activates the Notch1 signaling pathway, because we detected higher levels of the Notch1 ICD after infection, which correlated with the finding that Notch1 stimulated productive infection. Although we believe that the Notch signaling pathway may promote reactivation from latency, it is unlikely that Notch family members are the only cellular transcription factors that stimulate reactivation from latency.
Notch3 had little or no effect on the bICP0 E promoter or the IEtu1 promoter and stimulated productive infection only 2-fold. The findings that Notch3 RNA levels were induced within 6 h after DEX treatment and that Notch3 trans-activated a late promoter (gC) suggested that Notch3 has different effects on productive infection than Notch1. In keeping with these observations, Notch3 is known to possess novel functions compared to those of other Notch family members. For example, Y box protein 1 is a novel ligand that specifically binds to Notch3 (51). Furthermore, the Notch3 ICD is generally considered to be a poor activator of transcription (1), which partially explains why it did not efficiently stimulate productive infection. Third, mutations in Notch3 are the cause of cerebral autosomal dominant arteriopathy with subcortical infarcts and leukoencephalopathy (CADASIL), a hereditary angiopathy that causes stroke and vascular dementia (13). Fourth, Notch3 is differentially expressed relative to Notch1 in the developing nervous system (20). Finally, Notch1 and Notch 2 knockout mice die during embryogenesis (9, 59), whereas Notch3 knockout mice are viable and do not apparently have redundant functions compared to those of the Notch1 gene (35). Consequently, we predict that the novel properties of Notch3 promoted gC promoter activity and perhaps expression of additional late genes.
The Notch signaling pathway is known to play a role in the latency reactivation cycle of two human herpesviruses, Kaposi's sarcoma-associated herpesvirus (KSHV) (38) and Epstein-Barr virus (EBV) (34). In contrast to the finding that Notch itself plays a role in the BHV-1 latency reactivation cycle, the CSL family of proteins (RBP-Jκ) is the key component of the Notch signaling pathway that participates in the latency reactivation cycle of EBV and KSHV. For example, RBP-Jκ is necessary for KSHV reactivation from latency because it interacts with the viral protein RTA (replication and transcriptional activator) (38). Conversely, EBNA2 (EBV nuclear antigen 2) interacts with RBP-Jκ and trans-activates two EBV promoters that encode 7 proteins necessary for stabilizing the EBV genome, stimulating B cell growth, inhibiting B cell apoptosis, and consequently promoting Latency III (34). The Notch ICD cannot entirely replace RTA to reactivate KSHV latency (6, 7, 38) or EBNA-2 to establish and maintain Latency III (17, 19). Although KSHV and EBV usurp the Notch signaling pathway, they do not appear to encode a protein that physically interacts with Notch family members and negatively regulates Notch-dependent transcription.
Since LR gene expression, and presumably ORF2 expression, is dramatically reduced during DEX-induced reactivation from latency (52), ORF2 does not appear to directly stimulate reactivation from latency. We propose that ORF2 increases the pool of latently infected neurons capable of supporting reactivation from latency. Interactions between ORF2 and Notch1 or Notch3 are thus expected to promote the establishment and/or maintenance of latency. Although ORF2 inhibits apoptosis (58), this study suggested that ORF2 also regulates viral transcription by interacting with cellular transcription factors. Two additional studies provide evidence that ORF2 may regulate transcription (11, 43). Consequently, we suggest that the ability of ORF2 to inhibit apoptosis and interact with cellular transcription factors promotes lifelong latency. The LR gene encodes other proteins and expresses at least 2 micro-RNAs that reduce bICP0 protein levels (24, 25, 42), suggesting that these functions play a supportive role during the latency reactivation cycle.
Acknowledgments
This research was supported by grants from the USDA (08-00891 and 09-01653). An NIH grant to the Nebraska Center for Virology (1P20RR15635) also supported certain aspects of these studies, in particular, the confocal microscopy core center. Aspen Workman and Devis Sinani were partially supported by a Ruth L. Kirschstein National Research Service Award 1 T32 AIO60547 (National Institute of Allergy and Infectious Diseases).
Footnotes
Published ahead of print on 29 December 2010.
REFERENCES
- 1.Beatus, P., J. Lundkvist, C. Oberg, and U. Lendahl. 1999. The Notch 3 intracellular domain represses Notch 1-mediated activation through Hairy/Enhancer of split (HES) promoters. Development 126:3925-3935. [DOI] [PubMed] [Google Scholar]
- 2.Berezovska, O., et al. 1999. Notch1 inhibits neurite outgrowth in postmitotic primary neurons. Neuroscience 93:433-439. [DOI] [PubMed] [Google Scholar]
- 3.Borggrefe, T., and F. Oswald. 2009. The Notch signaling pathway: transcriptional regulation at Notch target genes. Cell. Mol. Life Sci. 66:1631-1646. [DOI] [PMC free article] [PubMed] [Google Scholar]
- 4.Bratanich, A. C., N. D. Hanson, and C. Jones. 1992. The latency-related gene of bovine herpesvirus 1 inhibits the activity of immediate-early transcription unit 1. Virology 191:988-991. [DOI] [PubMed] [Google Scholar]
- 5.Bray, S. J. 2006. Notch signalling: a simple pathway becomes complex. Nat. Rev. Mol. Cell Biol. 7:678-689. [DOI] [PubMed] [Google Scholar]
- 6.Carroll, K. D., et al. 2006. Kaposi's sarcoma-associated herpesvirus lytic switch protein stimulates DNA binding of RBP-Jk/CSL to activate the Notch pathway. J. Virol. 80:9697-9709. [DOI] [PMC free article] [PubMed] [Google Scholar]
- 7.Chang, H., D. P. Dittmer, S. Y. Chui, Y. Hong, and J. U. Jung. 2005. Role of Notch signal transduction in Kaposi's sarcoma-associated herpesvirus gene expression. J. Virol. 79:14371-14382. [DOI] [PMC free article] [PubMed] [Google Scholar]
- 8.Ciacci-Zanella, J., M. Stone, G. Henderson, and C. Jones. 1999. The latency-related gene of bovine herpesvirus 1 inhibits programmed cell death. J. Virol. 73:9734-9740. [DOI] [PMC free article] [PubMed] [Google Scholar]
- 9.Conlon, R. A., A. G. Reaume, and J. Rossant. 1995. Notch1 is required for the coordinate segmentation of somites. Development 121:1533-1545. [DOI] [PubMed] [Google Scholar]
- 10.Cornell, R., and J. S. Eisen. 2005. Notch in the pathway: the roles of Notch signalling in neural crest development. Semin. Cell Dev. Biol. 16:663-672. [DOI] [PubMed] [Google Scholar]
- 11.Devireddy, L., Y. Zhang, and C. Jones. 2003. Cloning and initial characterization of an alternatively spliced transcript encoded by the bovine herpes virus 1 latency related (LR) gene. J. Neurovirol. 9:612-622. [DOI] [PubMed] [Google Scholar]
- 12.Devireddy, L. R., and C. Jones. 1998. Alternative splicing of the latency-related transcript of bovine herpesvirus 1 yields RNAs containing unique open reading frames. J. Virol. 72:7294-7301. [DOI] [PMC free article] [PubMed] [Google Scholar]
- 13.Dichgans, M., J. Herzog, and T. Gasser. 2001. NOTCH3 mutations involving three cysteine residues in a family with typical CADASIL. Neurology 57:1714-1717. [DOI] [PubMed] [Google Scholar]
- 14.Ehebauer, M., P. Hayward, and A. M. Arias. 2006. Notch, a universal arbiter of cell fate decisions. Science 314:1414-1415. [DOI] [PubMed] [Google Scholar]
- 15.Geiser, V., and C. Jones. 2003. Stimulation of bovine herpesvirus 1 productive infection by the adenovirus E1A gene and a cell cycle regulatory gene, E2F-4. J. Gen. Virol. 84:929-938. [DOI] [PubMed] [Google Scholar]
- 16.Geiser, V., M. Inman, Y. Zhang, and C. Jones. 2002. The latency related (LR) gene of bovine herpes virus 1 (BHV-1) can inhibit the ability of bICP0 to activate productive infection. J. Gen. Virol. 83:2965-2971. [DOI] [PubMed] [Google Scholar]
- 17.Gordadze, A. V., et al. 2001. Notch1IC partially replaces EBNA2 function in B cells immortalized by Epstein-Barr virus. J. Virol. 75:5899-5912. [DOI] [PMC free article] [PubMed] [Google Scholar]
- 18.Henderson, G., G.-C. Perng, A. Nesburn, S. Wechsler, and C. Jones. 2004. The latency related gene of bovine herpesvirus 1 can suppress caspase 3 and caspase 9 during productive infection. J. Neurovirol. 10:64-70. [DOI] [PubMed] [Google Scholar]
- 19.Hofelmayr, H., et al. 1999. Activated mouse Notch1 transactivates Epstein-Barr virus 2-regulated viral promoters. J. Virol. 73:2770-2780. [DOI] [PMC free article] [PubMed] [Google Scholar]
- 20.Ichinohe, A., K. Takahashi, T. Tabira, and S. Takashima. 2004. Early and late development of Notch 3 in human brains. Neuroembryology 5:13-38. [Google Scholar]
- 21.Inman, M., L. Lovato, A. Doster, and C. Jones. 2002. A mutation in the latency-related gene of bovine herpesvirus 1 interferes with the latency reactivation cycle of latency in calves. J. Virol. 76:6771-6779. [DOI] [PMC free article] [PubMed] [Google Scholar]
- 22.Inman, M., L. Lovato, A. Doster, and C. Jones. 2001. A mutation in the latency-related gene of bovine herpesvirus 1 leads to impaired ocular shedding in acutely infected calves. J. Virol. 75:8507-8515. [DOI] [PMC free article] [PubMed] [Google Scholar]
- 23.Inman, M., Y. Zhang, V. Geiser, and C. Jones. 2001. The zinc ring finger in the bICP0 protein encoded by bovine herpes virus-1 mediates toxicity and activates productive infection. J. Gen. Virol. 82:483-492. [DOI] [PubMed] [Google Scholar]
- 24.Jaber, T., A. Workman, and C. Jones. 2010. Small noncoding RNAs encoded within the bovine herpesvirus 1 latency-related gene can reduce steady-state levels of infected cell protein 0 (bICP0). J. Virol. 84:6297-6307. [DOI] [PMC free article] [PubMed] [Google Scholar]
- 25.Jiang, Y., M. Inman, Y. Zhang, N. A. Posadas, and C. Jones. 2004. A mutation in the latency-related gene of bovine herpesvirus 1 inhibits protein expression of a protein from open reading frame 2 and an adjacent reading frame during productive infection. J. Virol. 78:3184-3189. [DOI] [PMC free article] [PubMed] [Google Scholar]
- 26.Jones, C. 1998. Alphaherpesvirus latency: its role in disease and survival of the virus in nature. Adv. Virus Res. 51:81-133. [DOI] [PubMed] [Google Scholar]
- 27.Jones, C. 2003. Herpes simplex virus type 1 and bovine herpesvirus 1 latency. Clin. Microbiol. Rev. 16:79-95. [DOI] [PMC free article] [PubMed] [Google Scholar]
- 28.Jones, C. 2009. Regulation of innate immune responses by bovine herpesvirus 1 and infected cell protein 0. Viruses 1:255-275. [DOI] [PMC free article] [PubMed] [Google Scholar]
- 29.Jones, C., et al. 2000. Analysis of latency in cattle after inoculation with a temperature sensitive mutant of bovine herpesvirus 1 (RLB106). Vaccine 18:3185-3195. [DOI] [PubMed] [Google Scholar]
- 30.Jones, C., et al. 2006. Functional analysis of bovine herpesvirus 1 (BHV-1) genes expressed during latency. Vet. Microbiol. 113:199-210. [DOI] [PubMed] [Google Scholar]
- 31.Jones, C., and S. Chowdhury. 2010. Bovine herpesvirus type 1 is an important cofactor in the bovine respiratory disease complex, p. 303-321. In V. L. Cooper and B. W. Broderson (ed.), Veterinary clinics of North America, food animal practice, bovine respiratory disease. W. B. Saunders Company, Philadelphia, PA. [DOI] [PubMed]
- 32.Jones, C., and S. Chowdhury. 2008. A review of the biology of bovine herpesvirus type 1 (BHV-1), its role as a cofactor in the bovine respiratory disease complex, and development of improved vaccines. Adv. Anim. Health 8:187-205. [DOI] [PubMed] [Google Scholar]
- 33.Justice, N. J., and Y. N. Jan. 2002. Variations on the Notch pathway in neural development. Curr. Opin. Neurobiol. 12:64-70. [DOI] [PubMed] [Google Scholar]
- 34.Kieff, E., and A. Rickinson. 2007. Epstein-Barr virus and its replication, p. 2603-2654. In D. M. Knipe, P. M. Howley, D. E. Griffin, R. A. Lamb, M. A. Martin, B. Roizman, and S. E. Straus (ed.), Fields virology, 4th ed. Lippincott Williams & Wilkins, Philadelphia, PA.
- 35.Krebs, L. T., et al. 2003. Characterization of Notch3-deficient mice: normal embryonic development and absence of genetic interactions with a Notch1 mutation. Genesis 37:139-143. [DOI] [PubMed] [Google Scholar]
- 36.Kutish, G., T. Mainprize, and D. Rock. 1990. Characterization of the latency-related transcriptionally active region of the bovine herpesvirus 1 genome. J. Virol. 64:5730-5737. [DOI] [PMC free article] [PubMed] [Google Scholar]
- 37.Lardelli, M., R. Williams, T. Mitsiadis, and U. Lendahl. 1996. Expression of the Notch 3 intracellular domain in mouse central nervous system progenitor cells is lethal and leads to disturbed neural tube development. Mech. Dev. 59:177-190. [DOI] [PubMed] [Google Scholar]
- 38.Liang, Y., J. Chang, S. J. Lynch, D. M. Lukac, and D. Ganem. 2002. The lytic switch protein of KSHV activates gene expression via functional interaction with RBP-Jkappa (CSL), the target of the Notch signalling pathway. Genes Dev. 16:1977-1989. [DOI] [PMC free article] [PubMed] [Google Scholar]
- 39.Liefke, R., et al. 2010. Histone demethylase KDM5A is an integral part of the core Notch-RBP-J repressor complex. Genes Dev. 24:590-610. [DOI] [PMC free article] [PubMed] [Google Scholar]
- 40.Liu, H., et al. 2010. Notch dimerization is required for leukomogenesis and T-cell development. Genes Dev. 24:2395-2407. [DOI] [PMC free article] [PubMed] [Google Scholar]
- 41.Lovato, L., M. Inman, G. Henderson, A. Doster, and C. Jones. 2003. Infection of cattle with a bovine herpesvirus 1 strain that contains a mutation in the latency-related gene leads to increased apoptosis in trigeminal ganglia during the transition from acute infection to latency. J. Virol. 77:4848-4857. [DOI] [PMC free article] [PubMed] [Google Scholar]
- 42.Meyer, F., et al. 2007. Identification of a novel protein encoded by the latency-related gene of bovine herpesvirus 1. J. Neurovirol. 13:569-578. [DOI] [PMC free article] [PubMed] [Google Scholar]
- 43.Meyer, F., et al. 2007. A protein encoded by the bovine herpes virus 1 latency-related gene interacts with specific cellular regulatory proteins, including the CCAAT enhancer binding protein alpha. J. Virol. 81:59-67. [DOI] [PMC free article] [PubMed] [Google Scholar]
- 44.Misra, V., A. C. Bratanich, D. Carpenter, and P. O'Hare. 1994. Protein and DNA elements involved in transactivation of the promoter of the bovine herpesvirus (BHV) 1 IE-1 transcription unit by the BHV alpha gene trans-inducing factor. J. Virol. 68:4898-4909. [DOI] [PMC free article] [PubMed] [Google Scholar]
- 45.Mott, K., et al. 2003. The bovine herpesvirus 1 LR ORF2 is crucial for this gene's ability to restore the high reactivation phenotype to a herpes simplex virus-1 LAT null mutant. J. Gen. Virol. 84:2975-2985. [DOI] [PubMed] [Google Scholar]
- 46.Nair, P., K. Somasundaram, and S. Krishna. 2003. Activated Notch1 inhibits p53-induced apoptosis and sustains transformation by human papilloma virus type 16 E6 and E7 oncogenes through a PI3K-PKB/Akt-dependent pathway. J. Virol. 77:7106-7112. [DOI] [PMC free article] [PubMed] [Google Scholar]
- 47.Perez, S., M. Inman, A. Doster, and C. Jones. 2005. Latency-related gene encoded by bovine herpesvirus 1 promotes virus growth and reactivation from latency in tonsils of infected calves. J. Clin. Microbiol. 43:393-401. [DOI] [PMC free article] [PubMed] [Google Scholar]
- 48.Perng, G.-C., et al. 2002. A gene capable of blocking apoptosis can substitute for the herpes simplex virus type 1 latency-associated transcript gene and restore wild-type reactivation levels. J. Virol. 76:1224-1235. [DOI] [PMC free article] [PubMed] [Google Scholar]
- 49.Perng, G.-C., and C. Jones. 2010. Towards an understanding of the herpes simplex virus type 1 latency-reactivation cycle. Interdiscip. Perspect. Infect. Dis. 2010:1-18. [DOI] [PMC free article] [PubMed] [Google Scholar]
- 50.Persson, L. M., and A. C. Wilson. 2010. Wide-scale use of Notch signaling RTA-mediated activation of factor CSL/RBP-J kappa in Kaposi's sarcoma-associated herpesvirus lytic genes. J. Virol. 84:1334-1347. [DOI] [PMC free article] [PubMed] [Google Scholar]
- 51.Rauen, T., et al. 2009. YB-1 acts as a ligand for Notch-3 receptors and receptor activation. J. Biol. Chem. 284:26928-26940. [DOI] [PMC free article] [PubMed] [Google Scholar]
- 52.Rock, D., J. Lokensgard, T. Lewis, and G. Kutish. 1992. Characterization of dexamethasone-induced reactivation of latent bovine herpesvirus 1. J. Virol. 66:2484-2490. [DOI] [PMC free article] [PubMed] [Google Scholar]
- 53.Rock, D. L., et al. 1987. Detection of latency-related viral RNAs in trigeminal ganglia of rabbits latently infected with herpes simplex virus type 1. J. Virol. 61:3820-3826. [DOI] [PMC free article] [PubMed] [Google Scholar]
- 54.Rock, D. L., S. L. Beam, and J. E. Mayfield. 1987. Mapping bovine herpesvirus type 1 latency-related RNA in trigeminal ganglia of latently infected rabbits. J. Virol. 61:3827-3831. [DOI] [PMC free article] [PubMed] [Google Scholar]
- 55.Sade, H., S. Krishna, and A. Sarin. 2004. The anti-apoptotic effect of Notch-1 requires p56lck-dependent, AKT/PKB-mediated signaling in T cells. J. Biol. Chem. 279:2937-2944. [DOI] [PubMed] [Google Scholar]
- 56.Schang, L., and C. Jones. 1997. Analysis of bovine herpesvirus 1 transcripts during a primary infection of trigeminal ganglia of cattle. J. Virol. 71:6786-6795. [DOI] [PMC free article] [PubMed] [Google Scholar]
- 57.Schang, L. M., A. Hossain, and C. Jones. 1996. The latency-related gene of bovine herpesvirus 1 encodes a product which inhibits cell cycle progression. J. Virol. 70:3807-3814. [DOI] [PMC free article] [PubMed] [Google Scholar]
- 58.Shen, W., and C. Jones. 2008. Open reading frame 2, encoded by the latency-related gene of bovine herpesvirus 1, has antiapoptotic activity in transiently transfected neuroblastoma cells. J. Virol. 82:10940-10945. [DOI] [PMC free article] [PubMed] [Google Scholar]
- 59.Swiatek, P. J., C. E. Lindsell, F. Franco del Amo, G. Weinmaster, and T. Gridley. 1994. Notch1 is essential for postimplantation development in mice. Genes Dev. 8:707-719. [DOI] [PubMed] [Google Scholar]
- 60.Turin, L., S. Russo, and G. Poli. 1999. BHV-1: new molecular approaches to control a common and widespread infection. Mol. Med. 5:261-284. [PMC free article] [PubMed] [Google Scholar]
- 61.Wang, T., et al. 2007. Notch 3 activation modulates growth behavior and cross talks to Wnt/TCF signalling pathway. Cell. Signal. 19:2458-2467. [DOI] [PubMed] [Google Scholar]
- 62.Wirth, U. V., et al. 1992. Immediate-early RNA 2.9 and early RNA 2.6 of bovine herpesvirus 1 are 3′ coterminal and encode a putative zinc finger transactivator protein. J. Virol. 66:2763-2772. [DOI] [PMC free article] [PubMed] [Google Scholar]
- 63.Wirth, U. V., K. Gunkel, M. Engels, and M. Schwyzer. 1989. Spatial and temporal distribution of bovine herpesvirus 1 transcripts. J. Virol. 63:4882-4889. [DOI] [PMC free article] [PubMed] [Google Scholar]
- 64.Wirth, U. V., B. Vogt, and M. Schwyzer. 1991. The three major immediate-early transcripts of bovine herpesvirus 1 arise from two divergent and spliced transcription units. J. Virol. 65:195-205. [DOI] [PMC free article] [PubMed] [Google Scholar]
- 65.Workman, A., S. Perez, A. Doster, and C. Jones. 2009. Dexamethasone treatment of calves latently infected with bovine herpesvirus 1 leads to activation of the bICP0 early promoter, in part by the cellular transcription factor C/EBP-alpha. J. Virol. 83:8800-8809. [DOI] [PMC free article] [PubMed] [Google Scholar]
- 66.Workman, A., and C. Jones. 2010. Bovine herpesvirus 1 productive infection and bICP0 early promoter activity are stimulated by E2F1. J. Virol. 84:6308-6317. [DOI] [PMC free article] [PubMed] [Google Scholar]
- 67.Zhang, Y., Y. Jiang, J. Zhou, and C. Jones. 2006. The bovine herpes virus 1 (BHV-1) immediate early protein (bICP0) interacts with the histone acetyltransferase p300, and these interactions correlate with stimulation of gC promoter activity. J. Gen. Virol. 87:1843-1851. [DOI] [PubMed] [Google Scholar]


