Abstract
In x-ray diffraction microscopy, iterative algorithms retrieve reciprocal space phase information, and a real space image, from an object's coherent diffraction intensities through the use of a priori information such as a finite support constraint. In many experiments, the object's shape or support is not well known, and the diffraction pattern is incompletely measured. We describe here computer simulations to look at the effects of both of these possible errors when using several common reconstruction algorithms. Overly tight object supports prevent successful convergence; however, we show that this can often be recognized through pathological behavior of the phase retrieval transfer function. Dynamic range limitations often make it difficult to record the central speckles of the diffraction pattern. We show that this leads to increasing artifacts in the image when the number of missing central speckles exceeds about 10, and that the removal of unconstrained modes from the reconstructed image is helpful only when the number of missing central speckles is less than about 50. This simulation study helps in judging the reconstructability of experimentally recorded coherent diffraction patterns.
1. Introduction
X-ray diffraction microscopy is an imaging method with no optics-imposed efficiency or resolution limits. Following an initial suggestion by Sayre [1], Miao et al. showed that one could reconstruct an image of a coherently-illuminated object from its measured diffraction intensities [2]. This was done by using a finite support constraint iterative phase retrieval algorithm as demonstrated by Fienup [3]; a “finite support” refers to a known subset of the reconstructed image field which contains the object and can often be inferred from the object's autocorrelation or Patterson map.
Because the coherent diffraction intensities provide information on the modulus but not the phase of the object's Fourier plane representation, the goal of various phase retrieval algorithms [3–8] is to recover the Fourier plane phases and thus by simple Fourier transform (in the farfield geometry; Fresnel transforms can be used in the near-field geometry) reconstruct the exit wave leaving the specimen. The unknown Fourier plane phases can only be recovered if there is some other information available regarding the object. The most common constraint used is to work with objects that scatter light from only a subset of the Shannon-sampled image field, in which case the finite support constraint in the reconstruction algorithm matches the physical characteristics of the object. The finite support constraint is imposed by adjusting pixel values outside the support towards zero, and the measured diffraction intensities are imposed as a modulus constraint in Fourier space. Considering a complex image to be a vector in Hilbert space, the iterative process can be modeled as sequential projections to subspaces defined by constraints.
It has been shown that these constraints lead to unique solutions to phase retrieval problems in two or higher dimensions [9]. After the first experimental demonstration performed in 1999 [2], x-ray diffraction microscopy was rapidly developed and applied to image material and biological samples in both 2D and 3D.
In many actual experiments, neither constraint is perfectly determined. For soft matter or biological samples without sharp boundaries, dedicated effort is required to refine the object support, although the autocorrelation function and shrink-wrap procedure [10] can guide the way to some extent. Since the intensity distribution of a diffraction pattern exceeds the dynamic range of regular CCD detectors, the intense low spatial frequency signal of the diffraction pattern is usually blocked by a beam stop leaving an area with missing data in the center. A recent experiment successfully reduced the missing center size to less than one speckle [11], but the missing centers usually obscure more. The imperfection of the Fourier modulus constraint also comes from experimental noises, and this problem has been discussed in [12].
In this work, we address the influence of imperfect constraints on three categories of algorithms [13]: Error Reduction [14] (ER, gradient descent to local minima), Hybrid Input-Output [3] and Difference Map [4] (HIO and DM, spirally convergent to global minima), and Relaxed Averaged Alternating Reflectors [8] (RAAR, between the other two categories), with incorrect supports and varying sizes of missing low spatial frequency data through simulation.
2. Simulation setup
The object used in this study is a simulated biological-cell-like object as in [15]. The 200 pixel diameter spherical simulated cell filled with 10% protein solution is embedded in the center of a 400×400×400 pixel ice cube with a pixel size of 15 nm. The cell has 3 pixel thick lipid membrane, protein bars and protein ellipsoids inside. A bud with an 80 pixel diameter is added to the right shoulder to break central symmetry. The refractive indices for 520 eV incident x-rays within the water window are calculated from tabulated values [16] using a stoichiometric composition of H48.6C32.9N8.9O8.9S0.3 and density of ρ = 1.35 g/cm3 for protein, and H62.5C31.5O6.3 with ρ = 1.0 for lipid [17].
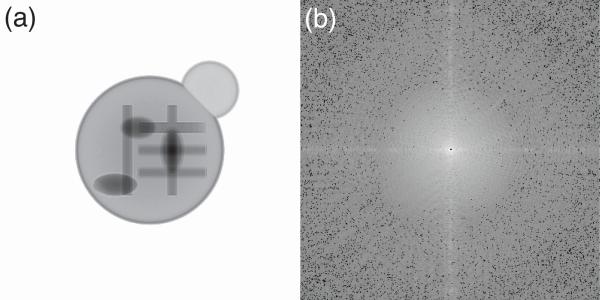
The simulated cell's complex-value exit wave was generated by assuming a plane wave illumination with 106 incident photons per pixel followed by a multislice propagation process [18, 19]. The simulated exit wave is shown in Fig. 1(a). The far-field diffraction pattern was calculated by Fourier transforming this exit wave. Photon noise simulated using a positive-integer-truncated Gaussian distribution was added to the resulting diffraction intensity as shown in Fig. 1(b).
Fig. 1.
(a) The exit wave magnitude of the simulated fake cell. (b) Simulated diffraction pattern with photon noise and 2×2 pixel missing center.
Note that the initial exit wave presents an object in a bright background. According to Babinet's principle, its contrast-flipped counterpart image with a dark background gives the identical diffraction intensity except for the central pixel. In this study, an area of at least 2×2 pixels is set to zero at the center of the diffraction pattern to represent the region typically blocked due to detector saturation. A typical reconstructed image magnitude is shown in Fig. 2(a). For HIO and RAAR algorithms, β was set to 0.9. For DM, β = 1.15, γm = β–1 and γs = –β–1 were used in this simulation. Besides the support and the Fourier modulus constraints, no other constraint (such as positivity constraint) was used in this simulation. Because 2 pairs of Fourier transforms are applied in a DM iteration, while 1 pair is applied in a HIO, ER and RAAR iterations, the iteration numbers of the latter 3 algorithms were doubled from that of DM. In the simulation, DM was run 1000 iterations and averaging started after 800 iterations with an interval of 2 iterations. The other 3 algorithms were run 2000 iterations and averaging started after 1600 iterations with an interval of 4 iterations. With each algorithm, reconstruction was performed 10 times from individual random phase starts [20], and the final image was averaged from those 10 reconstructions.
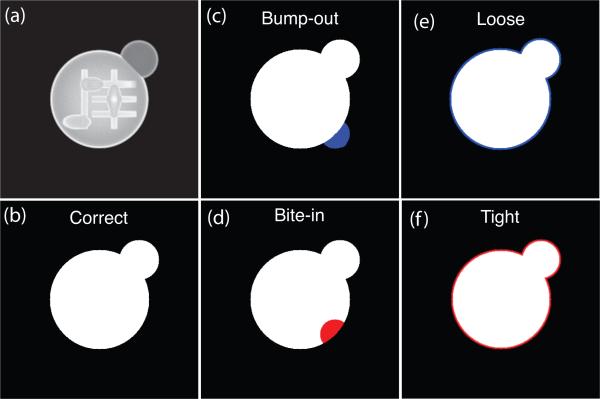
Fig. 2.
Illustration of the various support errors studied. A blue area denotes a region added to the correct support. A red area denotes a region removed from the correct support. (a) Magnitude of a reconstructed cell image from diffraction pattern with 2×2 pixel missing center. (b) The correct support. (c) The “bump-out” support generated by including 1439 pixels (out of 400×400) outside the correct support at a local area. (d) The “bite-in” support generated by excluding 1382 pixels inside the correct support at a local area. (e) The “loose” support generated by increasing the size of the correct support uniformly by 2 pixels which adds 1477 pixels. (f) The “tight” support generated by reducing the correct support size uniformly by 2 pixels which removes 1439 pixels.
3. Incorrect support tolerance
In simulations with a known object, one knows exactly what support constraint to apply. However, in experiments one may have only imperfect knowledge of the object's support as obtained from the autocorrelation of the diffraction pattern. While the support constraint can be gradually improved through the use of a “shrinkwrap” procedure [10], one can still wind up with an incorrect support constraint. For this reason, we carried out a series of simulations where we introduced known errors onto the support and examined their effects on reconstructed images. The correct support was generated from the shape of the simulated cell, as shown in Fig. 2(b). The “bump-out” incorrect support was obtained by including a number of pixels (1439 pixels) outside the correct support at a local area (Fig. 2(c)). The “bite-in” support excludes some pixels (1382 pixels, or 0.9% of the 400×400 array) inside the correct support at a local area (Fig. 2(d)). The “loose” support increases the size of the correct support uniformly by 2 pixels which adds 1477 pixels (Fig. 2(e)). The “tight” support reduces the correct support size uniformly by 2 pixels which removes 1439 pixels (Fig. 2(f)).
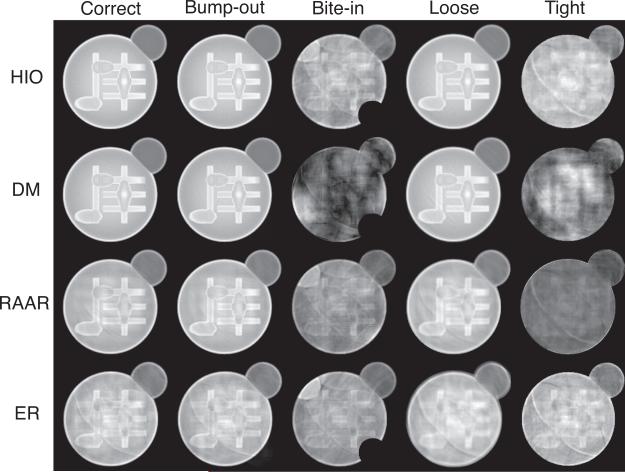
The reconstructed images with different supports are shown in Fig. 3. We also used two measurements to quantify the image quality: a real space r factor Rreal [21] calculated as
| (1) |
and a signal-to-noise ratio SNR [15] calculated as
| (2) |
where M1,2 and I1,2 are magnitudes and intensities of two reconstructed images with individual random starts. Rreal compares the normalized difference between reconstructed images, and SNR measures their consistency. Smaller Rreal and larger SNR indicate more reliable reconstructions. Table 1 shows that HIO and DM give the best reconstruction quality for correct, bump-out and loose supports. RAAR gives abnormally good Rreal and SNR values, while the images show significant artifacts, which implies that the algorithm is more likely to stagnate at an incorrect solution when using incorrect supports. The reconstructed image quality from ER doesn't vary much at a relatively poor level with different supports.
Fig. 3.
Reconstructed image magnitudes with HIO, DM, RAAR and ER algorithms using correct, “bump-out”, “bite-in”, “loose” and “tight” supports. Only the central part of images are displayed.
Table 1.
Real space r factor Rreal and signal-to-noise ratio SNR of reconstructed images with different supports. Smaller Rreal and larger SNR indicate more reliable reconstructions. The best image quality is highlighted for each case
| Correct | Bump-out | Bite-in | Loose | Tight | ||||||
|---|---|---|---|---|---|---|---|---|---|---|
| Rreal | SNR | Rreal | SNR | Rreal | SNR | Rreal | SNR | Rreal | SNR | |
| HIO | 0.7% | 30.2 | 0.7% | 32.1 | 21.1% | 4.5 | 2.7% | 4.7 | 10.2% | 3.6 |
| DM | 1.0% | 25.2 | 1.0% | 28.5 | 71.4% | 1.1 | 2.2% | 4.8 | 70.5% | 0.8 |
| RAAR | 5.2% | 2.5 | 4.6% | 3.4 | 1.0% | 16.4 | 8.7% | 1.9 | 0.8% | 14.3 |
| ER | 7.4% | 1.6 | 8.5% | 1.7 | 8.4% | 1.6 | 12.1% | 1.2 | 8.2% | 1.3 |
All the algorithms give good reconstructions for the correct support. For the bump-out support, because the extra support area does not introduce translation ambiguity, the reconstruction quality is not affected significantly. For the bite-in support, the reconstructed image quality becomes worse, because the overly tight support imposes a constraint for a different object which would not have the same Fourier modulus. For the loose support, in order to mitigate translation ambiguity, the output image from each iteration was aligned with one iterate using the peak of the cross correlation function. It also gives reasonable reconstructions. For the tight support, all algorithms failed to find the solution for the same reason as for bite-in support.
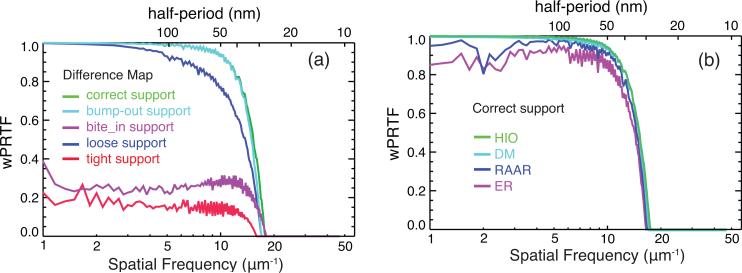
Figure 4(a) shows Wiener-filtered Phase Retrieval Transfer Function (wPRTF) [22] curves from the DM algorithm with different supports. The wPRTF curves for the correct and bump-out supports are almost overlapping. The loose supports lead to a noticeable decrease in the wPRTF curves at higher spatial frequencies, as fine features are not well constrained in their real space locations. The wPRTF's from the bite-in and tight supports are dramatically lower, which means they lead to less consistent phase retrieval. Figure 4(b) plots PRTF curves from different algorithms with the correct support, which shows that HIO gives images with best quality. All these conclusions are consistent with those from Rreal and SNR metrics.
Fig. 4.
Wiener-filtered phase retrieval transfer functions: (a) from DM reconstructions with different supports, (b) from different algorithms with the correct support.
The fact that the bump-out support does not affect reconstruction quality could be used in the support-refining process. If a part of the support is not defined with sufficient confidence, we can enlarge the support in that area and keep the rest of the support untouched. Reconstruction with the new support could give a new boundary of the object in the target area.
4. Missing center tolerance
Because far field diffraction patterns tend to have their signal decrease as the fourth power of spatial frequency, the center pixels can be saturated on many present-day detectors. While one can use a variety of beamstop positions and assemble multiple images to minimize this limitation, it is often the case that one works with coherent diffraction intensities with unreliable or unknown values at some number of pixels near the center. For this reason, we carried out a series of reconstruction simulations with various numbers of missing central pixels in the diffraction intensities, ranging from 2×2 pixels up to 15×15. The 2D oversampling ratio σ , i.e. the entire image array pixel number divided by reconstructed object pixel number is about 4.6 in these simulations, so the corresponding missing speckle number can be calculated by dividing the missing pixel number with σ. To test the oversampling ratio dependency of reconstructions, we generated a second simulated cell with the same features and an oversampling ratio of 7.5 by increasing the ice cube size to 512 × 512 × 512 pixels and keeping the cell size the same. The missing center sizes for this cell were tested up to 19×19 pixels.
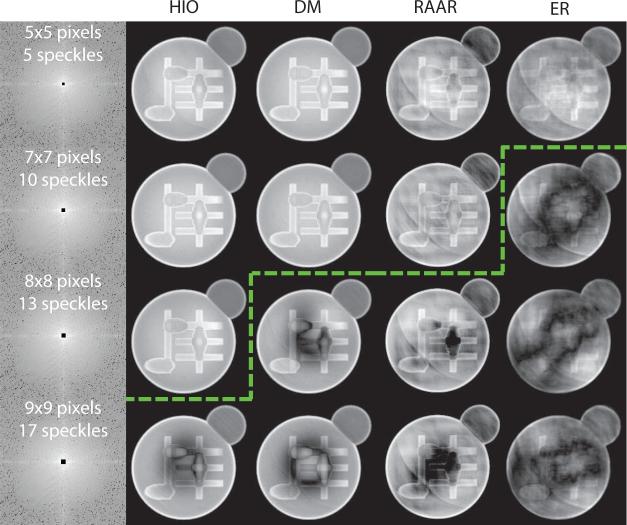
Some reconstructed images of the σ = 4.6 simulated cell are shown in Fig. 5. HIO has the highest tolerance for missing center size with no significant artifact showing up to 13 missing speckles. DM works well up to 10 missing speckles. RAAR and ER do not reconstruct images well with missing data.
Fig. 5.
Magnitudes of reconstructed images of the σ = 4.6 simulated cell from different algorithms with varying sizes of missing centers. Only the central part of diffraction patterns and reconstructed images are displayed. The green line indicates where artifacts becomes noticeable in reconstructed images.
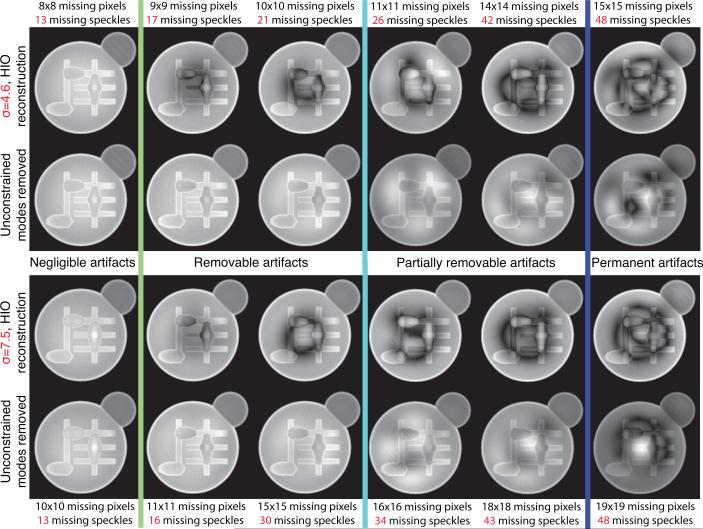
Artifacts presented in reconstructed images using diffraction pattern with missing center can be modeled as Fourier transform pairs which satisfy both support and Fourier modulus constraints so that they are allowed by algorithms using those constraints. We used the approach proposed in [19] to approximate these missing modes using harmonic oscillator modes as an orthogonal basis set. These modes were ranked by their corresponding eigenvalues which represent coefficients of the mode expansion distributed in the measured pattern and outside the support. The least constrained modes were then scaled and subtracted from the original reconstructed image in the way that minimizes the variance of pixel values within the support. Images before and after removing modes from HIO reconstructions for both σ = 4.6 and σ = 7.5 simulated cells are shown in Fig. 6. Up to 13 missing speckles, no obvious artifact emerges in reconstructions for both cases. Removing unconstrained modes recovers images up to 21 missing speckles for σ = 4.6 cell and 30 for σ = 7.5. Above that level, artifacts cannot be completely removed. When the missing speckle number becomes larger than 48, remarkable artifacts show up in images even with unconstrained modes removed in both cases. The starting points for non-negligible and permanent artifacts are not sensitive to the oversampling ratio, while the recoverable tolerance range can be improved with larger σ .
Fig. 6.
Image magnitudes before and after unconstrained modes were removed from HIO reconstructions with various missing center sizes for σ = 4.6 cell (top row) and σ = 7.5 cell (bottom row). Up to 13 missing speckles, the artifacts in reconstructed images are negligible in both cases. Unconstrained mode removal works well up to 21 missing speckles for the σ = 4.6 cell, and 30 for the σ = 7.5 cell. Above that level, artifacts cannot be completely removed. When the missing speckle number is greater than 48, permanent artifacts are present in images in both cases.
To quantify these observations, Rreal (Eq. (1)) was calculated with respect to the perfect image before and after removing unconstrained modes for HIO reconstructions of both cells, which are plotted as dark and gray curves in Fig. 7. Considering that Rreal measures the difference from the perfect image, we can see a Rreal jump when the missing speckle number increases beyond 13 for both σ = 4.6 and σ = 7.5, which implies that the reconstruction quality becomes significantly worse above that level. Rreal climbs after 21 missing speckles for σ = 4.6 and after 30 for σ = 7.5 in the mode-removed curves, which means that removing unconstrained modes cannot fully recover the image any more. There is another Rreal jump after 42 missing speckles in curves both with and without removal of unconstrained modes for both cells, where permanent artifacts are left in images. The red curves in Fig. 7 show SNR calculated from HIO reconstructions. The SNR curves are flattened at around 13 missing speckles, where the algorithm might converge to a pseudo-stable stagnation solution. It decreases again after 21 and 30 missing speckles for σ = 4.6 and σ = 7.5 cells, respectively. Both Rreal and SNR are consistent with the quality of reconstructed images shown in Fig. 6. We did not carry out this analysis for a variety of simulated objects with the same oversampling ratio; we suspect that one would have different detailed results but a similar trend of sensitivity to missing central speckles.
Fig. 7.
Measurements of the effects of missing central speckles in the measured diffraction intensities. Shown here are both the signal-to-noise ratio with unconstrained modes removed (red curve), and Rreal calculated before (grey curve) and after (black curve) removal of unconstrained missing modes. The results are shown for the same size simulated cell in a smaller array (σ = 4.6) at left, and a larger array (σ = 7.5) at right.
5. Conclusion
We have carried out simulation studies to illuminate the effects of two specific errors that can arise in x-ray diffraction microscopy or coherent diffraction imaging. We have found that overly tight support constraints prevent all algorithms from obtaining a high quality reconstruction of the object. However, we also found that “bump-out” or local extra additions to the support constraint do not affect reconstruction quality, so that the addition of various local bump-outs can be used to help refine the support constraint. For missing low spatial frequency data, noticeable artifacts start to appear when the missing speckle number is larger than about 10 for HIO (the number is lower for DM, RAAR and ER). When the missing speckle number rises to about 50, permanent artifacts are shown in reconstructions. These two thresholds are not dependent on the over-sampling ratio. With missing speckle numbers between 10 and 50, artifacts can be removed by removing unconstrained modes, and the recoverable tolerance range is sensitive to the over-sampling ratio.
Acknowledgments
We wish to thank the Division of Materials Sciences and Engineering, Office of Basic Energy Sciences, at the Department of Energy for support of x-ray diffraction microscopy methods and instrumentation under contract DE-FG02-07ER46128. We also wish to thank the National Institute for General Medical Services at the National Institutes for Health for support of the application of this method to biological imaging under contract 5R21EB6134. Finally, we thank David Shapiro, Stefano Marchesini and David Sayre for many helpful discussions.
Footnotes
OCIS codes: (110.7440) X-ray imaging; (050.1940) Diffraction; (110.3010) Image reconstruction techniques; (110.4280) Noise in imaging systems.
References and links
- 1.Sayre D. Prospects for long-wavelength X-ray microscopy and diffraction. In: Schlenker M, Fink M, Goedgebuer J, Malgrange C, Viénot J, Wade R, editors. Imaging Processes and Coherence in Physics. Springer-Verlag; 1980. pp. 229–235. vol. 112 of >Lecture Notes in Physics. [Google Scholar]
- 2.Miao J, Charalambous P, Kirz J, Sayre D. An extension of the methods of x-ray crystallography to allow imaging of micron-size non-crystalline specimens. Nature. 1999;400:342–344. [Google Scholar]
- 3.Fienup J. Phase retrieval algorithms: a comparison. Appl. Opt. 1982;21:2758–2769. doi: 10.1364/AO.21.002758. [DOI] [PubMed] [Google Scholar]
- 4.Elser V. Phase retrieval by iterated projections. J. Opt. Soc. Am. A. 2003;20:40–55. doi: 10.1364/josaa.20.000040. [DOI] [PubMed] [Google Scholar]
- 5.Abrahams JP, Leslie AWG. Methods used in the structure determination of bovine mitochondrial F1 ATPase. Acta Crystallogr. D Biol. Crystallogr. 1996;52:30–42. doi: 10.1107/S0907444995008754. [DOI] [PubMed] [Google Scholar]
- 6.Bauschke HH, Combettes PL, Luke DR. Phase retrieval, error reduction algorithm, and Fienup variants: a view from convex optimization. J. Opt. Soc. Am. A. 2002;19:1334–1345. doi: 10.1364/josaa.19.001334. [DOI] [PubMed] [Google Scholar]
- 7.Bauschke HH, Combettes PL, Luke DR. Hybrid projection-reflection method for phase retrieval. J. Opt. Soc. Am. A. 2003;20:1025–1034. doi: 10.1364/josaa.20.001025. [DOI] [PubMed] [Google Scholar]
- 8.Luke DR. Relaxed averaged alternating reflections for diffraction imaging. Inverse Probl. 2005;21:37–50. [Google Scholar]
- 9.Bates RHT. Fourier phase problems are uniquely solvable in more than one dimension. I. Underlying theory. Optik. 1982;61:247–262. [Google Scholar]
- 10.Marchesini S, He H, Chapman H, Hau-Riege S, Noy A, Howells M, Weierstall U, Spence J. X-ray image reconstruction from a diffraction pattern alone. Phys. Rev. B. 2003;68:140, 101. [Google Scholar]
- 11.Jiang H, Song C, Chen C, Xu R, Raines K, Fahimian B, Lu C, Lee T, Nakashima A, Urano J, Ishikawa T, Tamanoi F, Miao J. Quantitative 3D imaging of whole, unstained cells by using X-ray diffraction microscopy. Proc. Natl. Acad. Sci. U.S.A. 2010;107:11,234–11,239. doi: 10.1073/pnas.1000156107. [DOI] [PMC free article] [PubMed] [Google Scholar]
- 12.Williams G, Pfeifer M, Vartanyants I, Robinson I. Effectiveness of iterative algorithms in recovering phase in the presence of noise. Acta Crystallogr. A. 2007;63:36–42. doi: 10.1107/S0108767306047209. [DOI] [PubMed] [Google Scholar]
- 13.Marchesini S. A unified evaluation of iterative projection algorithms for phase retrieval. Rev. Sci. Instrum. 2007;78:011, 301. doi: 10.1063/1.2403783. [DOI] [PubMed] [Google Scholar]
- 14.Gerchberg RW, Saxton WO. A practical algorithm for the determination of phase from image and diffraction plane pictures. Optik. 1972;35:237–246. [Google Scholar]
- 15.Huang X, Miao H, Steinbrener J, Nelson J, Stewart A, Shapiro D, Jacobsen C. Signal to noise considerations in diffraction and conventional microscopy. Opt. Express. 2009;17:13,541–13,553. doi: 10.1364/oe.17.013541. [DOI] [PMC free article] [PubMed] [Google Scholar]
- 16.Henke BL, Gullikson EM, Davis JC. X-ray Interactions: Photoabsorption, Scattering, Transmission, and Reflection at E=50–30,000 eV, Z=1–92. At. Data Nucl. Data Tables. 1993;54:181–342. [Google Scholar]
- 17.London RA, Rosen MD, Trebes JE. Wavelength choice for soft x-ray laser holography of biological samples. Appl. Opt. 1989;28:3397–3404. doi: 10.1364/AO.28.003397. [DOI] [PubMed] [Google Scholar]
- 18.Cowley JM, Moodie AF. Fourier Images. I. The Point Source. Proc. Phys. Soc. B. 1957;70:486–496. [Google Scholar]
- 19.Thibault P, Elser V, Jacobsen C, Shapiro D, Sayre D. Reconstruction of a yeast cell from x-ray diffraction data. Acta Crystallogr. A. 2006;62:248–261. doi: 10.1107/S0108767306016515. [DOI] [PubMed] [Google Scholar]
- 20.Chen C-C, Miao J, Wang CW, Lee TK. Application of optimization technique to noncrystalline x-ray diffraction microscopy: Guided hybrid input-output method. Phys. Rev. B. 2007;76:064113. [Google Scholar]
- 21.Miao J, Nishino Y, Kohmura Y, Johnson B, Song C, Risbud S, Ishikawa T. Quantitative Image Reconstruction of GaN Quantum Dots from Oversampled Diffraction Intensities Alone. Phys. Rev. Lett. 2005;95:085, 503. doi: 10.1103/PhysRevLett.95.085503. [DOI] [PubMed] [Google Scholar]
- 22.Steinbrener J, Nelson J, Huang X, Marchesini S, Shapiro D, Turner J, Jacobsen C. Data preparation and evaluation techniques for x-ray diffraction microscopy. Opt. Express. 2010;18:18,598–18,614. doi: 10.1364/OE.18.018598. [DOI] [PMC free article] [PubMed] [Google Scholar]


