Abstract
Adiponectin is an adipokine playing an important role in regulating energy homeostasis and insulin sensitivity. However, the effect of adiponectin on bone metabolism shows contradictory results according to different research studies. In this study femurs were isolated from genetically double-labeled mBSP9.0Luc/β-ACT-EGFP transgenic mice and were transplanted into adiponectin knock-out mice or wild type mice to investigate the effect of temporary exposure to adiponectin deficiency on bone growth and metabolism. We found that the growth of bone explants in adiponectin knock-out mice was significantly retarded. Histological analysis, microcomputed tomography analysis, and tartrate-resistant acid phosphatase staining revealed reduced trabecular bone volume, decreased cortical bone, and increased osteoclast number in bone explants in adiponectin knock-out mice. We then found that adiponectin inhibits RANKL-induced osteoclastogenesis from RAW264.7 cells and down-regulates RANKL-enhanced expressions of osteoclastogenic regulators including NFAT2, TRAF6, cathepsin K, and tartrate-resistant acid phosphatase. Adiponectin also increases osteoclast apoptosis and decreases survival/proliferation of osteoclast precursor cells. Using siRNA specifically targeting APPL1, the first identified adaptor protein of adiponectin signaling, we found that the inhibitory effect of adiponectin on osteoclasts was induced by APPL1-mediated down-regulation of Akt1 activity. In addition, overexpression of Akt1 successfully reversed adiponectin-induced inhibition in RANKL-stimulated osteoclast differentiation. In conclusion, adiponectin is important in maintaining the balance of energy metabolism, inflammatory responses, and bone formation.
Keywords: Akt PKB, Bone, Gene Knock-out, NFAT Transcription Factor, Osteoclast Acidification, APPL1, Akt1, Adiponectin, Bone Remodeling, Osteoclast
Introduction
Adipose tissue is not just an inert organ for energy storage. It also secretes proinflammatory cytokines and synthesizes a wide range of biologically active molecules known as adipokines (1, 2). Adiponectin, a 30-kDa protein containing a collagen-repeat domain at the N terminus and a globular domain at the C terminus, is among these adipokines (3). It has been reported that adiponectin plays an important role in regulating energy homeostasis and insulin sensitivity, and plasma adiponectin levels correlate positively with insulin sensitivity (4, 5). APPL1 (adaptor protein containing pleckstrin homology domain, phosphotyrosine domain, and leucine zipper motif), is the first identified protein interacting with adiponectin receptors and is suggested to be an adaptor protein responsible for the mediation of adiponectin signal transduction (6). Knockdown of APPL1 expression resulted in a significant reduction in insulin-stimulated Akt phosphorylation (6). In addition to its insulin-sensitizing effect, adiponectin has also been reported to have potent anti-inflammatory properties by suppressing the expressions of inflammatory cytokines while inducing production of anti-inflammatory cytokines (7–9). However, unlike other adipose tissue-derived molecules, adiponectin mRNA and plasma protein levels were shown to decrease in obesity and type 2 diabetes mellitus (T2DM)2 patients (10, 11). In 3T3-L1 adipocyte, TNF-α was shown to suppress the transcription of the adiponectin gene, which might explain the lower adiponectin mRNA levels in obesity associated adipose tissue, where TNF-α production was increased (12).
Ample clinical research studies have demonstrated the association between adiponectin and bone metabolism in various patient populations; however, with conflicting results. Several studies reported a significant inverse relationship between serum adiponectin level and bone mineral density (BMD) (13, 14), whereas other studies showed that serum adiponectin level was positively correlated with BMD (15) and other studies failed to find any associations between adiponectin level and BMD (16, 17). Although most researchers found that adiponectin stimulates osteoblast proliferation and differentiation (18, 19), the contradictory results remain inconclusive for the effect of adiponectin on osteoclast activity. For example, some researchers found that adiponectin not only inhibits macrophage colony-stimulating factor- and RANKL-induced osteoclast differentiation but also suppresses bone-resorption activity of osteoclasts (20–22). In contrast, Luo et al. (18) showed that adiponectin indirectly promotes osteoclastogenesis via enhancing RANKL expression and suppresses osteoprotegerin expression in human osteoblasts but has no direct effect on the differentiation of human osteoclast precursor cells. Results derived from in vivo animal studies investigating the role of adiponectin in bone metabolism also showed similar discrepancies. Oshima et al. (20) reported that in vivo adiponectin-adenovirus treatment increased bone mass. On the other hand, Shinoda et al. (23) failed to find any bone phenotypes in either adiponectin null mice or transgenic mice overexpressing globular adiponectin in liver. Similarly, William et al. (24) reported that no obvious bone phenotypes could be observed in adiponectin null mice except a slight increase in bone mass in aged adiponectin null mice (24).
To date, two major confounding factors, including mechanical loading effect of total body weight or fat mass (25–27) and long term adaptation and compensation (28–30), have been suggested to contribute to the complexity of the direct in vivo role of adiponectin in bone metabolism.
As mentioned previously, although most in vitro studies have shown that adiponectin stimulates osteoblast proliferation and differentiation while inhibiting osteoclastogenesis, a majority of clinical association studies have reported an inverse relationship between serum adiponectin and bone mineral density (13, 14). Previously, it was believed that higher body weight or fat mass is correlated with higher BMD, and decreased body weight leads to bone loss (31). Considering the fact that the serum adiponectin levels are down-regulated by excessive TNF-α produced by increased fat mass (12), it is reasonable that clinical association studies found a negative association between serum adiponectin and BMD. Nevertheless, accumulating evidence has emerged showing that excessive fat mass is negatively correlated with BMD as long as the mechanical loading effect of fat mass is statistically removed (25–27). This conclusion is also applicable for association studies investigating the relationship between serum adiponectin and BMD. Indeed, in a recently published study, the researchers reported that the total serum adiponectin level was significantly and positively associated with BMD in patients with T2DM after adjustment for body weight and waist circumference (15).
In addition to weight-associated gravitational forces, other potential explanations for the complex relationship between adiponectin level and bone mass have been suggested. Besides adiponectin, adipose tissues secrete various biologically active molecules, such as estrogen, resistin, leptin, and some proinflammatory cytokines (32). Some organs, such as the pancreas, secrete bone active hormones (including insulin, amylin, and preptin), which also play an important role in regulating energy balance (33, 34). These molecules not only affect energy homeostasis but are also involved in bone metabolism and, thus, contribute to the complex cross-talk between fat mass and bone (28–30). Therefore, the lack of obvious bone phenotypes observed in several adiponectin knock-out mouse lines and adiponectin overexpressing transgenic mouse lines (23, 24, 35) may be the result of physiological adaptation and pathological compensation from alternative regulatory pathways.
Taken together, although initial studies have been performed to investigate the possible role of adiponectin in bone metabolism and osteoclastogenesis, there are still some major unanswered questions. In this study we performed bone explantation in adiponectin knock-out mice to evaluate the direct effects of adiponectin deficiency on bone remodeling in vivo. With this approach we can exclude the effects of long term adaptation and compensation and eliminate any possible effects of mechanical loading on bone metabolism. We also performed in vitro studies to investigate the roles of adiponectin in osteoclastogenesis and the underlying molecular mechanisms.
EXPERIMENTAL PROCEDURES
Bone Explantation
Intramuscular bone explantation was performed as described previously with minor modifications (36). Briefly, bone donors were 3-day-old mBSP9.0Luc/β-ACT-EGFP transgenic mice double-labeled with EGFP driven by β-actin promoter and luciferase driven by bone sialoprotein (BSP) promoter (37). After euthanasia, femurs from both sides of the donor mice were isolated and explanted into the back muscles of 8–10-week-old wild type or adiponectin knock-out mice (stock no. 008195, The Jackson Laboratory, Bar Harbor, ME). Both the mBSP9.0Luc/β-ACT-EGFP transgenic mice and the adiponectin knock-out mice have been backcrossed to C57BL/6J for at least eight generations before the bone explantation study; therefore, the donor mice and the recipient mice were both in the C57BL/6J genetic background. Femurs were explanted from the donor mouse. One femur was transplanted into an adiponectin knock-out mouse and the other into a wild type (WT) mouse; the mice were littermates generated by crossing a pair of heterozygous adiponectin+− mice. At weeks 2 and 4 postoperatively, luciferase and EGFP expressions were measured using an IVIS Imaging System 200 Series in the live animals (Xenogen Corp., Alameda, CA) as described previously (37, 38). Four weeks after explantation, the bone explants were harvested to measure bone length and ash/dry weight (39). X-ray (radiography) was performed using a radiographic inspection unit (Faxitron X-ray Corp., Wheeling, IL). High resolution microcomputed tomography (CT40; Scanco Medical, Basserdorf, Switzerland) was used to scan and evaluate bone volume fraction and BMD in the femurs as previously described (40). The three-dimensional structure was constructed by three-dimensional morphometric analysis with built-in microcomputed tomography system software. Histological analysis and tartrate-resistant acid phosphatase (TRACP) staining (using a leukocyte acid phosphatase staining kit with a tartrate concentration of 6.7 mm (38)) were also performed to evaluate the bone remodeling processes in these bone explants. The photos were taken and analyzed using a Nikon Eclipse E600 microscope and Spot Advanced software (Diagnostic Instruments, Inc., Sterling Heights, MI) as described previously (38). Mice were maintained and used in accordance with recommendations in the Guide for the Care and Use of Laboratory Animals prepared by the Institute on Laboratory Animal Resources, National Research Council (Department of Health and Human Services Publication NIH 86-23, 1985) and by guidelines established by the Institutional Animal Care and Use Committee of the Tufts-New England Medical Center (Boston, MA).
Plasmids and Purification of Recombinant Adiponectin Protein
pEt15b bacterial expression vector encoding the C-terminal part of human adiponectin (amino acids 106–244) was used to purify globular adiponectin as a His-tagged protein in BL21(DE3) bacterial cells as described previously (6). APPL1 cDNAs encoding full-length human APPL1were subcloned into the mammalian expression vector pcDNA3.1-Myc-His(+) (Invitrogen). The sequences of siRNAs for APPL1 and scrambled control were synthesized and ligated into pSIREN-DNR (Takara Bio, Clontech, Palo Alto, CA) as reported previously (6). To generate APPL1 siRNA stable cell lines, RAW264.7 cells were transfected with the APPL1 siRNA construct or scrambled control and selected with puromycin. All the above-mentioned constructs were created in the laboratory of Dr. Lily Q. Dong (University of Texas Health Sciences Center at San Antonio, TX). The pGL3-CtpsK-luciferase reporter vector was constructed in a pGL3-Basic Vector (Promega, Madison, WI), which contained a 4.0-kb mouse cathepsin K promoter (a gift from Dr. Yiping Li at Forsyth Institute, Boston, MA). The full-length osterix (Osx) promoter construct (−2020/+13) was a generous gift from Dr. Hicham Drissi at University of Connecticut Health Center, Farmington, CT. Cloning of the BSP promoter and construction of reporter vector were described previously (41). Plasmids encoding Akt1 or Akt2 were purchased from Addgene (Addgene plasmid IDs 16244 and 9016, Addgene Inc. Cambridge, MA).
Cell Culture Conditions and Luciferase Assays
RAW264.7 (ATCC, Manassas, VA) cells were routinely cultured in a 5% CO2 atmosphere at 37 °C in RPMI 1640 (Invitrogen) supplemented with 10% (v/v) FBS (Invitrogen). Given that the presence of growth factors in the serum may interfere with some of the effects of RANKL and/or adiponectin, cells were serum-starved overnight and treated with RANKL and/or adiponectin in RPMI 1640 supplemented with 1% (v/v) FBS.
Transfection of plasmids was performed in RAW264.7 cells using LipofectamineTM 2000 (Invitrogen) following the manufacturer's recommendations. Luciferase assays were performed using a luminometer (Lumat LB9501, EG&G Berthold, Bad Wildbach, Germany) as described previously (42).
In Vitro Osteoclastogenesis and TRACP Staining
RAW264.7 cells were treated with 50 ng/ml RANKL with or without 1 μg/ml globular adiponectin for 5 days. TRACP staining was then performed with the K-ASSAY TRACP staining kit (Kamiya Biomedical Co., Seattle, WA), as previously described (39, 43). The differentiated osteoclasts were identified as red-stained cells with three or more nuclei.
Real-time RT-PCR for mRNA Analysis
Total RNA was isolated using a RNeasy Mini Kit (Qiagen, Valencia, CA), and the first strand of cDNA was generated using SuperScript III reverse transcriptase (Invitrogen) and oligo(dT)20 primer (Invitrogen). A quantitative real-time reverse transcription-PCR assay was performed using iQTM SYBR Green Supermix (Bio-Rad) on a Bio-Rad iQ5 thermal cycler. The evaluation of relative differences in the PCR product amounts was carried out by the comparative cycle threshold method using GAPDH as a control.
Western Blot
Whole protein lysates were prepared as described previously (43). Nuclear extracts were purified using a nuclear extraction Kit (Millipore, Billerica, MA). SDS-PAGE and Western blot analyses were then performed using NuPAGE 4–12% Bis-Tris gradient gels and 0.45-μm Invitrolon polyvinylidene fluoride membranes (Invitrogen). Antibodies for p-Akt (1:400), p-Akt1 (1:400), NFAT2 (1:400), Lamin B1 (1:400), and β-actin (1:400) were obtained from Santa Cruz Biotechnologies, Santa Cruz, CA. Antibodies for Akt (1:1000), Akt1 (1:1000), Akt2 (1:1000), and APPL1 (1:1000) were purchased from Cell Signaling Technology. The secondary antibodies were horseradish peroxidase-linked goat-anti-rabbit IgG (Santa Cruz Biotechnologies). Blots were visualized using ECL chemiluminescence reagents from Pierce.
Fluorescence Peptide Substrate-based Assay for Akt/Protein Kinase B (PKB) Activity
RAW264.7 cells with a normal APPL1 level were treated with RANKL (50 ng/ml) and/or adiponectin (1 μg/ml) for 3 days. RAW264.7 cells overexpressing APPL1 were treated with RANKL (50 ng/ml) alone for 3 days. Whole protein lysates were prepared and subjected to a fluorescence peptide substrate-based assay to determine Akt activity by following the protocol enclosed with the Omnia® lysate assay kit (Invitrogen). This kit uses chelation-enhanced fluorophore 8-hydroxy-5-(N,N-dimethylsulfonamido)-2-methylquinoline (referred to as Sox), which is incorporated into the substrate peptide. Upon phosphorylation of the substrate peptide by Akt/PKB, Mg2+ is chelated to form a bridge between the Sox moiety and the phosphate group that is added by Akt/PKB to the serine residue within the peptide, resulting in an increase in fluorescence when the kinase reaction mixture is excited at 360 nm and the emission is measured at 485 nm.
RESULTS
Adiponectin Deficiency Results in Retarded Growth in Bone Explants
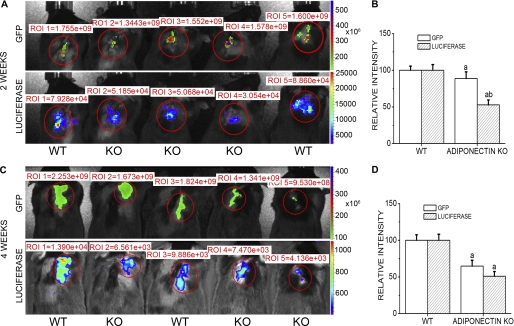
IVIS Imaging demonstrated that both luciferase and EGFP expressions could be detected in the explantation regions of the live mice 2 weeks after surgery (Fig. 1, A and B). EGFP signals in the bone explants were slightly higher in WT mice than in adiponectin knock-out mice, whereas luciferase activity of bone explants was much stronger in WT mice than in adiponectin null mice. Four weeks after explantation, the intensities of EGFP signals and luciferase activity in the bone explants both decreased in WT and adiponectin knock-out mice, with their signals continuing to be weaker in adiponectin knock-out mice than in WT mice (Fig. 1, C and D).
FIGURE 1.
IVIS Imaging of GFP and luciferase signals in murine bone explants model. Kinetic expressions of luciferase and GFP in live animals with double-labeled bone explants were detected at 2 and 4 weeks after explantation. A, GFP and luciferase signal imaging in living animals at 2 weeks post-explantation are shown. B, quantitative analysis of GFP and luciferase signals is shown. C and D, imaging and quantification of GFP and luciferase signals at 4 weeks after explantation are shown. WT, wild type host mice; KO, adiponectin knock out hosts. Results are presented as the mean ± S.E. a, p < 0.05 versus WT; b, p < 0.01 versus WT. ROI, region of interest.
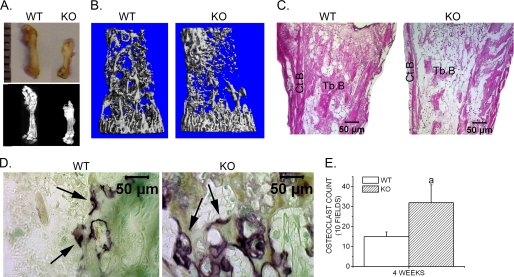
Four weeks after bone explantation, the bone explants were isolated and subjected to further analyses. We found that bone explants in both mice groups remained viable and increased in size (Fig. 2A). However, the bone explants in adiponectin knock-out mice demonstrated a slower growth rate than in the WT mice (Table 1). X-ray, histological analysis, and microcomputed tomography showed that bone explants in adiponectin knock-out mice displayed reduced trabecular bone volume and decreased cortical bone (Fig. 2, A–C, and Table 2). TRACP staining further indicated that more TRACP+ osteoclasts were observed in the trabecular area of the femoral explants isolated from adiponectin knock-out mice when compared with those from WT mice (Fig. 2, D and E).
FIGURE 2.
Retarded growth of bone explants in adiponectin knock-out mice. A, gross appearance (upper) and radiological analysis (lower) of femoral explants isolated from WT and adiponectin KO mice 4 weeks after explantation is shown. B, three-dimensional microcomputed tomography images are shown. C, hematoxylin and eosin staining sections showing femoral explants 4 weeks after explantation are shown. Tb.B., trabecular bone; Ct.B., cortical bone. D, TRACP staining of bone explants 4 weeks after explantation is shown. Arrows, TRACP+ osteoclasts. Photographs were taken at ×200 magnification using a Nikon Eclipse E600 microscope and Spot Advanced software (Diagnostic Instruments). E, the number of TRACP-positive multinucleated cells were counted, and data are presented as the mean ± S.E. a, p < 0.05 versus WT.
TABLE 1.
Bone length and bone ash weight of femurs explanted into WT or Adipo−/− mice for 4 weeks
Values are the means ± S.E. from at least five samples from each group.
| Variable | Explants in WT | Explants in Adipo−/− |
|---|---|---|
| Femur length, mm | 8.2 ± 0.2 | 6.2 ± 0.1a |
| Bone ash (% dry weight) | 46.8 ± 0.2 | 31.4 ± 0.1a |
a p < 0.05, femurs explanted into adiponectin knock-out (Adipo−/−) mice vs. femurs explanted into WT.
TABLE 2.
Microcomputed tomography analysis of femurs explanted into WT or Adipo−/− mice for 4 weeks
A microcomputed tomography scan was performed to assess BMD and three-dimensional cortical and trabecular bone architecture of femurs explanted into WT or adiponectin knock-out (Adipo−/−) mice for 4 weeks. The bone volume density (BV/TV), trabecular thickness (Tb.Th), trabecular number (Th.N), trabecular separation (Tb.Sp), and cortical thickness (Ct.Th) were measured. Data are represented as the mean ± S.E. from five individual mice.
| Genotype | Explants in WT | Explants in Adipo−/− |
|---|---|---|
| BMD (mg HA/ccm) | 112.80 ± 8.552 | 77.65 ± 2.3241a |
| BV/TV (%) | 11.23 ± 0.356 | 7.49 ± 0.456a |
| Tb.Th (mm) | 0.0241 ± 0.0001 | 0.0206 ± 0.0001a |
| Tb.N (mm−1) | 7.46 ± 0.04 | 4.19 ± 0.10a |
| Tb.Sp (mm) | 0.13705 ± 0.001 | 0.29635 ± 0.03a |
| Ct.Th (mm) | 0.036 ± 0.00001 | 0.029 ± 0.00001a |
a p < 0.05, femurs explanted into Adipo−/− mice vs. femurs explanted into WT mice.
Adiponectin Inhibits RANKL-induced Osteoclast Formation from RAW264.7 Cells
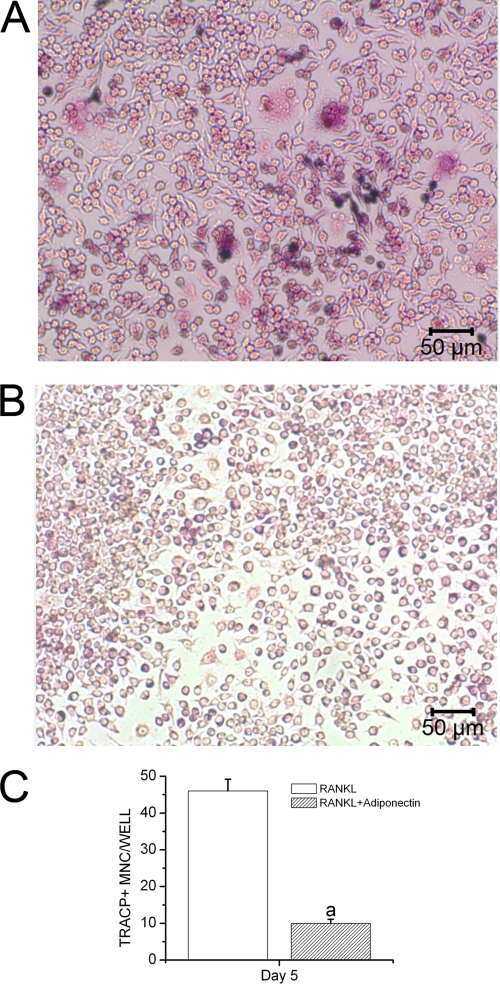
In vitro osteoclastogenesis was performed to investigate whether adiponectin could inhibit osteoclastogenesis from RAW264.7 cells stimulated by RANKL. Our results showed that the cells efficiently differentiated into TRACP-positive multinucleated cells (MNCs) in the presence of RANKL stimulation, whereas globular adiponectin strongly inhibited RANKL-stimulated formation of TRACP-positive MNCs (Fig. 3, A and B). We also counted the number of MNC TRACP+ cells presented in these RAW264.7 cell cultures. We found that the number of MNC TRACP+ cells treated with RANKL and adiponectin was lower than that of cells treated with RANKL alone (Fig. 3C).
FIGURE 3.
Inhibitory effect of adiponectin on RANKL-induced osteoclast formation. RAW264.7 cells were treated with 50 ng/ml RANKL with or without 1 μg/ml globular adiponectin for 5 days. The numbers of MNC TRACP-positive cells were monitored in three independent experiments. A, RAW264.7 cells were treated with RANKL alone. B, RAW264.7 cells were treated with RANKL and adiponectin. C, the number of TRACP-positive multinucleated cells was counted, and data are presented as the mean ± S.E. a, p < 0.05 versus RANKL-treated cells.
Adiponectin Inhibits RANKL-induced Activation of Osteoclastogenic Regulators
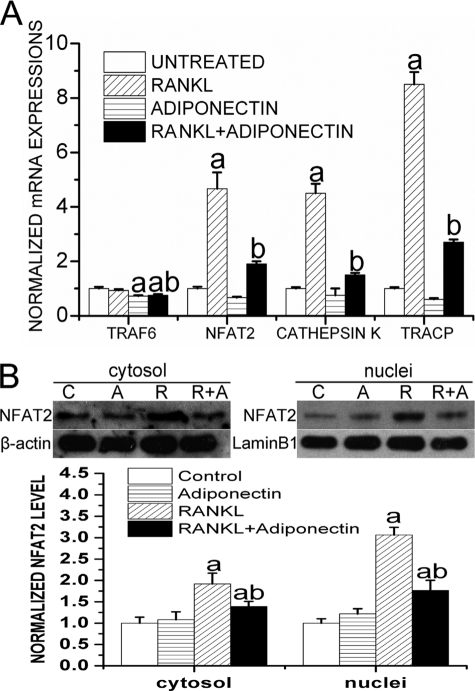
Calcineurin-dependent activation of NFAT2 is sufficient to induce osteoclast differentiation and is the master regulator of osteoclastogenesis (44). Upon the activation of calcineurin by extracellular stimuli and after Ca2+-mediated signaling, NFAT2 forms a complex with calcineurin and is then dephosphorylated and translocated into the nuclei as an active form (45). TNF receptor-associated factor 6 (TRAF6) also plays an essential role in RANKL-induced activation of NF-κB in osteoclasts. We, thus, monitored mRNA levels of NFAT2 and TRAF6 as well as mRNA levels of another two osteoclastic differentiation markers, TRACP and cathepsin K, in RAW264.7 cells after being treated with adiponectin (1 μg/ml) and/or RANKL (50 ng/ml) for 72 h. Our results showed that RANKL treatment significantly enhanced the expression levels of NFAT-2 (NFATc1), cathepsin K, and TRACP. However, adiponectin treatment dramatically inhibited the induction of these osteoclastogenic regulators by RANKL and the mRNA level of TRAF6 (Fig. 4A). To determine the cytosolic protein level and nuclear translocation of NFAT2, both cytosolic and nuclear extracts were prepared from RAW264.7 cells treated with adiponectin (1 μg/ml) and/or RANKL (50 ng/ml) for 72 h. Western blot analysis showed that adiponectin treatment caused an inhibition in the RANKL-triggered up-regulation and nuclear translocation of NFAT2 (Fig. 4B). These results clearly indicated that the negative effects of adiponectin on RANKL-induced osteoclast differentiation and activity are mediated by the inhibition of TRAF6 and NFAT2.
FIGURE 4.
Adiponectin inhibits RANKL-induced expression and activation of osteoclast regulators and marker genes. Cells were cultured in the presence of 50 ng/ml RANKL with or without 1 μg/ml globular adiponectin for 72 h, and the untreated cells served as a control. A, real time RT-PCR analyses were performed to monitor changes in mRNA expression for NFAT-2, cathepsin K, TRACP, and TRAF6. GAPDH amplification was performed for normalization of mRNA quantity. a, p < 0.05, versus the untreated group; b, p < 0.05, versus the RANKL-treated group. B, both nuclear and cytosolic extracts were prepared and probed with an anti-NFAT2 antibody. Lamin B1 or β-actin was detected as a loading control. Results are presented as the mean ± S.E. a, p < 0.05 versus untreated cells; b, p < 0.05 versus RANKL-treated cells.
Adiponectin Strongly Inhibits Cathepsin K Promoter Activity in a Dose- and Time-dependent Manner in RAW264.7 Cells, Which Were Mediated by APPL1
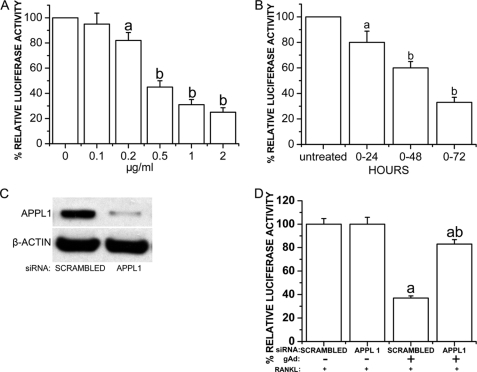
RAW264.7 cells were stably transfected with pGL3-CtpsK-luciferase and treated with globular adiponectin (0–2.0 μg/ml) with the presence of RANKL (50 ng/ml) for 72 h. RAW264.7 cells stably transfected with pGL3-CtpsK-luciferase were also treated with 1 μg/ml globular adiponectin and 50 ng/ml RANKL for 0, 24, 48, and 72 h. We found that adiponectin strongly inhibited cathepsin K promoter activity in a dose- and time-dependent manner (Fig. 5, A and B).
FIGURE 5.
Adiponectin inhibition of cathepsin K promoter activity mediated by APPL1. RAW264.7 cells were stably transfected with pGL3-CtpsK-luciferase construct in which osteoclast-specific expression of luciferase was driven by cathepsin K promoter and treated with globular adiponectin (0–2.0 μg/ml) in the presence of RANKL (50 ng/ml) for 72 h. Luciferase assays were performed using Lumat LB 9501 (EG&G Berthold). A and B, adiponectin strongly inhibits cathepsin K promoter activity in a dose- and time-dependent manner. a, p < 0.05, versus untreated cells; b, p < 0.01, versus untreated cells. C, APPL1 siRNA is shown. The sense and antisense sequences of RNAi were chemically synthesized and ligated into the pSIREN-DNR vector (BD Biosciences BDTM Knock-out RNAi system). For generation of the APPL1 siRNA stable cell lines, RAW264.7 cells were transfected with the APPL1 RNAi construct or the scrambled control and selected with 5 μg/ml puromycin. The effect of RNAi on APPL1 expression was tested by Western blot (top panel). Equal loading of protein in cell lysates was determined by Western blot using an anti- β-Actin antibody (bottom panel). D, the effects of APPL1 siRNA on adiponectin-induced inhibition of cathepsin K expression are shown. RAW264.7 cells stably expressing pGL3-CtpsK-luciferase were transfected with a siRNA construct specifically targeting APPL1 and treated with RANKL (50 ng/ml) and/or globular adiponectin (1.0 μg/ml) for 72 h. Cells transfected with scrambled siRNA served as controls. a, p < 0.05 adiponectin treated cells versus corresponding untreated cells; b, p < 0.05 APPL1 siRNA versus scrambled control in adiponectin-treated cells.
APPL1 was reported to be a key adaptor protein mediating adiponectin signaling and coordinating different signaling pathways (6). To investigate whether the inhibitory effect of adiponectin on cathepsin K promoter is mediated by APPL1, RAW264.7 cells stably expressing pGL3-CtpsK-luciferase were transfected with siRNA construct specifically targeting APPL1 and treated with globular adiponectin (1.0 μg/ml) and RANKL (50 ng/ml) for 72 h. Cells transfected with scrambled siRNA served as a control. As shown in Fig. 5C, transfection with active siRNA led to an 89% reduction in APPL1 protein levels compared with scrambled siRNA controls. Luciferase assays showed that the inhibitory effect of adiponectin on cathepsin K was antagonized by the siRNA specifically targeting APPL1 (Fig. 5D). These results indicated that the inhibitory effects of adiponectin on osteoclast differentiation and activity are mediated by APPL1.
Adiponectin Decreases Osteoclast Survival/Proliferation, Up-regulates DNA Condensation, and Increases Caspase-dependent Apoptosis in RAW264.7 Cells
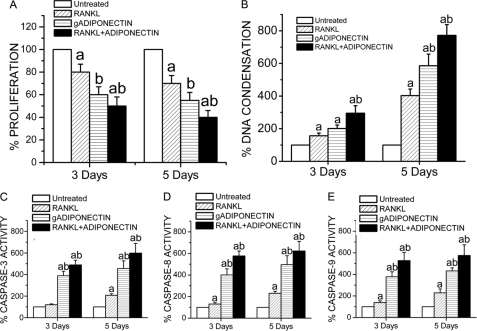
RAW264.7 cells were treated with RANKL (50 ng/ml) and/or globular adiponectin (1 μg/ml) for 3 and 5 days. Osteoclast survival/proliferation was monitored using an MTT assay (Invitrogen), and we found that survival/proliferation of RAW264.7 cells was decreased by globular adiponectin treatment. Cells treated with both globular adiponectin and RANKL exhibited even lower MTT readings (Fig. 6A).
FIGURE 6.
Adiponectin effects in the survival/proliferation and apoptosis of RAW264.7. The cells were cultured on 96-well plates treated with RANKL (50 ng/ml) and/or globular adiponectin (gADIPONECTIN, 1 μg/ml) for 3 and 5 days. A, adiponectin mediates inhibitory effects in osteoclasts, as determined by the MTT assay. MTT results of three different experiments are presented as the mean ± S.E. a, p < 0.05 versus untreated cells; b, p < 0.05 versus cells treated with RANKL alone. B, globular adiponectin and RANKL-mediated up-regulation in DNA condensation in RAW264.7 cells is shown. Cells were differentiated as in A, and their DNA condensation was measured at 5, 7, and 9 days as described previously (43). Results are presented as the mean ± S.E. a, p < 0.05 versus untreated cells; b, p < 0.05 versus cells treated with RANKL alone. C, D, and E, adiponectin increases caspase activities in RAW264.7 cells. RAW264.7 cells were treated with RANKL (50 ng/ml) and/or globular adiponectin (1 μg/ml) for 3 and 5 days. The activity levels of executioner caspase-3 and initiator caspases-8 and -9 were determined using a Caspase-Glo® assay (Promega). Results are presented as the mean ± S.E. a, p < 0.05 versus untreated cells; b, p < 0.05 versus RANKL-treated cells.
The effects of adiponectin on DNA condensation were also determined using a single-stranded DNA apoptosis ELISA kit (Chemicon International; Temecula, CA), which is the most specific and definite hallmark of caspase-dependent and -independent apoptosis. Cells used for this study were RAW264.7 cells treated with RANKL (50 ng/ml) and/or globular adiponectin (1 μg/ml) for 3 and 5 days. We found that DNA condensation was up-regulated by either RANKL or globular adiponectin treatment. However, the most prominent increase in DNA condensation was observed in cells treated with both RANKL and globular adiponectin (Fig. 6B).
To indirectly evaluate which type of apoptosis adiponectin could be enhancing (i.e. caspase-8-dependent death receptor pathway or caspase-9-dependent stress pathway), RAW264.7 cells were treated with RANKL (50 ng/ml) and/or globular adiponectin (1 μg/ml) for 3 and 5 days. The activity levels of executioner caspase-3 and initiator caspases-8 and -9 were determined using Caspase-Glo® Assay (Promega). Our results showed that the activity levels of the three caspases were all higher in adiponectin-treated RAW264.7 cell cultures than in those treated with RANKL alone. The increased activity levels of caspases-3, -8, and -9 in RAW264.7 cells treated with both RANKL and adiponectin were shown to be even more prominent (Fig. 6, C–E).
Adiponectin Shows Discrepant Effects on Different Akt Isoforms, Which Is Also Mediated by APPL1
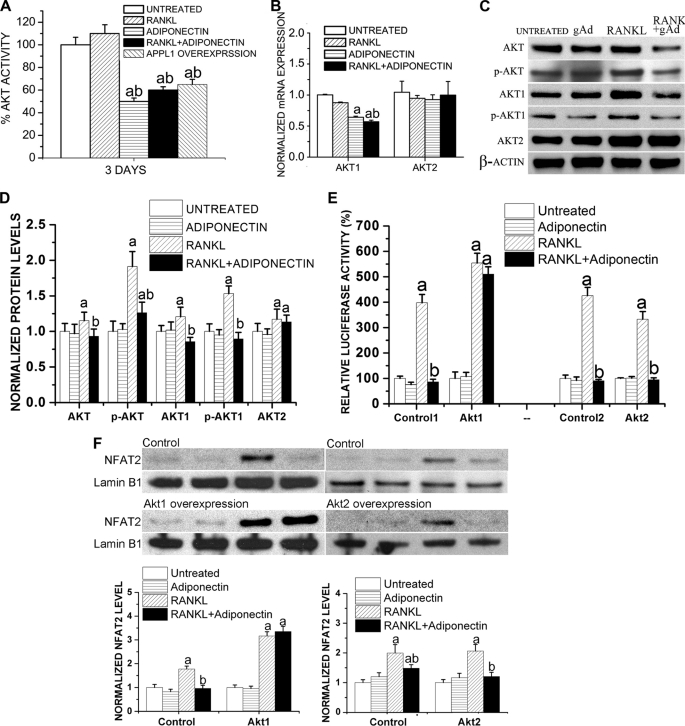
Akt activity has been reported to be associated with osteoclast survival (46) and differentiation (47). To investigate whether the effect of adiponectin on osteoclast apoptosis is mediated by Akt activity, RAW264.7 cells overexpressing APPL1 were treated with RANKL (50 ng/ml) for 3 days. In addition, RAW264.7 cells with a normal APPL1 level were treated with RANKL (50 ng/ml) and/or adiponectin (1 μg/ml) for 3 days. Whole protein lysates were prepared and subjected to a fluorescence peptide substrate-based assay (Invitrogen) to determine Akt activity. We found that in RAW264.7 cells treated with adiponectin with or without RANKL, Akt activity was significantly decreased. APPL1 overexpression also decreased Akt activity to a similar level as that observed in the adiponectin-treated cells (Fig. 7A). These results suggest that adiponectin suppresses osteoclastogenesis via APPL1-mediated inhibition of Akt activity.
FIGURE 7.
Adiponectin inhibits Akt activation in RAW264.7 cells. A, RAW264.7 cells with a normal APPL1 level were treated with RANKL (50 ng/ml) and/or adiponectin (1 μg/ml) for 3 days. RAW264.7 cells overexpressing APPL1 were treated with RANKL (50 ng/ml) alone for 3 days. Whole protein lysates were prepared and subjected to fluorescence peptide substrate-based assay to determine Akt activity (Omnia® lysate assay kit). a, p < 0.05 versus untreated cells; b, p < 0.05 versus RANKL-treated cells. B, adiponectin exhibits discrepant effects on different Akt isoforms. RAW264.7 cells were treated with globular adiponectin (gAd, 1 μg/ml) and/or RANKL (50 ng/ml) for 72 h, and quantitative RT-PCR was performed to determine the changes in expression levels of different Akt isoforms. Results are presented as the mean ± S.E. a, p < 0.05 versus untreated cells; b, p < 0.05 versus RANKL-treated cells. C and D, effects of adiponectin on Akt phosphorylation are shown. Whole protein lysates were subjected to Western blotting to determine phosphorylation and the total levels of Akt, Akt1, and Akt2, and the detection of β-actin was used to normalize the band intensities. Normalized levels of Akt are shown in D. a, p < 0.05 versus untreated cells; b, p < 0.05 versus RANKL-treated cells. E and F, RAW264.7 cells were transfected with plasmids encoding Akt1 or Akt2 and were treated with RANKL (50 ng/ml) and/or adiponectin (0.5 μg/ml) for 3 days. pGL3-CtpsK-luciferase was co-transfected. E, luciferase assays showed that Akt1 reversed adiponectin-induced inhibition in RANKL-enhanced luciferase level, whereas Akt2 failed to show such an effect. Results are presented as the mean ± S.E. a, p < 0.05 versus untreated cells; b, p < 0.05 versus RANKL-treated cells. F, a Western blot shows the nuclear translocation of NFAT2 after Akt1 or Akt2 transfection. Results are presented as the mean ± S.E. a, p < 0.05 versus untreated cells; b, p < 0.05 versus RANKL-treated cells.
However, different studies have previously demonstrated conflicting results in regard to whether or not adiponectin affects Akt pathway (6, 48). To investigate whether these discrepant effects of adiponectin on Akt activity resulted from different Akt isoforms, RAW264.7 cells were treated with globular adiponectin (0.5 μg/ml) and/or RANKL (50 ng/ml) for 72 h, and quantitative RT-PCR was performed to determine the changes in the expression levels of different Akt isoforms. As shown in Fig. 7B, adiponectin significantly decreased the Akt1 mRNA level while having no effects on the Akt2 expression (Fig. 7B). In addition, we performed Western blot analyses to determine phosphorylation and total levels of Akt, Akt1, and Akt2. We found that adiponectin treatment significantly decreased RANKL-enhanced total and phosphorylated levels of Akt1 while having no obvious inhibitory effect on the total Akt2 level (Fig. 7, C and D).
We then transfected RAW264.7 cells with plasmids encoding constitutively active Akt1 or Akt2 and treated these cells with RANKL (50 ng/ml) and/or adiponectin (0.5 μg/ml) for 3 days. pGL3-CtpsK-luciferase was co-transfected to evaluate the changes in cathepsin K promoter activity in these cells. We found that Akt1 overexpression reversed adiponectin-induced inhibition in RANKL-enhanced luciferase activity driven by cathepsin K promoter, whereas Akt2 overexpression failed to show such rescuing results (Fig. 7E). We also performed a Western blot to evaluate the nuclear translocation of NFAT2 in these cells. Consistent with the luciferase assay results, we found that Akt1 overexpression, not Akt2 overexpression, potently reversed adiponectin-inhibited nuclear translocation of NFAT2 during RANKL-induced osteoclast differentiation (Fig. 7F).
Adiponectin Strongly Enhances Osterix and BSP Promoter Activity in MC3T3-E1 Osteoblasts
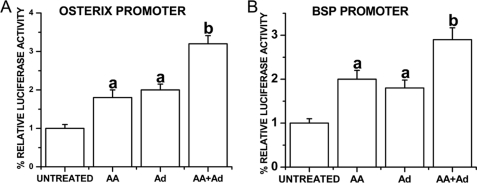
To test whether adiponectin regulates transcriptional activities of Osx and BSP promoters, full-length Osx promoter (−2020/+13) or full-length BSP promoter (−9256/+30) construct, installed in pGL3-basic vector, was stably transfected into MC3T3-E1 cells. The cells were then treated with 1 μg/ml globular adiponectin and/or 50 μg/ml ascorbic acid for 7 days. Luciferase assay indicated that adiponectin alone up-regulated the transcription activities of Osx and BSP promoters to similar levels as those stimulated by ascorbic acid when compared with the untreated cells. Cells treated with both ascorbic acid and adiponectin demonstrated a more prominent increase in luciferase levels (Fig. 8).
FIGURE 8.
Adiponectin strongly enhances osterix and BSP promoter activity in MC3T3-E1 osteoblasts. Full-length Osx promoter (−2020/+13) or full-length BSP promoter (−9256/+30) construct, installed in pGL3-basic vector, was stably transfected into MC3T3-E1 cells. The cells were then treated with 1 μg/ml globular adiponectin and/or 50 μg/ml ascorbic acid for 7 days. Luciferase assay indicated that adiponectin alone up-regulated the transcription activities of Osx (A) and BSP (B) promoters to similar levels as those stimulated by ascorbic acid when compared with the untreated cells. a, p < 0.05, versus untreated group; b, p < 0.01, versus untreated group. Ad, adiponectin; AA, ascorbic acid.
DISCUSSION
Adiponectin is the most abundant adipokine derived from adipose tissue that displays insulin-sensitizing effects, and a reduced level of adiponectin closely relates to the pathophysiology of insulin resistance and T2DM (49). As mentioned previously, adiponectin was also found to be associated with bone metabolism; however, the previous studies have had inconsistent results as indicated by different studies, including clinical association, animal, and in vitro studies. To find out the real, direct role of adiponectin in bone metabolism, we established a bone explantation model to exclude the effects of long term adaptation and compensation. In addition, the effect of mechanical loading on bone explant growth was eliminated given that the bone explantation was performed in the back muscles of recipient mice. In this way the two major confounding factors were both strictly controlled.
Although no obvious bone phenotypes have been reported in adiponectin knock-out mice, we found that the short term exposure to an adiponectin-deficient environment has a negative effect on bone mineral density, which was indicated by retarded bone growth, decreased trabecular bone, impaired cortical bone structure, and more active bone resorption activity due to an increased number of osteoclasts in the bone explants embedded in adiponectin null mice. In the adiponectin knock-out mice, adiponectin is completely removed from the very beginning of, and throughout the life process. Therefore, a better balance could be established in these animals between bone formation and bone resorption via physiological adaptation and pathological compensation so that these adiponectin knock-out mice may not display any obvious bone phenotypes. In contrast, the short term exposure of bone explants in an adiponectin-deficient environment, which breaks the original balance of bone remodeling, displays noticeable effects on bone metabolism.
Our results, derived from a loss-of-function animal model, were consistent with a previous study using a gain-of-function animal model in which adiponectin was temporarily overexpressed via an adiponectin-adenovirus treatment; the researchers observed that trabecular bone mass increased, number of osteoclasts was reduced, and levels of plasma NTx, a bone-resorption marker, decreased (20). In addition, the use of a spontaneously diabetic animal model, WBN/Kob rats, also showed that low serum adiponectin levels resulted from hyperglycemia and obesity are partly associated with low bone mineral density, which is considered to be the cause of diabetes-related bone fragility (15, 50). All of these findings indicated that short term physiological or pathological changes in the serum adiponectin level have a significant impact on bone metabolism. In addition, the direct effect of adiponectin is to promote bone formation while inhibit bone resorption.
In fact, the adiponectin level of human beings keeps fluctuating with changes in other physiological or pathological factors such as fat mass or diabetes and would never be the same as that of a gene knock-out animal model. Therefore, as long as the effect of other confounding factors such as mechanical loading is removed, the role of adiponectin level on bone metabolism could easily be observed. Indeed, in a recently published clinical study, the researchers found a positive relationship between the total serum adiponectin level and BMD in patients with T2DM after adjustment for body weight and waist circumference (15).
Although one group of researchers reported that adiponectin has no direct effect on osteoclasts (18), most other in vitro studies have found that adiponectin significantly inhibits macrophage colony-stimulating factor- and RANKL-induced osteoclast differentiation (20–22). Yet, the molecular mechanism underlying the inhibitory effect of adiponectin on osteoclasts was not fully elucidated. In this study we found that adiponectin suppresses RANKL-induced osteoclastogenesis through decreasing expression levels of osteoclastogenic regulators, NFAT2 and TRAF6, as well as another two osteoclastic differentiation markers, TRACP and cathepsin K. Moreover, adiponectin indirectly suppresses osteoclast function through decreasing the osteoclast survival/proliferation rate and increasing osteoclast apoptosis. Using a siRNA construct specifically targeting APPL1, we found that the inhibitory effects of adiponectin on osteoclasts are mediated by APPL1, the first identified adaptor protein in adiponectin signaling.
To further investigate the underlying molecular mechanisms, we monitored the total and phosphorylation levels of Akt. Akt, also known as PKB, is a serine/threonine protein kinase and is a downstream target of phosphatidylinositol 3-kinase. Ample studies have demonstrated that enhanced Akt activity is critical in maintaining osteoclast survival (46) and enhancing osteoclast differentiation (47, 51). In this study we observed that adiponectin treatment significantly induced APPL1-mediated down-regulation of Akt activity in osteoclast precursor cells, which strongly indicated that the suppressive effect of adiponectin on osteoclasts results from the decreased Akt level.
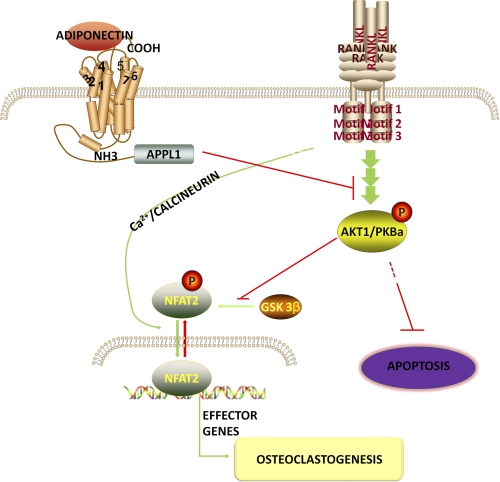
However, in regard to adiponectin-mediated effects on the Akt pathway, various studies have previously demonstrated inconsistent results in different cells. It was reported that in C2C12 myoblasts, adiponectin displays a synergistic effect on Akt activation with insulin (6), whereas another study indicated that adiponectin suppresses hepatic stellate cell proliferation through, at least partly, inhibition of the Akt pathway (48). There are three Akt family members, Akt1/PKBa, Akt2/PKBb, and Akt3/PKBc, with Akt1 and Akt2, but not Akt3, being ubiquitously expressed in various tissues (52, 53). Akt2 is expressed more predominantly in insulin target tissues such as fat, liver, and muscle (52, 53). Accordingly, although Akt1−/− mice and Akt2−/− mice showed similar phenotypes, only Akt2−/− mice exhibited severe diabetes (53–55). These gene knock-out studies revealed non-redundant functions of different Akt isoforms, which indicated that different Akt isoforms may display unique functions. Briefly, Akt1 is essential in cell proliferation and organism growth, whereas Akt2 is an important regulator of metabolic regulation (54, 55). To clarify whether the inhibitory effects of adiponectin on osteoclast differentiation and survival are mainly mediated by Akt1, we performed real time RT-PCR and a Western blot to determine expression changes in each individual Akt isoform. We found that adiponectin treatment mainly decreased the total and phosphorylated levels of Akt1 but not those of Akt2. Moreover, Akt1 overexpression in RAW264.7 cells reversed adiponectin-induced inhibition in RANKL-enhanced nuclear translocation of NFAT2 and cathepsin K expression, whereas Akt2 overexpression had no significant effect on adiponectin-induced biological changes in differentiating RAW264.7 cells. Previous findings have shown that phosphorylation of NFAT2 by GSK-3β prevents nuclear translocation of NFAT2 (56), whereas Akt signaling inhibits GSK-3β activity via phosphorylation of Ser-21 and Ser-9 residues (57, 58). Together with these previous findings, our results indicated that during osteoclast differentiation, Akt1 removes GSK-3β-mediated phosphorylation of NFAT2, which enhances nuclear translocation of NFAT2 and the expressions of NFAT2-targeted genes. Our results provided strong evidence that the reduction of Akt1 activity is the main reason for adiponectin-mediated inhibition in osteoclast formation. Using siRNA specifically targeting APPL1, we found that the effect of adiponectin on Akt activity is also mediated by APPL1. Based on these findings, we have described a model of the cross-talk between the adiponectin and RANKL/RANK signaling pathways (Fig. 9).
FIGURE 9.
The cross-talk between the adiponectin and RANKL/RANK signaling pathways in osteoclasts. Adiponectin binds to its membrane receptors, leading to recruitment of adaptor proteins such as APPL1. APPL1 mediates adiponectin signaling and reduces activation of RANKL-dependent Akt1 and its effects on osteoclast survival and differentiation.
In addition to the findings showing that adiponectin inhibits osteoclastogenesis, we found that adiponectin promotes osteogenic differentiation, as indicated by increased promoter activities of Osx and BSP after adiponectin treatment. Osx is an essential osteogenic transcription factor, and BSP is an important extracellular bone matrix protein that has long been used as a bone-specific marker. These results suggest that adiponectin enhances osteoblast differentiation and new bone formation through up-regulating expression levels of osteogenic transcription factors and bone matrix proteins.
As an insulin-sensitizing hormone, adiponectin plays an important role in regulating energy homeostasis and insulin sensitivity (4, 5). In addition, adiponectin has potent anti-inflammatory properties by suppressing inflammatory cytokines while activating anti-inflammatory cytokines (7–9). Showing that adiponectin not only promotes osteoblast differentiation but also inhibits osteoclastogenesis, our findings clearly indicated an important role of adiponectin in maintaining normal bone homeostasis. Based on the fact that adiponectin plays important roles in regulating energy metabolism, suppressing inflammation, promoting bone formation, and inhibiting excessive bone resorption, this adipokine could be used as an ideal therapeutic modulator of bone loss diseases, especially for those that are simultaneously related to an abnormal energy metabolism and a chronic inflammatory state.
A potential example of this kind of bone loss disease is T2DM-associated periodontitis. Considered to be closely associated with a state of low grade inflammation (59, 60), obesity and T2DM have a strong association with periodontitis, an inflammatory disease characterized by severe alveolar bone loss (61, 62). In fact, periodontal disease has been termed as the sixth complication of diabetes, and it is widely accepted in the periodontal community that diabetes not only is an important risk factor for periodontal disease but also associates with “refractory” periodontitis (32, 63). The decreased adiponectin level and the low-grade chronic systemic inflammation observed in obesity and T2DM patients are suggested to be the pathological basis for the association between T2DM and periodontitis (64). Together with previous findings, our study has a strong clinical relevance, which indicates that the application of adiponectin as a novel therapy for bone loss diseases such as T2DM-associated periodontitis may allow precise and predictable control of both insulin resistance found in uncontrolled T2DM and the refractory inflammation found in T2DM-associated periodontal disease.
Acknowledgment
We thank Dana Murray for secretarial assistance with preparation of this manuscript.
This work was supported, in whole or in part, by National Institutes of Health Grant Grants DE14537 and DE16710 (to J. C.)
- T2DM
- type 2 diabetes mellitus
- BMD
- bone mineral density
- BSP
- bone sialoprotein
- GFP
- green fluorescent protein
- EGFP
- enhanced GFP
- TRACP
- tartrate-resistant acid phosphatase
- Osx
- osterix
- MNC
- multinucleated cells
- TRAF6
- TNF receptor-associated factor 6
- MTT
- 3-(4,5-dimethylthiazol-2-yl)-2,5-diphenyltetrazolium bromide
- Bis-Tris
- 2-[bis(2-hydroxyethyl)amino]-2-(hydroxymethyl)propane-1,3-diol.
REFERENCES
- 1. Spiegelman B. M., Flier J. S. (2001) Cell 104, 531–543 [DOI] [PubMed] [Google Scholar]
- 2. Friedman J. M. (2000) Nature 404, 632–634 [DOI] [PubMed] [Google Scholar]
- 3. Shapiro L., Scherer P. E. (1998) Curr. Biol. 8, 335–338 [DOI] [PubMed] [Google Scholar]
- 4. Weyer C., Funahashi T., Tanaka S., Hotta K., Matsuzawa Y., Pratley R. E., Tataranni P. A. (2001) J. Clin. Endocrinol. Metab. 86, 1930–1935 [DOI] [PubMed] [Google Scholar]
- 5. Hotta K., Funahashi T., Bodkin N. L., Ortmeyer H. K., Arita Y., Hansen B. C., Matsuzawa Y. (2001) Diabetes 50, 1126–1133 [DOI] [PubMed] [Google Scholar]
- 6. Mao X., Kikani C. K., Riojas R. A., Langlais P., Wang L., Ramos F. J., Fang Q., Christ-Roberts C. Y., Hong J. Y., Kim R. Y., Liu F., Dong L. Q. (2006) Nat. Cell Biol. 8, 516–523 [DOI] [PubMed] [Google Scholar]
- 7. Yokota T., Oritani K., Takahashi I., Ishikawa J., Matsuyama A., Ouchi N., Kihara S., Funahashi T., Tenner A. J., Tomiyama Y., Matsuzawa Y. (2000) Blood 96, 1723–1732 [PubMed] [Google Scholar]
- 8. Kumada M., Kihara S., Ouchi N., Kobayashi H., Okamoto Y., Ohashi K., Maeda K., Nagaretani H., Kishida K., Maeda N., Nagasawa A., Funahashi T., Matsuzawa Y. (2004) Circulation 109, 2046–2049 [DOI] [PubMed] [Google Scholar]
- 9. Wulster-Radcliffe M. C., Ajuwon K. M., Wang J., Christian J. A., Spurlock M. E. (2004) Biochem. Biophys. Res. Commun. 316, 924–929 [DOI] [PubMed] [Google Scholar]
- 10. Hotta K., Funahashi T., Arita Y., Takahashi M., Matsuda M., Okamoto Y., Iwahashi H., Kuriyama H., Ouchi N., Maeda K., Nishida M., Kihara S., Sakai N., Nakajima T., Hasegawa K., Muraguchi M., Ohmoto Y., Nakamura T., Yamashita S., Hanafusa T., Matsuzawa Y. (2000) Arterioscler. Thromb. Vasc. Biol. 20, 1595–1599 [DOI] [PubMed] [Google Scholar]
- 11. Hu E., Liang P., Spiegelman B. M. (1996) J. Biol. Chem. 271, 10697–10703 [DOI] [PubMed] [Google Scholar]
- 12. Maeda N., Takahashi M., Funahashi T., Kihara S., Nishizawa H., Kishida K., Nagaretani H., Matsuda M., Komuro R., Ouchi N., Kuriyama H., Hotta K., Nakamura T., Shimomura I., Matsuzawa Y. (2001) Diabetes 50, 2094–2099 [DOI] [PubMed] [Google Scholar]
- 13. Araneta M. R., von Mühlen D., Barrett-Connor E. (2009) J. Bone Miner. Res. 24, 2016–2022 [DOI] [PMC free article] [PubMed] [Google Scholar]
- 14. Lenchik L., Register T. C., Hsu F. C., Lohman K., Nicklas B. J., Freedman B. I., Langefeld C. D., Carr J. J., Bowden D. W. (2003) Bone 33, 646–651 [DOI] [PubMed] [Google Scholar]
- 15. Kanazawa I., Yamaguchi T., Sugimoto T. (2010) Metabolism 59, 1252–1256 [DOI] [PubMed] [Google Scholar]
- 16. Zillikens M. C., Uitterlinden A. G., van Leeuwen J. P., Berends A. L., Henneman P., van Dijk K. W., Oostra B. A., van Duijn C. M., Pols H. A., Rivadeneira F. (2010) Calcif. Tissue Int. 86, 116–125 [DOI] [PMC free article] [PubMed] [Google Scholar]
- 17. Vondracek S. F., Voelkel N. F., McDermott M. T., Valdez C. (2009) Int. J. Chron. Obstruct. Pulmon. Dis. 4, 267–277 [DOI] [PMC free article] [PubMed] [Google Scholar]
- 18. Luo X. H., Guo L. J., Xie H., Yuan L. Q., Wu X. P., Zhou H. D., Liao E. Y. (2006) J. Bone Miner. Res. 21, 1648–1656 [DOI] [PubMed] [Google Scholar]
- 19. Lee H. W., Kim S. Y., Kim A. Y., Lee E. J., Choi J. Y., Kim J. B. (2009) Stem Cells 27, 2254–2262 [DOI] [PubMed] [Google Scholar]
- 20. Oshima K., Nampei A., Matsuda M., Iwaki M., Fukuhara A., Hashimoto J., Yoshikawa H., Shimomura I. (2005) Biochem. Biophys. Res. Commun. 331, 520–526 [DOI] [PubMed] [Google Scholar]
- 21. Yamaguchi N., Kukita T., Li Y. J., Martinez Argueta J. G., Saito T., Hanazawa S., Yamashita Y. (2007) FEMS Immunol. Med. Microbiol. 49, 28–34 [DOI] [PubMed] [Google Scholar]
- 22. Yamaguchi N., Kukita T., Li Y. J., Kamio N., Fukumoto S., Nonaka K., Ninomiya Y., Hanazawa S., Yamashita Y. (2008) FEBS Lett. 582, 451–456 [DOI] [PubMed] [Google Scholar]
- 23. Shinoda Y., Yamaguchi M., Ogata N., Akune T., Kubota N., Yamauchi T., Terauchi Y., Kadowaki T., Takeuchi Y., Fukumoto S., Ikeda T., Hoshi K., Chung U. I., Nakamura K., Kawaguchi H. (2006) J. Cell. Biochem. 99, 196–208 [DOI] [PubMed] [Google Scholar]
- 24. Williams G. A., Wang Y., Callon K. E., Watson M., Lin J. M., Lam J. B., Costa J. L., Orpe A., Broom N., Naot D., Reid I. R., Cornish J. (2009) Endocrinology 150, 3603–3610 [DOI] [PubMed] [Google Scholar]
- 25. Goulding A., Grant A. M., Williams S. M. (2005) J. Bone Miner. Res. 20, 2090–2096 [DOI] [PubMed] [Google Scholar]
- 26. Hsu Y. H., Venners S. A., Terwedow H. A., Feng Y., Niu T., Li Z., Laird N., Brain J. D., Cummings S. R., Bouxsein M. L., Rosen C. J., Xu X. (2006) Am. J. Clin. Nutr. 83, 146–154 [DOI] [PubMed] [Google Scholar]
- 27. Zhao L. J., Liu Y. J., Liu P. Y., Hamilton J., Recker R. R., Deng H. W. (2007) J. Clin. Endocrinol. Metab. 92, 1640–1646 [DOI] [PMC free article] [PubMed] [Google Scholar]
- 28. Elefteriou F., Ahn J. D., Takeda S., Starbuck M., Yang X., Liu X., Kondo H., Richards W. G., Bannon T. W., Noda M., Clement K., Vaisse C., Karsenty G. (2005) Nature 434, 514–520 [DOI] [PubMed] [Google Scholar]
- 29. Heine P. A., Taylor J. A., Iwamoto G. A., Lubahn D. B., Cooke P. S. (2000) Proc. Natl. Acad. Sci. U.S.A. 97, 12729–12734 [DOI] [PMC free article] [PubMed] [Google Scholar]
- 30. Oh K. W., Lee W. Y., Rhee E. J., Baek K. H., Yoon K. H., Kang M. I., Yun E. J., Park C. Y., Ihm S. H., Choi M. G., Yoo H. J., Park S. W. (2005) Clin. Endocrinol. (Oxf) 63, 131–138 [DOI] [PubMed] [Google Scholar]
- 31. Ravn P., Cizza G., Bjarnason N. H., Thompson D., Daley M., Wasnich R. D., McClung M., Hosking D., Yates A. J., Christiansen C. (1999) J. Bone Miner. Res. 14, 1622–1627 [DOI] [PubMed] [Google Scholar]
- 32. Preshaw P. M., Foster N., Taylor J. J. (2007) Periodontol. 2000 45, 138–157 [DOI] [PubMed] [Google Scholar]
- 33. Stolk R. P., Van Daele P. L., Pols H. A., Burger H., Hofman A., Birkenhäger J. C., Lamberts S. W., Grobbee D. E. (1996) Bone 18, 545–549 [DOI] [PubMed] [Google Scholar]
- 34. Dacquin R., Davey R. A., Laplace C., Levasseur R., Morris H. A., Goldring S. R., Gebre-Medhin S., Galson D. L., Zajac J. D., Karsenty G. (2004) J. Cell Biol. 164, 509–514 [DOI] [PMC free article] [PubMed] [Google Scholar]
- 35. Ealey K. N., Kaludjerovic J., Archer M. C., Ward W. E. (2008) Exp. Biol. Med. (Maywood) 233, 1546–1553 [DOI] [PubMed] [Google Scholar]
- 36. Tanaka H., Seino Y. (2004) J. Steroid Biochem. Mol. Biol. 89–90, 343–345 [DOI] [PubMed] [Google Scholar]
- 37. Li S., Tu Q., Zhang J., Stein G., Lian J., Yang P. S., Chen J. (2008) J. Cell. Physiol. 215, 204–209 [DOI] [PMC free article] [PubMed] [Google Scholar]
- 38. Tu Q., Zhang J., Fix A., Brewer E., Li Y. P., Zhang Z. Y., Chen J. (2009) J. Cell. Physiol. 218, 135–145 [DOI] [PMC free article] [PubMed] [Google Scholar]
- 39. Valverde P., Zhang J., Fix A., Zhu J., Ma W., Tu Q., Chen J. (2008) J. Bone Miner. Res. 23, 1775–1788 [DOI] [PMC free article] [PubMed] [Google Scholar]
- 40. Hildebrand T., Laib A., Müller R., Dequeker J., Rüegsegger P. (1999) J. Bone Miner. Res. 14, 1167–1174 [DOI] [PubMed] [Google Scholar]
- 41. Tu Q., Yamauchi M., Pageau S. C., Chen J. J. (2004) Biochem. Biophys. Res. Commun. 316, 461–467 [DOI] [PubMed] [Google Scholar]
- 42. Tu Q., Zhang J., Paz J., Wade K., Yang P., Chen J. (2008) J. Cell. Physiol. 217, 40–47 [DOI] [PMC free article] [PubMed] [Google Scholar]
- 43. Valverde P., Tu Q., Chen J. (2005) J. Bone Miner. Res. 20, 1669–1679 [DOI] [PubMed] [Google Scholar]
- 44. Hirotani H., Tuohy N. A., Woo J. T., Stern P. H., Clipstone N. A. (2004) J. Biol. Chem. 279, 13984–13992 [DOI] [PubMed] [Google Scholar]
- 45. Cyert M. S. (2001) J. Biol. Chem. 276, 20805–20808 [DOI] [PubMed] [Google Scholar]
- 46. Shishodia S., Aggarwal B. B. (2006) Oncogene 25, 1463–1473 [DOI] [PubMed] [Google Scholar]
- 47. Yano A., Tsutsumi S., Soga S., Lee M. J., Trepel J., Osada H., Neckers L. (2008) Proc. Natl. Acad. Sci. U.S.A. 105, 15541–15546 [DOI] [PMC free article] [PubMed] [Google Scholar]
- 48. Adachi M., Brenner D. A. (2008) Hepatology 47, 677–685 [DOI] [PubMed] [Google Scholar]
- 49. Maeda N., Shimomura I., Kishida K., Nishizawa H., Matsuda M., Nagaretani H., Furuyama N., Kondo H., Takahashi M., Arita Y., Komuro R., Ouchi N., Kihara S., Tochino Y., Okutomi K., Horie M., Takeda S., Aoyama T., Funahashi T., Matsuzawa Y. (2002) Nat. Med. 8, 731–737 [DOI] [PubMed] [Google Scholar]
- 50. Saito M., Fujii K., Mori Y., Marumo K. (2006) Osteoporos. Int. 17, 1514–1523 [DOI] [PubMed] [Google Scholar]
- 51. Sugatani T., Hruska K. A. (2005) J. Biol. Chem. 280, 3583–3589 [DOI] [PubMed] [Google Scholar]
- 52. Hanada M., Feng J., Hemmings B. A. (2004) Biochim. Biophys. Acta 1697, 3–16 [DOI] [PubMed] [Google Scholar]
- 53. Yang Z. Z., Tschopp O., Hemmings-Mieszczak M., Feng J., Brodbeck D., Perentes E., Hemmings B. A. (2003) J. Biol. Chem. 278, 32124–32131 [DOI] [PubMed] [Google Scholar]
- 54. Garofalo R. S., Orena S. J., Rafidi K., Torchia A. J., Stock J. L., Hildebrandt A. L., Coskran T., Black S. C., Brees D. J., Wicks J. R., McNeish J. D., Coleman K. G. (2003) J. Clin. Invest. 112, 197–208 [DOI] [PMC free article] [PubMed] [Google Scholar]
- 55. Cho H., Thorvaldsen J. L., Chu Q., Feng F., Birnbaum M. J. (2001) J. Biol. Chem. 276, 38349–38352 [DOI] [PubMed] [Google Scholar]
- 56. Beals C. R., Sheridan C. M., Turck C. W., Gardner P., Crabtree G. R. (1997) Science 275, 1930–1934 [DOI] [PubMed] [Google Scholar]
- 57. Doble B. W., Woodgett J. R. (2003) J. Cell Sci. 116, 1175–1186 [DOI] [PMC free article] [PubMed] [Google Scholar]
- 58. Manning B. D., Cantley L. C. (2007) Cell 129, 1261–1274 [DOI] [PMC free article] [PubMed] [Google Scholar]
- 59. Xu H., Barnes G. T., Yang Q., Tan G., Yang D., Chou C. J., Sole J., Nichols A., Ross J. S., Tartaglia L. A., Chen H. (2003) J. Clin. Invest. 112, 1821–1830 [DOI] [PMC free article] [PubMed] [Google Scholar]
- 60. Weisberg S. P., McCann D., Desai M., Rosenbaum M., Leibel R. L., Ferrante A. W., Jr. (2003) J. Clin. Invest. 112, 1796–1808 [DOI] [PMC free article] [PubMed] [Google Scholar]
- 61. Saito T., Shimazaki Y., Sakamoto M. (1998) N. Engl. J. Med. 339, 482–483 [DOI] [PubMed] [Google Scholar]
- 62. Nelson R. G., Shlossman M., Budding L. M., Pettitt D. J., Saad M. F., Genco R. J., Knowler W. C. (1990) Diabetes Care 13, 836–840 [DOI] [PubMed] [Google Scholar]
- 63. Pischon N., Heng N., Bernimoulin J. P., Kleber B. M., Willich S. N., Pischon T. (2007) J. Dent. Res. 86, 400–409 [DOI] [PubMed] [Google Scholar]
- 64. Fantuzzi G. (2005) J. Allergy Clin. Immunol. 115, 911–919; quiz 920 [DOI] [PubMed] [Google Scholar]


