

Abstract
Protein design aims at designing new protein molecules of desired structure and functionality. One of the major obstacles to large-scale protein design is the extensive time and manpower requirements for experimental validation of the designed sequences. Recent advances in protein structure prediction have provided potentials for automated assessment of the designed sequences via folding simulations. We present a new protocol for protein design-and-validation. The sequence space is initially searched by Monte Carlo sampling guided by a public atomic potential, with candidate sequences selected by the clustering of sequence decoys. The designed sequences are then assessed by I-TASSER folding simulations, which generate full-length atomic structural models by the iterative assembly of threading fragments. The protocol is tested on 52 non-homologous single-domain proteins, with average sequence identity of 24% between the designed and native sequences. Despite this low sequence identity, 3D models predicted for the first designed sequence have an RMSD <2 Å to the target structure in 62% of cases. This percentage increases to 77% if we consider the 3D models from the top 10 designed sequences. Such a striking consistency between the target structure and the structural prediction from nonhomologous sequences, despite the fact that the design and folding algorithms adopt completely different force fields, indicates that the design algorithm captures the features essential to the global fold of the target. On average, the designed sequences have a free energy that is 0.39 kcal/(mol·residue) lower than in the native, potentially affording a greater stability to synthesized target folds.
Keywords: Protein design, protein structure prediction, Monte Carlo minimization, sequence clustering
INTRODUCTION
Protein design aims to discover novel amino acid sequences that fold into target conformations of desired functionalities. Computational approaches 3 usually commence with a rigid or slightly flexible backbone structure and search for an amino acid sequence that minimizes, through a favorable arrangement of the side chains, the (Gibbs) free energy of the protein. Such an approach relies on the working paradigm that the sequences of lowest free energy are the most stable in the target structure.
Since the search space is generally too large for the global free-energy minimum to be found deterministically, one has to rely on stochastic optimizations 4 such as the popular Monte Carlo algorithms 5, which do not guarantee global optimality because they evaluate only a sample of the search space; nonetheless, such algorithms can approach global optima in comparatively short times. The exact minimization of free energy is also impeded by approximation errors in the computation of free energy; while the general free-energy landscape of the system may be preserved, such errors can deform the global minimum, thereby compromising the reliability of any computed global minimum as the most suitable for the target structure. We speculate that a plausible correction measure might be to cluster by sequence similarity the decoys obtained in free-energy minimization, and then selecting the final sequence from the largest cluster. It is expected that the final sequence is, in terms of suitability to the target structure, a better representative of the ensemble of low free-energy decoys than the computed global free-energy minimum. The idea of clustering low free-energy decoys by sequence similarity is analogous to the one successfully used in the fields of protein structure prediction and protein docking. In those works, clusters of structurally-similar 3D decoys obtained from energy minimization often had members that, compared to the decoys having the lowest energy, were closer to the native structure.
A protein design algorithm using the basic principle of free-energy minimization should be effective over a range of target folds. It is therefore sensible to assess its performance on a target set that is large and heterogeneous. Although the production of novel folds is a major motivation for many protein designs 9, the assessment of any algorithm on a large scale is still dependent on natural backbones, whose native sequences and structures remain crucial for the validation of designed sequences. Such a need is due to the daunting costs of the experimental validation for the target fold, requiring the time- and manpower-expensive procedures of cloning, expression, purification, and crystallization.
Traditionally, the main criterion of automatic assessment has been native recapitulation, measuring the degree of similarity between the native and designed sequences. If the two are consistently similar over a representative ensemble of proteins, the algorithm is expected to yield correctly-folding sequences for any backbone, including novel structures. By taking native recapitulation as simply the percent identity between the native and designed sequences, average values of 23% over 264 proteins 11 and 38% over 38 proteins 13 were reported. Other studies defined a slightly different metric — the percentage, over all test proteins, of designed residues that are identical to the native ones — obtaining values of 27% over 108 proteins 10 and 37% over 42 proteins 12. Regardless of the precise definition, native recapitulation invariably increased, reaching 51% 10, 57% 12, and 63% 13, when evaluated only in the residues forming the core of the protein, a consequence of the major contribution that the core makes to a fold’s stability.
The automatic assessment of designed sequences has become more complete thanks to the recent methodological advances in protein structure prediction 16, which have allowed a more robust evaluation of whether a designed sequence can fold into the target backbone structure. Although protein structure prediction still cannot guarantee the same level of confidence as experimental validation, the field has matured to the point that low- to medium-resolution structure models (mainly at the fold level) can be generated for single-domain proteins even in the absence of homologous templates. For example, I-TASSER, demonstrated to be one of the most reliable protein structure prediction methods in the recent blind CASP (Critical Assessment of Techniques for Protein Structure Prediction) experiments, can generate correct folds for 2/3 of the single-domain proteins without using any templates with an identity >30% to the target sequence.
In this work we present a new algorithm for protein design, which first generates a set of decoy sequences from 10 runs of Monte Carlo free-energy minimization and then selects from the set, by means of a sequence-based clustering procedure, putative sequences for the target fold. During the minimization stage, the free energy of each decoy sequence is evaluated by FoldX 21 with the side-chain conformations calculated by SCWRL 22. During the clustering stage, the decoy sequences are grouped into clusters according to a “sequence distance” calculated by using the BLOSUM62 matrix 23. We assess the foldability of the designed sequences on 52 non-redundant single-domain proteins in terms of the backbone RMSD between the target structures and the models predicted by I-TASSER for the designed sequences. A comparison to previous large-scale works is made on the native recapitulation of the designed sequences. In the following sections the sequences selected by the clustering procedure (10 per test protein) will be called “cluster tags”; in particular, the “first cluster tag” will denote the sequence selected from the largest cluster. Although we treated the FoldX score as “energy” in our Monte Carlo search, the FoldX function contains two entropic terms besides the energy (enthalpic) terms, accounting for the entropic costs of fixing the backbone in the folded state and fixing the side chains in specific conformations, respectively 21. We therefore refer to the FoldX score as “FoldX free energy” throughout the paper.
RESULTS
Sequence-based assessment of the designed sequences
The native recapitulation of our designed sequences is similar to the lowest values reported in previous studies. According to Table 1, the average sequence identity of the first cluster tag to the native sequence is 24%. A slightly lower identity, 23%, was obtained in 11, where the sequences designed for the same protein were explicitly selected for diversity. If for each protein one considers the cluster tag with highest identity to native, the average identity increases to 27%, a value that is significantly lower than the 38% obtained in 13. Even when defined as the percentage of all designed residues that are identical to native, the native recapitulation is 24% for the first cluster tag and 27% for the highest-identity cluster tag; these values are comparable to the 27% in 10, but well below the 37% in 12. A similar trend holds, albeit with higher values, where sequence identity is defined only on the core residues (values in parentheses, Table 1). For example, the cluster tag of the highest identity to native has an average core identity to native of 42%, while the average core identity to native reported in 13 is 63%. It should however be noted that the different recapitulations of the core residues between our algorithm and previous methods may partly reflect our definition of the core residues (see Materials and Methods). While the low native recapitulation of our designed sequences means that they differ significantly from sequences that are known to fold into the target structures, this should not be taken as evidence that the target structures are inaccessible to our designed sequences. In fact, the assessment by native recapitulation may unduly disregard the remote homologs, which despite a low identity to the native sequence (say, <30%) still adopt the target fold.
Table 1.
Sequence and structural assessment of the sequences designed for 52 test proteins.
| % identity to native sequence | RMSD of I-TASSER model to target (Å) | |||||||
|---|---|---|---|---|---|---|---|---|
| clustering | free-energy minimization |
clustering | free-energy minimization |
|||||
| PDB (length) | 1st tag* | best tag† | global min‡ | local min§ | 1st tag | best tag¶ | global min | local min‖ |
| 1GUTA (51) | 20 (33)** | 24 (44) | 22 (33) | 24 (22) | 1,93 | 1,39 | 0,86 | 0,83 |
| 2CMPA (52) | 25 (69) | 25 (69) | 19 (46) | 27 (69) | 0,99 | 0,75 | 3,31 | 0,67 |
| 3G36A (52) | 21 (0) | 25 (25) | 19 (0) | 29 (0) | 3,35 | 3,04 | 3,55 | 2,44 |
| 3FILA (56) | 32 (67) | 32 (67) | 25 (50) | 34 (67) | 0,86 | 0,86 | 0,88 | 0,78 |
| 1OAIA (57) | 25 (31) | 30 (31) | 16 (15) | 26 (31) | 1,56 | 1,38 | 2,43 | 1,42 |
| 2VPBA (57) | 9 (18) | 18 (27) | 11 (9) | 18 (27) | 10,23 | 6,19 | 12,35 | 6,14 |
| 2V1QA (59) | 27 (71) | 31 (57) | 32 (64) | 32 (64) | 1,16 | 1,16 | 3,79 | 0,71 |
| 1KQ1A (60) | 17 (38) | 22 (23) | 15 (15) | 22 (38) | 0,72 | 0,72 | 7,31 | 0,84 |
| 2P5KA (63) | 14 (31) | 21 (38) | 16 (44) | 22 (63) | 11,30 | 1,80 | 11,55 | 1,78 |
| 1TUKA (67) | 27 (42) | 31 (47) | 28 (42) | 30 (42) | 2,24 | 2,12 | 2,70 | 2,13 |
| 2O9SA (67) | 31 (53) | 33 (47) | 31 (53) | 33 (58) | 12,81 | 2,22 | 2,44 | 2,30 |
| 1UTGA (70) | 13 (10) | 21 (20) | 21 (30) | 21 (20) | 0,74 | 0,73 | 0,64 | 0,64 |
| 1V5IB (70) | 27 (40) | 27 (40) | 23 (35) | 26 (35) | 1,66 | 1,66 | 3,57 | 1,50 |
| 2B97A (70) | 27 (37) | 27 (37) | 27 (53) | 34 (53) | 2,98 | 1,12 | 0,70 | 0,70 |
| 2QCPX (76) | 29 (79) | 29 (79) | 25 (53) | 29 (68) | 4,33 | 0,89 | 2,26 | 2,16 |
| 2CVIA (77) | 20 (32) | 22 (32) | 22 (32) | 23 (36) | 4,39 | 1,05 | 6,05 | 2,63 |
| 3G21A (77) | 26 (26) | 27 (21) | 13 (21) | 25 (37) | 2,12 | 2,12 | 10,05 | 2,74 |
| 2J8BA (78) | 21 (36) | 21 (36) | 22 (24) | 22 (24) | 10,98 | 4,62 | 11,58 | 8,16 |
| 2D3DA (83) | 22 (42) | 33 (63) | 24 (38) | 31 (54) | 2,64 | 1,07 | 2,59 | 1,12 |
| 3FEAA (83) | 31 (54) | 36 (58) | 31 (54) | 33 (62) | 0,66 | 0,66 | 0,75 | 0,67 |
| 2ZXYA (86) | 23 (27) | 29 (45) | 28 (36) | 29 (50) | 10,48 | 1,12 | 3,18 | 2,05 |
| 2GPIA (91) | 11 (22) | 19 (39) | 9 (17) | 20 (30) | 15,67 | 2,86 | 18,54 | 12,05 |
| 2FTRA (96) | 20 (20) | 29 (32) | 20 (20) | 31 (32) | 6,45 | 3,05 | 7,31 | 1,41 |
| 1IUJA (97) | 20 (21) | 23 (18) | 21 (25) | 22 (25) | 3,91 | 1,96 | 4,73 | 3,85 |
| 1MG4A (101) | 22 (37) | 30 (50) | 20 (33) | 32 (50) | 1,22 | 1,22 | 1,69 | 1,24 |
| 2PV2A (103) | 29 (50) | 33 (53) | 29 (50) | 35 (53) | 0,70 | 0,65 | 0,67 | 0,65 |
| 1VQSA (104) | 26 (29) | 27 (36) | 23 (39) | 24 (29) | 4,03 | 1,25 | 2,60 | 1,25 |
| 3IV4A (106) | 20 (32) | 25 (50) | 20 (32) | 24 (42) | 11,66 | 3,85 | 12,54 | 2,98 |
| 3CTGA (108) | 18 (24) | 24 (32) | 16 (24) | 24 (38) | 1,13 | 0,91 | 0,89 | 0,88 |
| 1NZ0A (109) | 20 (30) | 24 (38) | 21 (33) | 27 (38) | 1,60 | 1,55 | 2,58 | 0,97 |
| 3E9TA (112) | 24 (35) | 33 (59) | 23 (35) | 33 (59) | 1,01 | 0,78 | 0,75 | 0,62 |
| 1O7IA (115) | 24 (41) | 30 (38) | 24 (38) | 29 (46) | 0,69 | 0,69 | 6,57 | 0,72 |
| 3H7HA (115) | 24 (31) | 24 (31) | 19 (26) | 22 (33) | 0,72 | 0,72 | 3,86 | 0,79 |
| 1WN2A (117) | 30 (49) | 30 (49) | 27 (44) | 30 (51) | 1,05 | 1,05 | 1,88 | 0,73 |
| 2F01A (121) | 18 (24) | 20 (34) | 21 (28) | 21 (28) | 2,92 | 2,92 | 3,63 | 3,63 |
| 1DBWA (123) | 31 (35) | 31 (35) | 24 (25) | 31 (35) | 1,38 | 1,05 | 1,13 | 1,13 |
| 2ERBA (123) | 20 (31) | 21 (39) | 20 (33) | 26 (47) | 1,19 | 0,80 | 2,35 | 0,93 |
| 1EAQA (124) | 31 (46) | 31 (46) | 25 (39) | 33 (49) | 1,20 | 1,20 | 4,30 | 1,16 |
| 1OH0A (125) | 23 (27) | 28 (43) | 25 (32) | 26 (27) | 1,41 | 0,96 | 1,27 | 1,18 |
| 1VZIA (125) | 24 (50) | 29 (56) | 25 (56) | 29 (56) | 0,72 | 0,72 | 0,99 | 0,67 |
| 2VZCA (127) | 29 (53) | 29 (53) | 22 (34) | 30 (49) | 1,03 | 1,03 | 1,80 | 0,84 |
| 1ZHVA (128) | 24 (32) | 24 (32) | 24 (29) | 28 (37) | 0,73 | 0,73 | 0,67 | 0,67 |
| 1JF8A (130) | 29 (46) | 29 (46) | 22 (32) | 29 (50) | 0,71 | 0,63 | 3,88 | 0,64 |
| 3EBTA (131) | 28 (51) | 28 (51) | 25 (47) | 30 (53) | 1,22 | 1,12 | 6,14 | 1,09 |
| 2PR7A (137) | 26 (35) | 29 (37) | 23 (24) | 32 (39) | 1,27 | 0,91 | 3,42 | 0,63 |
| 1QHQA (139) | 37 (48) | 37 (48) | 33 (44) | 36 (50) | 0,56 | 0,55 | 0,55 | 0,50 |
| 2O1QA (139) | 26 (33) | 28 (41) | 27 (33) | 27 (37) | 0,83 | 0,80 | 0,86 | 0,84 |
| 2WLVA (144) | 20 (20) | 26 (31) | 25 (29) | 26 (36) | 1,48 | 0,84 | 0,96 | 0,76 |
| 2ANXA (145) | 23 (32) | 28 (43) | 24 (34) | 30 (43) | 0,88 | 0,77 | 1,83 | 0,79 |
| 3FH2A (145) | 32 (42) | 32 (42) | 31 (38) | 37 (48) | 0,83 | 0,56 | 0,62 | 0,54 |
| 2V0UA (146) | 21 (36) | 21 (36) | 19 (30) | 21 (36) | 3,12 | 3,12 | 5,97 | 4,14 |
| 3EF8A (149) | 17 (22) | 17 (22) | 17 (20) | 19 (22) | 17,11 | 14,77 | 14,63 | 14,03 |
| average | 24 (37) | 27 (42) | 23 (34) | 28 (42) | 3,40 | 1,74 | 4,08 | 2,01 |
First cluster tag;
cluster tag of highest sequence identity to native;
global free-energy minimum over the 10 runs of Monte Carlo (MC) minimization;
run-local free-energy minimum of highest sequence identity to native over the 10 MC runs;
cluster tag of lowest RMSD to target;
run-local free-energy minimum of lowest RMSD to target over the 10 MC runs;
the identities in parentheses are restricted to the core residues.
Table 1 invites a closer examination of the relationship between native recapitulation and protein length. Since the number of Monte Carlo movement steps is fixed at 30,000 while the sequence space grows geometrically with protein length, the free-energy minimization would presumably end prematurely for longer proteins compared to shorter ones if there were insufficient sampling of sequence space. In fact, the identity of the cluster tags to the native sequence does not decrease with protein length. Rather, the correlation coefficient between the two quantities is actually positive (0.21 for the first cluster tag and 0.09 for the highest-identity cluster tag) when sequence identity is computed over all residues, and just slightly negative (−0.09 and −0.07, respectively) when only the core residues are considered. Such a low correlation may indicate that the Monte Carlo minimization did indeed adequately sample the important regions of sequence space even with the relatively small, fixed number of movement steps.
It should be noted that the low native recapitulation originates from a substantial diversity between native and designed sequences in the distribution of amino acid types. In Fig. 1(a) it is evident that the designed sequences are more hydrophobic, with 63% of the residues concentrated in the hydrophobic amino acid types (Isoleucine through Alanine 25), compared to 39% in the native sequences. Particularly striking is the 16% of Methionine in the designed sequences, a value that is more than 6 times higher than in the native sequences. In correspondence with the rich hydrophobic residue content, the designed sequences have also fewer hydrophilic residues. This gap is mainly due to the 7 most hydrophilic amino acid types, which are consistently less frequent in the designed sequences compared to native, with cumulative frequencies of 9% and 35% respectively. By contrast, the remaining hydrophilic amino acid types are similarly represented in the native (26%) and designed (28%) sequences. The abundance of hydrophobic amino acids in the designed sequences is not surprising, since for a process of free-energy minimization the hydrophobic interactions are favored due to their low energies. This suggests that free-energy minimization may yield sequences which stabilize the target fold to a greater degree than the native sequence, whose fold stability may be only that which is necessary to enable biological function.
Figure 1.

Comparison of the amino acid type distributions in the native and designed sequences for the test protein set. The frequency of occurrence of each amino acid type in the 52 native sequences (black) and in the 520 cluster tags (shaded) is shown for (a) all the residues, (b) the residues in the core, (c) the residues in the surface. The amino acid types are ordered by decreasing hydrophobicity according to the scale reported in 25.
Nonetheless, the native sequences do feature many hydrophobic amino acids in the core, since it is the hydrophobic interactions in the core that mainly determine fold stability 14. As would therefore be expected, the native and designed amino acid distributions display much closer agreement over the core residues (Fig. 1(b)), as indicated by a correlation coefficient of 0.70 for the core residues and 0.22 overall. The agreement is particularly strong (with a correlation coefficient of 0.93) in the 6 non-Methionine hydrophobic amino acid types. As these constitute the majority of the core residues, amounting to 63% in the native sequences and 62% in the designed sequences, our protein design algorithm seems to capture the primary importance of hydrophobic interactions in forming the protein cores. Another amino acid type that occurs with similar frequency in the native and designed sequences is Glycine; this similarity may follow, more directly, from the high native recapitulation observed for Glycine residues, due to the ability of FoldX to recognize (via an appropriate backbone entropy term 21) the dihedral angles that are specifically adopted by Glycine.
In Figure 1(c), we also show the frequency of the amino acid types in the surface regions. As expected, the hydrophobic residues on the surface are more frequent in the designed sequences (54%) than in the native sequences (27%), although for some amino acid types (i.e., Valine and Alanine) the occurrence in the designed sequences is slightly lower. In fact, most of the disproportion in hydrophobic content between native and designed sequences is accounted for by the surface residues, because it is here that the native sequences have been shaped by the evolutionary pressures for functional activity, involving, for example, the enforcement of charged/polar interactions with the ligands. Such ligand interactions and evolutionary pressures were, on the other hand, completely disregarded during the design of our sequences, which were instead selected purely to have the lowest free energy, in an attempt to optimize the stability of the target fold. As will be seen later, the free energy computed for the designed sequences is indeed much lower than in the native sequences over all the targets in our test set. In agreement with this observation, for example, studies by Raleigh and co-workers showed that hydrophilicto-hydrophobic mutations can result in an increase in fold stability of the native structure, even with the mutated residues located at the surface of the protein 26.
Structure-based assessment of the designed sequences
Despite having a relatively low native recapitulation and an amino acid distribution similar to native only in the core residues, the designed sequences are generally predicted by I-TASSER to fold very close to the target structure. Examples of this close similarity between I-TASSER model and target structure are illustrated in Fig. 2 for three selected proteins (of type α, β, and α/β respectively), while Table 1 summarizes the RMSD between model and target for all 52 test proteins. We define a test protein to be “covered” if at least one of the 10 cluster tags is predicted by I-TASSER to fold at closer than a specified RMSD threshold to the target structure. Here, only the first structure model of I-TASSER is considered 18. Table 1 shows that the fraction of covered proteins is 42% if the threshold is set to a very strict value of 1 Å. The coverage increases to 77% for a threshold of 2 Å, which is a reasonable upper bound for protein design to be regarded as successful. By taking into account only the first cluster tag, 29% of the proteins are covered under 1 Å, 62% under 2 Å.
Figure 2.
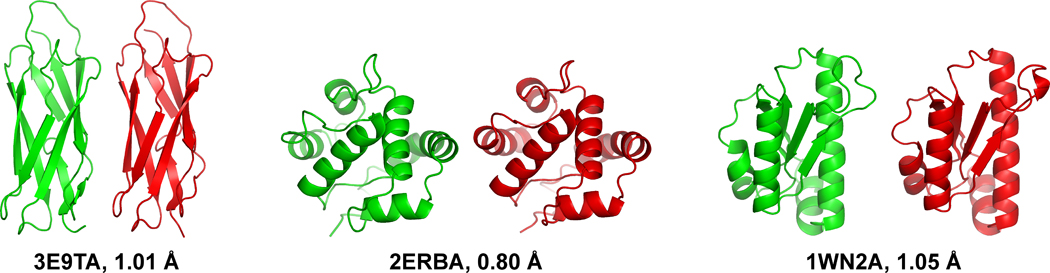
The target structure (green) and the I-TASSER model of the designed sequence (red) for three representative test proteins. The β target (left) is the calcium-binding domain of the Calx protein from Drosophila melanogaster (PDB ID: 3E9TA); the α target (center) is an odorant binding protein from Anopheles gambiae (PDB ID: 2ERBA); the α/β target is the peptidyl-tRNA hydrolase 2 from Pyrococcus horikoshii ot3 (PDB ID: 1WN2A). The designed sequences have a native sequence identity of 24%, 18%, and 30%, respectively. The figure was produced by using PyMOL 44.
If considering a looser cutoff of 4 Å, which generally corresponds to a structural similarity at the fold level, the protein design algorithm could not cover only three test proteins out of 52: 2VPBA, 2J8BA, and 3EF8A. However, variants of the clustering procedure presented here (see Materials and Methods) allowed to also cover proteins 2J8BA and 3EF8A. For the case of 2J8BA, setting the minimum size of the first cluster to 10% of the initial decoy set (as opposed to 40%) yielded a first cluster tag at 2.88 Å from the target. Protein 3EF8A was covered at 3.73 Å (second cluster tag) by defining sequence distance in terms of sequence identity rather than the BLOSUM62 score, and by constraining the sequences in a cluster to be >40% identical to the cluster tag. Such algorithmic variants, however, resulted in a slightly poorer coverage over the entire test set. Protein 2VPBA offered no successful structure predictions of RMSD <4 Å for any designed sequence.
The I-TASSER models are so close to the target structures primarily because similar template structures were detected for the designed sequences despite the low sequence identity between the designed sequences and the targets. Obviously, the structural features encoded in the designed sequences, including secondary structure and solvent accessibility propensity, are key for the I-TASSER threading algorithms to correctly recognize the templates. In addition, the I-TASSER structure-assembly procedure often helps to refine the templates closer to the target, as consistently observed in the blind CASP experiments. In CASP7 30, for example, the I-TASSER server drove the threading templates closer to native for 90 of the 105 template-based modeling targets, with an average RMSD improvement of ~1 Å in the aligned regions; in CASP8 31, the I-TASSER models were closer to native than the best threading templates for 139 out of 164 test domains, resulting in an RMSD reduction by 1.3 Å. In this study, I-TASSER proved that it can drive the threading templates closer to the target structure even when the modeled sequences are designed by computers. Figure 3 shows two of such examples. For protein 1GUTA (Fig. 3(a)), the best template has an RMSD of 2.56 Å to the target structure, which decreased to 1.39 Å after a substantial reassembly of the N- and C-termini and of the first two loops; in the case of 3EBTA (Fig. 3(b)), due to a refinement throughout the entire structure, and particularly of the β-sheet, the RMSD to target was reduced from 2.22 Å for the best template to 1.17 Å for the final model. Thus, the designed sequences are supported by the I-TASSER predictions in both aspects of threading and structure reassembly.
Figure 3.

Superposition of the target structure (green), the I-TASSER model of the designed sequence (red), and the best template identified by the threading program (blue). The template regions that were driven closer to the target by the I-TASSER structural assembly are enclosed by circles. (a) The target is the subunit A of the molibdate binding protein II from Clostridium pasteurianum (PDB ID: 1GUTA); the I-TASSER model of the designed sequence has an RMSD to target of 1.39 Å; the template has an RMSD to target of 2.56 Å. (b) The target is the NTF-like protein of unknown function from Burkholderia pseudomallei K96243 (PDB ID: 3EBTA); the I-TASSER model of the designed sequence has an RMSD to target of 1.17 Å; the template has an RMSD to target of 2.22 Å. The figure was produced by using PyMOL 44.
Even when evaluating the designed sequences in terms of their I-TASSER models, there is no clear dependence of sequence quality on sequence length. From the data in Table 1 we observe that the correlation coefficient between RMSD of model to target and sequence length is −0.17 for the first cluster tag and 0.05 for the lowest-RMSD cluster tag. Somewhat surprisingly, the average RMSD to target of the first cluster tag is almost twice as large for the 26 shortest proteins (top half of Table 1) compared to the longest 26 (4.47 Å versus 2.33 Å, respectively). Considering the lowest-RMSD cluster tag in the top 10 clusters, the difference between the two subsets of proteins remains, albeit the gap is reduced to 5% (1.78 Å versus 1.70 Å). This reflects that our design algorithm seems to work better for the longer proteins than for the shorter ones, presumably because the longer proteins tend to be packed into conformations that are more stable and therefore easier for the method to identify the lowest free-energy sequence.
Although the data showed that the I-TASSER prediction of the target fold was not barred by the low native recapitulation of the designed sequences, one might still expect the designed sequences with better I-TASSER models to display higher identity to native, at least in the core regions. Our results indicate that the correlation between native sequence identity and RMSD to target of the I-TASSER models is weak, and it is weaker in the core residues than in the whole chain. Over all the cluster tags, the correlation coefficient is −0.51 where sequence identity is computed over all residues, and −0.32 where restricted to the core residues. Regarding the first cluster tags, the corresponding values are −0.45 and −0.26, respectively. Figure 4 illustrates that there is no obvious correlation along the entire RMSD range, and many of the designed sequences have a low native sequence identity but also a low RMSD to target. For example, of the 315 cluster tags with a target RMSD <4 Å, 297 (i.e., 94%) have a native sequence identity <30%, while 84 (i.e., 27%) have a native sequence identity <20%. Similarly, considering the 180 cluster tags with a target RMSD <2 Å, the native sequence identity is <30% in 92% of the cases and <20% in 22% of the cases. At an RMSD threshold of 2 Å, 88% of the cluster tags are <50% identical to native in the core residues.
Figure 4.

Identity of the designed sequences to the native ones versus the backbone RMSD to target of the I-TASSER model. Both colors (red and blue) represent the same 520 sequences (cluster tags) designed for the 52 test proteins. The blue circles refer to a sequence identity computed over all residues, while the red circles to a sequence identity computed over the core residues only.
An average identity of 24% between designed and native sequences is low for the standards of protein design but still far from the expected 5% identity of random sequences. To rule out the possibility that the low-RMSD I-TASSER models are an artifact of the non-random sequence identity to native, we ran I-TASSER on a set of sequences that were generated randomly but with a sequence identity to native > 24%, as measured by the Needleman–Wunsch sequence alignment algorithm 32. As a result, for the same 52 test proteins, no sequence could be folded by I-TASSER into a structure at <9 Å from the target structure, with the average RMSD to target being 13.8 Å. Even when the randomized sequences were adjusted to follow the secondary structure propensities in the native sequences (by incorporating sequence segments cut from other PDB structures that had the same secondary structure, helical or strand, and keeping the overall sequence identity to native >24%), the folding result by I-TASSER had no general improvement: all I-TASSER models of the randomized sequences have an RMSD to target >6 Å, while their average RMSD to target is 13.4 Å. The randomized sequences in the latter case, endowed with secondary structure propensity but devoid of optimized tertiary interactions to stabilize the global fold, may be seen as a computational model of sequences that can only fold into molten-globule states, representing non-functional states of native-like secondary structure but without a tightly packed tertiary core. Hence, the I-TASSER algorithm is indeed selective to native-like sequences, satisfying the minimum requirement for validating designed proteins by computational structure prediction. The above experiment also shows that mere coupling of native sequence identity and secondary-structure propensity does not constitute a native-like sequence. Our protein design algorithm, instead, takes the organization of amino acid residues one step further — for example, by reinforcing not only the secondary structure propensity but also the critical tertiary interactions through a dense network of hydrophobic arrangements — which may enable the designed sequences to adopt the target fold and keep it stable.
The I-TASSER structure prediction highlighted that the sequences designed by free-energy minimization plus clustering are better than those designed by free-energy minimization alone; the improvement, however, failed to be detected by native recapitulation. In Table 1, it can be seen that the sequence identity to native of the cluster tags is similar to that of the free-energy minima local to the 10 Monte Carlo runs (hereafter referred to as “run-local minima”). In particular, by comparing equivalent sequences in the two approaches, we observe that the first cluster tag (24% average identity) and the global free-energy minimum over all Monte Carlo runs (23%) score almost equally, and the same applies to the cluster tag (27%) and the run-local minimum (28%) of highest identity to native. The only notable difference in terms of sequence identity lies in the core residues, with 37% for the first cluster tag and 34% for the global free-energy minimum. On the other hand, the average RMSD to target of the I-TASSER models is 17% lower for the first cluster tag (3.40 Å) than for the global free-energy minimum (4.08 Å), and 13% lower for the lowest-RMSD cluster tag (1.74 Å) than for the lowest-RMSD run-local minimum (2.01 Å). Taken together, these results indicate that free-energy minimization yields, on its own, valuable sequence trajectories, but it pays off to combine it with clustering, especially to select a single designed sequence out of a pool of candidates.
Energy-based assessment of the designed sequences
To select a designed sequence on the basis of free energy alone is discouraged by the rather weak correlation between free energy of the designed sequences and RMSD to target of their I-TASSER models. The correlation coefficient over all cluster tags and run-local minima of a protein is, on average, 0.23. Example data for six representative proteins are provided in Fig. 5, where it can also be noted that the native sequence has a higher free energy than all cluster tags and all run-local minima. This behavior holds for 51 of the 52 test proteins, the native free energy being on average 0.39 kcal/(mol∙residue) higher than the free energy of the cluster tags and 0.48 kcal/(mol·residue) higher than the free energy of the run-local minima. If able to fold into the target structure, our designed sequences thus promise to stabilize it more than the native sequence. Furthermore, because sequences with a lower free energy than the native sequence were typically found early in the Monte Carlo runs, it is difficult to believe that the native sequence is even a sub-optimal free-energy minimum.
Figure 5.

Energetic and structural assessment of the designed sequences for six representative test proteins. The FoldX free energy of the designed sequences on the target structure is plotted versus the backbone RMSD between the target and the I-TASSER model. The crosses denote the sequences of lowest free energy in each Monte Carlo run (run-local minima), while the open circles denote the cluster tags from all Monte Carlo runs. The native sequence is denoted by a filled diamond.
Another way to evaluate how likely the designed sequences may stabilize the target fold is through point mutation. For this purpose, we performed an extensive in silico mutation study on all native and designed sequences of our 52 test proteins, whereby each residue was mutated, in turn, into all other 19 amino acid types. The FoldX free energy of such one-residue mutant sequences was then compared against that of the original sequences. On average, 26% of the mutants of the native sequences cause a free-energy decrease, indicating that the native sequence is far from being a local free-energy minimum even among its own one-residue neighbors, based on the FoldX force field. By contrast, the designed sequences have only 5% of the mutants decreasing free energy, although they were obtained by clustering and not by pure free-energy minimization.
The residues of the designed sequences appear to be even more optimized in the core regions, since their mutation decreases free energy in less than 1% of the cases. This parallels the higher degree of optimization observed in the native cores, for which only 13% of the point mutations result in a free-energy decrease. An illustrative example of the mutational study is given in Fig. 6(a) for five core residues of protein 1KQ1A, considered in both the native and designed sequences. For either sequence, the five residues display very favorable packing interactions, since free energy is increased by all mutations except two (F10M and V39M) in the native sequence and all mutations except one (I39V) in the designed sequence. The free-energy decrease in such three cases is small, reaching at most 0.59 kcal/mol. On the other hand, the average free-energy increase over the five residues is 6.21 kcal/mol for the native sequence and 9.06 kcal/mol for the designed sequence, suggesting that the packing of side chains in the latter is more intolerant to mutations that might insidiously corrupt the stability of the protein structure. A central position in this system of five residues is occupied by residue 31 (Fig. 6(b)), which is an Isoleucine in the native sequence and a Methionine in the designed sequence. The fact that the average distance to the other four residues is lower for M31 (3.65 Å) than for I31 (3.77 Å) is indicative of a denser local packing around the former. This may help to understand why mutating M31 is less tolerated than mutating I31 (due to average free-energy increases of 8.78 kcal/mol and 6.11 kcal/mol, respectively). On average over the entire test set, the free-energy increase by point mutation is 47% more in the designed sequences than in the native sequences (4.02 kcal/mol versus 2.74 kcal/mol), and 24% more (7.87 kcal/mol versus 6.34 kcal/mol) if mutation is restricted to the core residues.
Figure 6.

Energetic and structural comparison between the native and designed hydrophobic cores of the pleiotropic translational regulator Hfq from Staphilococcus aureus (PDB ID: 1KQ1A), where the side-chain packing was predicted by SCWRL 22 on the target backbone for both the native sequence and the designed sequence. (a) FoldX free-energy variation undergone by the protein after the mutation of a single core residue into a different amino acid type. For each of the five mutated core residues, the free-energy variations caused by the 19 new amino acid types are plotted following the order specified at the top of the panel. (b) Stick representation of the five core residues described in (a) as packed in the native and designed sequences. Carbon atoms are depicted in green for the native sequence and in red for the designed sequence, while the unique sulphur atom is in yellow. The figure was produced by using PyMOL 44.
DISCUSSION
The design experiment and the I-TASSER-based structure prediction revealed that, for 40 out of 52 test proteins (i.e., 77%), at least one of the top 10 designed sequences (cluster tags) can fold into a structure at a backbone RMSD <2 Å to the target structure. Although the sequences designed in previous works have a higher native recapitulation than those reported here, and may also potentially fold into the target structure, this is the first report where the large-scale applicability of a protein design algorithm is supported by the structures predicted for the designed sequences.
Besides having a relatively low identity to the native sequence, our designed sequences are also characterized by an amino acid distribution that has a stronger preference to the hydrophobic residues. This is mostly due to the surface regions, where the native sequences have undergone strong evolutionary pressures for binding to specific polar/charged atoms in the ligand molecules. Our designed sequences, on the other hand, were free of such pressures, as the product of pure free-energy optimization for fold stabilization. The free energy of the designed sequences was consequently found to be dramatically lower than that of the native sequences. The optimized stability of our designed sequences may also be compatible to a sufficient level of solubility, since the free energy computed by FoldX does take into account the interactions of the protein with the solvent. Modeling these interactions, hence, may have enforced the conservation of enough hydrophilic residues on the surface (46%) to allow a native-like solubility.
Furthermore, an extensive in silico mutational study indicated that the point mutations that decrease free energy are much more frequent in the native sequences than in the designed sequences, confirming the clearly enhanced stability of the latter. Although such a large gap in stability may be indicative of a poor estimation of free energy by FoldX, the sheer number of designed sequences with a native-like I-TASSER model, guided by a completely different energy force field, suggests that the estimate is plausible. Free-energy minimization should be seen as a working paradigm for protein design not because the designed sequences have a high identity to the native sequence, but because they are likely to adopt the native fold with an even higher stability than the native sequence. Envisioning the use of our protein design algorithm in practical biotechnology scenarios, we therefore believe that the designed sequences predicted to adopt the target fold may at least provide stable low-resolution scaffolds which, in the presence of mutations in key residues, can acquire the desired functional properties.
Although our Monte Carlo optimization procedure can identify sequences with a very low free energy in the target structure, the FoldX function, like any function estimating free energy, is inevitably affected by approximation errors. As a corrective measure, our clustering procedure selects “consensus sequences” (the cluster tags) from ensembles of decoy sequences generated in multiple Monte Carlo free-energy minimization trajectories. Compared to a pure free-energy minimization, the clustering procedure improved the average RMSD to target of the I-TASSER models by 17%, when comparing the first cluster tag to the global free-energy minimum, and by 13%, when comparing the lowest-RMSD cluster tag to the lowest-RMSD run-local minimum. It should be acknowledged, however, that the algorithm as a whole owes its accuracy also to the free-energy minimization stage, which obtained an average RMSD to target of 4.08 Å for the global free-energy minimum, and of 2.01 Å for the lowest-RMSD run-local minimum.
Another strength of the algorithm is its easy reproducibility. Thanks to the public availability of both the SCWRL and FoldX executables, writing a basic procedure for Monte Carlo free-energy minimization is enough to accomplish the first stage of the algorithm, which, as discussed above, stands on its own as an effective protein design method. The clustering procedure, conceptually simple but quite laborious to tune and implement, is publicly available at our website http://zhanglab.ccmb.med.umich.edu/design. With respect to the use of SCWRL and FoldX, it must be pointed out that only the newest versions should be used; in the case of SCWRL, version 4.0 22 ensures that the side chains are produced in an acceptable amount of time, unlike version 3.0 33, which could take hours or even days of computation for a single sequence. Version 3.0b4 of FoldX 21 brought a dramatic improvement over version 2.5.2, under which our Monte Carlo free-energy minimization converged almost always to sequences containing long segments of Proline, possibly due to an error in the computation of the backbone entropy term. It may be that the abnormally high occurrence of Methionine in the present designed sequences is due to a similar though subtler artefact in version 3.0b4. Work on developing a sensitive physics-based potential combined with the knowledge-based terms from I-TASSER is in progress.
Most of the sequences designed by our algorithm are both highly compatible to the target structure, as shown by protein structure modeling, as well as more stable than the native sequences, as shown by the absolute free-energy values and by in silico point mutation, thereby demanding to be validated experimentally. Since the number of sequences to submit to synthesis and experimental structural characterization is heavily limited by the costs of such techniques, a careful selection among the cluster tags is urged. With coverage of 77% for the test proteins under a threshold of 2 Å, the first cluster tag represents a strong candidate for submission. However, the accuracy and confidence at which I-TASSER predicts protein structure encourage the submission of the cluster tag which I-TASSER predicts to fold closest to the target structure.
By means of state-of-the-art methods for protein structure prediction, the foldability of sequences produced by protein design may be estimated a priori at a coarse-grained level, serving at least as a filter against the poorly designed sequences for the more expensive experimental validation. The idea of using protein structure prediction to assist protein design is not new. For example, Baker and co-workers 9 reported the successful design of a new-fold protein, Top7, by the iterative coupling of sequence design and structure prediction, where the model predicted by Rosetta 34 on the final designed sequence is only 1.17 Å away from the crystal structure. In our case, however, the algorithm of structure prediction, including both the force field and the search engine, is completely different from the algorithm of design, a distinction that we believe is essential to avoid the danger of self-proof of the designed sequences. Following approaches like these, protein structure prediction is bound to become, through its constant improvement over time, an integral part of protein design.
All designed sequences and their I-TASSER models are publicly available at http://zhanglab.ccmb.med.umich.edu/design, which can serve as a control for the forthcoming experimental synthesis.
MATERIALS AND METHODS
The protein design algorithm
Our protein design algorithm consists of two stages; the first explores sequence space by carrying out 10 independent runs of 30,000 steps of a Metropolis Monte Carlo free-energy minimization procedure. The free energy of any candidate amino acid sequence is that computed on the target, rigid backbone by the FoldX (version 3.0b4) function 21, taking the side-chain conformations as predicted by SCWRL (version 4.0) 22. Starting from a random sequence, the Monte Carlo procedure mutates at each step a single amino acid type by selecting at random both the mutation position and the new amino acid type. Mutations are accepted according to the standard Metropolis rule 5, whereby an increase of free energy by Δis accepted with probability e−(Δ/T). The value of T was set at 0.3 because it had yielded a desirable acceptance rate, around 10%, in the training runs carried out to tune the algorithm.
The second stage of the algorithm involves the clustering of all the decoy sequences generated in the first stage. In essence, the clustering procedure implements in sequence space the SPICKER algorithm for clustering model protein structures 7. Central to the procedure is the notion of a distance between two sequences, defined by means of the BLOSUM62 substitution matrix 23. More precisely, if two sequences are assigned by the matrix a similarity score of b, equal to the sum of the substitution scores over all residue positions, then their distance for the purpose of clustering is defined as (ML−b)/(ML−mL); ML and mL denote, respectively, the maximum and minimum similarity scores for any two sequences of length L, so that the sequence distance is always a number between 0 and 1. The set of sequences to be clustered is built by picking one decoy sequence every 20 steps of each Monte Carlo run, for a total of 15,000 sequences, which is also close to the memory limit of our computer nodes.
To cluster the decoy set, our procedure works by iteratively identifying the sequence which has the most neighboring sequences. Two sequences are defined to be neighbors if their distance is less than some distance cutoff. This cutoff is initially set to zero, and then iteratively increased by a fixed amount. Upon each increase of the cutoff, the number of neighbors of each sequence is counted. When the sequence with the highest number of neighbors (seed) constitutes, together with them, >40% of all sequences, the increase of the cutoff terminates and cluster counting starts. At this point, the seed and its neighbors are identified as the first cluster of the set, with the seed being recorded as the “tag” of the cluster. All the sequences in the first cluster are then removed from the set. By using the same distance cutoff, the count of the neighbors is then repeated for the remaining sequences, to form the second cluster from the sequence with most neighbors. This scheme is repeated until all sequences in the initial set have been clustered or a maximum number of clusters (in this case 10) has been reached. Eventually, the tag of the first (and largest) cluster is returned as the most suitable sequence for the target backbone, while all other cluster tags may be regarded as plausible alternatives. We note that the 40% threshold for the size of the first cluster was chosen by optimizing the average TM-score of the I-TASSER models to the target structure. However, any threshold value between 10% and 60% generated similar TM-score results, demonstrating that the overall performance of our design algorithm is not sensitive to the choice of specific threshold values in this range.
I-TASSER protein structure assembly
I-TASSER is a hierarchical pipeline developed for protein structure prediction, which was ranked as the best automated method for protein structure prediction in the community-wide blind experiments of CASP7 19 and CASP8 20. A detailed description has been given in previous publications. Here, we provide an outline.
For a given target sequence, I-TASSER first threads it through a representative PDB structure library to search for possible template folds or supersecondary structure fragments using a profile–profile alignment based threading algorithm, MUSTER 36. The continuous fragments (with size >5 residues) are then excised from the threading aligned regions and used to assemble full-length models, while the unaligned regions are built by ab initio modeling. The protein conformation in the I-TASSER simulations is represented by a trace of Cα atoms and the side-chain centers of mass, and the reassembly process is conducted by a modified replica-exchange Monte Carlo algorithm 37. The structure trajectories are clustered by SPICKER 7 and cluster centroids are obtained by averaging the Cα-atom coordinates of all clustered structures. Because the cluster centroids generally have steric clashes and can be overly compressed 38, the TASSER structure reassembly is restarted from the cluster centroids obtained in the first round of the simulation. The spatial restraints used in the second round are taken from the centroid structures and from PDB structures that are identified by the structure alignment program TM-align 39. Finally, the lowest energy structure is selected and an all-atom model is constructed by REMO 40 through optimization of the hydrogen-bonding network. Here, it should be mentioned that none of the 52 testing proteins selected for this work (see next section) is homologous to any of the 200 training proteins which were used to optimize the I-TASSER force field 35.
Test protocol
We tested the protein design algorithm on a set of 52 proteins, selected from a predefined PISCES 41 list in which every protein has a structural resolution ≤1.6 Å and a sequence identity ≤30% to any other protein. The selected proteins divide into 12 α, 13 β, 19 α+β, 7 α/β, and 1 small. All test proteins are globular, since their well-formed hydrophobic core justifies the application of our free-energy minimization algorithm. Globularity was assessed by visual inspection of the fold, and any tails were removed where they were clearly external to the globule. The resulting lengths of the 52 proteins range from 51 to 149 residues. Depending on the protein size, a single Monte Carlo run took 10–80 hours on a 2.6-GHz CPU, while the time required by the clustering procedure was 5–15 minutes. For each protein, all cluster tags were first evaluated in terms of amino acid identity to the native sequence, computed over all residues as well as over the core residues only. We defined a residue to be a core residue if its relative solvent accessibility in the target structure was below 16% 42. For this purpose, the residue's absolute accessibility was computed by DSSP 43, while the maximum absolute accessibility for each amino acid type was taken from 42. The cluster tags were then submitted to I-TASSER for structure prediction. The comparison of the predicted model and the target structure was based on the RMSD over the backbone heavy atoms.
Mutational study on the native and designed sequences
For each native and each designed amino acid sequence, the study considered all possible point mutants obtained by replacing a single residue with a residue of a different amino acid type. Therefore, a sequence of n residues originated 19·n mutants. The FoldX free energy of any sequence — whether native, designed, or mutant — was computed on the target backbone with the side-chain conformations predicted by SCWRL. In the case of the native sequence, the SCWRL conformations were preferred over the native ones to allow a fairer estimation of the variation of free energy upon mutation. This is because the native sequence itself has a much lower free energy (i.e., by 0.30 kcal/mol·residue) with the native side-chain conformations than with those predicted by SCWRL, most likely because SCWRL is restrained to a finite set of rotamers. Using the native side-chain conformations in comparing the free energy of the native sequence against that of a mutant, therefore, would not have taken into account the background penalty, over all side chains, imposed by SCWRL to the mutant. Incidentally, the designed sequences, despite having their side-chain conformations computed by SCWRL, have a free energy that is much lower than that of the native sequences with native side-chain conformations, as seen in the Results section; this suggests that the designed sequences may potentially stabilize the target fold to a greater extent than reported in this work.
ACKNOWLEDGMENTS
We are grateful to the discussions with Dr. Yong Xiong and the critical reading of the manuscript by Dr. John Grime. The project is supported in part by the NSF Career Award (DBI 0746198), and the National Institute of General Medical Sciences (GM083107 and GM084222).
Footnotes
Publisher's Disclaimer: This is a PDF file of an unedited manuscript that has been accepted for publication. As a service to our customers we are providing this early version of the manuscript. The manuscript will undergo copyediting, typesetting, and review of the resulting proof before it is published in its final citable form. Please note that during the production process errors may be discovered which could affect the content, and all legal disclaimers that apply to the journal pertain.
Contributor Information
Andrea Bazzoli, Email: bazzoli@umich.edu.
Andrea G. B. Tettamanzi, Email: andrea.tettamanzi@unimi.it.
Yang Zhang, Email: zhng@umich.edu.
REFERENCES
- 1.Drexler KE. Molecular engineering: An approach to the development of general capabilities for molecular manipulation. Proc. Natl. Acad. Sci. U S A. 1981;78:5275–5278. doi: 10.1073/pnas.78.9.5275. [DOI] [PMC free article] [PubMed] [Google Scholar]
- 2.Pabo C. Molecular technology: Designing proteins and peptides. Nature. 1983;301:200. doi: 10.1038/301200a0. [DOI] [PubMed] [Google Scholar]
- 3.Alvizo O, Allen BD, Mayo SL. Computational protein design promises to revolutionize protein engineering. Biotechniques. 2007;42:31–39. doi: 10.2144/000112336. [DOI] [PubMed] [Google Scholar]
- 4.Voigt CA, Gordon DB, Mayo SL. Trading accuracy for speed: A quantitative comparison of search algorithms in protein sequence design. J. Mol. Biol. 2000;299:789–803. doi: 10.1006/jmbi.2000.3758. [DOI] [PubMed] [Google Scholar]
- 5.Metropolis N, Rosenbluth AW, Rosenbluth MN, Teller AH, Teller E. Equation of state calculations by fast computing machines. J. Chem. Phys. 1953;21:1087–1092. [Google Scholar]
- 6.Shortle D, Simons KT, Baker D. Clustering of low-energy conformations near the native structures of small proteins. Proc. Natl. Acad. Sci. U S A. 1998;95:11158–11162. doi: 10.1073/pnas.95.19.11158. [DOI] [PMC free article] [PubMed] [Google Scholar]
- 7.Zhang Y, Skolnick J. SPICKER: A clustering approach to identify near-native protein folds. J. Comput. Chem. 2004;25:865–871. doi: 10.1002/jcc.20011. [DOI] [PubMed] [Google Scholar]
- 8.Lorenzen S, Zhang Y. Identification of near-native structures by clustering protein docking conformations. Proteins. 2007;68:187–194. doi: 10.1002/prot.21442. [DOI] [PubMed] [Google Scholar]
- 9.Kuhlman B, Dantas G, Ireton GC, Varani G, Stoddard BL, Baker D. Design of a novel globular protein fold with atomic-level accuracy. Science. 2003;302:1364–1368. doi: 10.1126/science.1089427. [DOI] [PubMed] [Google Scholar]
- 10.Kuhlman B, Baker D. Native protein sequences are close to optimal for their structures. Proc. Natl. Acad. Sci. U S A. 2000;97:10383–10388. doi: 10.1073/pnas.97.19.10383. [DOI] [PMC free article] [PubMed] [Google Scholar]
- 11.Larson SM, Garg A, Desjarlais JR, Pande VS. Increased detection of structural templates using alignments of designed sequences. Proteins. 2003;51:390–396. doi: 10.1002/prot.10346. [DOI] [PubMed] [Google Scholar]
- 12.Saunders CT, Baker D. Recapitulation of protein family divergence using flexible backbone protein design. J. Mol. Biol. 2005;346:631–644. doi: 10.1016/j.jmb.2004.11.062. [DOI] [PubMed] [Google Scholar]
- 13.Ding F, Dokholyan NV. Emergence of protein fold families through rational design. PLoS Comput. Biol. 2006;2:e85. doi: 10.1371/journal.pcbi.0020085. [DOI] [PMC free article] [PubMed] [Google Scholar]
- 14.Dill KA. Dominant forces in protein folding. Biochemistry. 1990;29:7133–7155. doi: 10.1021/bi00483a001. [DOI] [PubMed] [Google Scholar]
- 15.Ventura S, Serrano L. Designing proteins from the inside out. Proteins. 2004;56:1–10. doi: 10.1002/prot.20142. [DOI] [PubMed] [Google Scholar]
- 16.Zhang Y. Progress and challenges in protein structure prediction. Curr. Opin. Struct. Biol. 2008;18:342–348. doi: 10.1016/j.sbi.2008.02.004. [DOI] [PMC free article] [PubMed] [Google Scholar]
- 17.Zhang Y. I-TASSER server for protein 3D structure prediction. BMC Bioinf. 2008;9:40. doi: 10.1186/1471-2105-9-40. [DOI] [PMC free article] [PubMed] [Google Scholar]
- 18.Roy A, Kucukural A, Zhang Y. I-TASSER: a unified platform for automated protein structure and function prediction. Nat. Protoc. 2010;5:725–738. doi: 10.1038/nprot.2010.5. [DOI] [PMC free article] [PubMed] [Google Scholar]
- 19.Battey JN, Kopp J, Bordoli L, Read RJ, Clarke ND, Schwede T. Automated server predictions in CASP7. Proteins. 2007;69 Suppl. 8:68–82. doi: 10.1002/prot.21761. [DOI] [PubMed] [Google Scholar]
- 20.Cozzetto D, Kryshtafovych A, Fidelis K, Moult J, Rost B, Tramontano A. Evaluation of template-based models in CASP8 with standard measures. Proteins. 2009;77 Suppl. 9:18–28. doi: 10.1002/prot.22561. [DOI] [PMC free article] [PubMed] [Google Scholar]
- 21.Guerois R, Nielsen JE, Serrano L. Predicting changes in the stability of proteins and protein complexes: A study of more than 1000 mutations. J. Mol. Biol. 2002;320:369–387. doi: 10.1016/S0022-2836(02)00442-4. [DOI] [PubMed] [Google Scholar]
- 22.Krivov GG, Shapovalov MV, Dunbrack RL., Jr Improved prediction of protein side-chain conformations with SCWRL4. Proteins. 2009;77:778–795. doi: 10.1002/prot.22488. [DOI] [PMC free article] [PubMed] [Google Scholar]
- 23.Henikoff S, Henikoff JG. Amino acid substitution matrices from protein blocks. Proc. Natl. Acad. Sci. U S A. 1992;89:10915–10919. doi: 10.1073/pnas.89.22.10915. [DOI] [PMC free article] [PubMed] [Google Scholar]
- 24.Koehl P, Levitt M. De novo protein design. II. Plasticity in sequence space. J. Mol. Biol. 1999;293:1183–1193. doi: 10.1006/jmbi.1999.3212. [DOI] [PubMed] [Google Scholar]
- 25.Kyte J, Doolittle RF. A simple method for displaying the hydropathic character of a protein. J. Mol. Biol. 1982;157:105–132. doi: 10.1016/0022-2836(82)90515-0. [DOI] [PubMed] [Google Scholar]
- 26.Spector S, Wang M, Carp SA, Robblee J, Hendsch ZS, Fairman R, Tidor B, Raleigh DP. Rational modification of protein stability by the mutation of charged surface residues. Biochemistry. 2000;39:872–879. doi: 10.1021/bi992091m. [DOI] [PubMed] [Google Scholar]
- 27.Dahiyat BI, Mayo SL. De novo protein design: Fully automated sequence selection. Science. 1997;278:82–87. doi: 10.1126/science.278.5335.82. [DOI] [PubMed] [Google Scholar]
- 28.Dobson N, Dantas G, Baker D, Varani G. High-resolution structural validation of the computational redesign of human U1A protein. Structure. 2006;14:847–856. doi: 10.1016/j.str.2006.02.011. [DOI] [PubMed] [Google Scholar]
- 29.Dantas G, Corrent C, Reichow SL, Havranek JJ, Eletr ZM, Isern NG, Kuhlman B, Varani G, Merritt EA, Baker D. High-resolution structural and thermodynamic analysis of extreme stabilization of human procarboxypeptidase by computational protein design. J. Mol. Biol. 2007;366:1209–1221. doi: 10.1016/j.jmb.2006.11.080. [DOI] [PMC free article] [PubMed] [Google Scholar]
- 30.Zhang Y. Template-based modeling and free modeling by I-TASSER in CASP7. Proteins. 2007;69 Suppl. 8:108–117. doi: 10.1002/prot.21702. [DOI] [PubMed] [Google Scholar]
- 31.Zhang Y. I-TASSER: Fully automated protein structure prediction in CASP8. Proteins. 2009;77:100–113. doi: 10.1002/prot.22588. [DOI] [PMC free article] [PubMed] [Google Scholar]
- 32.Needleman SB, Wunsch CD. A general method applicable to search for similarities in amino acid sequence of 2 proteins. J. Mol. Biol. 1970;48:443–453. doi: 10.1016/0022-2836(70)90057-4. [DOI] [PubMed] [Google Scholar]
- 33.Canutescu AA, Shelenkov AA, Dunbrack RL. A graph-theory algorithm for rapid protein side-chain prediction. Protein Sci. 2003;12:2001–2014. doi: 10.1110/ps.03154503. [DOI] [PMC free article] [PubMed] [Google Scholar]
- 34.Bonneau R, Tsai J, Ruczinski I, Chivian D, Rohl C, Strauss CEM, Baker D. Rosetta in CASP4: Progress in ab initio protein structure prediction. Proteins. 2001;45 Suppl. 5:119–126. doi: 10.1002/prot.1170. [DOI] [PubMed] [Google Scholar]
- 35.Wu S, Skolnick J, Zhang Y. Ab initio modeling of small proteins by iterative TASSER simulations. BMC Biol. 2007;5:17. doi: 10.1186/1741-7007-5-17. [DOI] [PMC free article] [PubMed] [Google Scholar]
- 36.Wu S, Zhang Y. MUSTER: Improving protein sequence profile–profile alignments by using multiple sources of structure information. Proteins. 2008;72:547–556. doi: 10.1002/prot.21945. [DOI] [PMC free article] [PubMed] [Google Scholar]
- 37.Zhang Y, Kihara D, Skolnick J. Local energy landscape flattening: Parallel hyperbolic Monte Carlo sampling of protein folding. Proteins. 2002;48:192–201. doi: 10.1002/prot.10141. [DOI] [PubMed] [Google Scholar]
- 38.Zhang Y, Arakaki AK, Skolnick J. TASSER: an automated method for the prediction of protein tertiary structures in CASP6. Proteins. 2005;61 Suppl. 7:91–98. doi: 10.1002/prot.20724. [DOI] [PubMed] [Google Scholar]
- 39.Zhang Y, Skolnick J. TM-align: a protein structure alignment algorithm based on the TM-score. Nucleic Acids Res. 2005;33:2302–2309. doi: 10.1093/nar/gki524. [DOI] [PMC free article] [PubMed] [Google Scholar]
- 40.Li Y, Zhang Y. REMO: A new protocol to refine full atomic protein models from C-alpha traces by optimizing hydrogen-bonding networks. Proteins. 2009;76:665–676. doi: 10.1002/prot.22380. [DOI] [PMC free article] [PubMed] [Google Scholar]
- 41.Wang GL, Dunbrack RL. PISCES: recent improvements to a PDB sequence culling server. Nucleic Acids Res. 2005;33:W94–W98. doi: 10.1093/nar/gki402. [DOI] [PMC free article] [PubMed] [Google Scholar]
- 42.Rost B, Sander C. Conservation and prediction of solvent accessibility in protein families. Proteins. 1994;20:216–226. doi: 10.1002/prot.340200303. [DOI] [PubMed] [Google Scholar]
- 43.Kabsch W, Sander C. Dictionary of protein secondary structure: Pattern-recognition of hydrogen-bonded and geometrical features. Biopolymers. 1983;22:2577–2637. doi: 10.1002/bip.360221211. [DOI] [PubMed] [Google Scholar]
- 44.Version 0.99. LLC: Schrödinger; The PyMOL molecular graphics system. [Google Scholar]