

Abstract
The presence of tumor cells entering vascular channels is a prognostic marker for many cancers, including endometrial carcinoma. Vascular invasion is considered to be an early step in the metastatic process and important for the progress of malignant tumors. Here, we investigated the gene expression patterns related to vascular involvement in 57 primary endometrial cancers, using DNA microarray and quantitative PCR techniques. A vascular invasion signature of 18 genes was significantly associated with patient survival and clinicopathological phenotype. Vascular involvement was also related to gene sets for epithelial-mesenchymal transition, wound response, endothelial cells, and vascular endothelial growth factor (VEGF) activity. With immunohistochemical validation, both collagen 8 and matrix metalloproteinase 3 (MMP3) were associated with vascular invasion, whereas ANGPTL4 and IL-8 were associated with patient survival. Our findings indicate that vascular involvement within primary tumors is associated with gene expression profiles related to angiogenesis and epithelial-mesenchymal transition. These data could contribute to an improved understanding of potential targets for metastatic spread and may provide clinically important information for better management of endometrial cancer.
Invasion and metastatic spread are important for the progress of malignant tumors,1 and the occurrence of metastases represents an advanced stage of most cancers. The presence of vascular invasion (ie, tumor cells entering vascular channels as demonstrated by microscopic examination of the primary tumor) has been a strong prognostic factor in studies of various malignant tumors, including breast cancer, prostate cancer, endometrial cancer, and cutaneous melanoma.2–5 Vascular invasion is regarded as an indicator of metastatic spread evident in the primary tumor.6 Less is known about the molecular pathogenesis and characteristics of these early steps of metastatic dissemination.
We recently found that vascular invasion by tumor cells in endometrial cancer was associated with features of aggressive tumors and reduced survival, as shown by multivariate prognostic analysis.7 We then showed that vascular invasion was more frequent in tumors with an activated angiogenesis and less mature tumor vessels.8 Our findings support a relationship between active angiogenesis, immature vessels, and metastatic spread in these malignant tumors.
In the present study, tissues from primary endometrial cancers were examined for differential gene expression according to their status of vascular involvement. Although studies of various tumors have reported gene signatures related to the presence of metastases,9 the idea of vascular invasion representing a morphological marker of metastatic spread has received little attention. We here present novel data indicating that vascular involvement within primary tumors is associated with certain gene expression profiles related to angiogenesis and epithelial-mesenchymal transition, and the findings indicate that individual markers are involved in this process, including ANGPTL4, collagen VIII (COL8), matrix metalloproteinase 3 (stromelysin 1, progelatinase) (MMP3), and IL-8. Our data might contribute to an improved understanding of targets for metastatic spread and may provide clinically important information for better management of endometrial cancer.
Materials and Methods
Patient Series
Microarray and quantitative PCR (qPCR) experiments were performed on a prospectively collected test series of fresh-frozen specimens. Clinicopathological correlates and outcome were also studied in a retrospective validation series.10
Series I-Prospective Tests
During the years 2001 to 2003, 57 cases of endometrial cancer (median age 63.0 years) were prospectively collected at the Department of Gynecology and Obstetrics, Haukeland University Hospital, University of Bergen, Norway. Patients were treated with hysterectomy and salpingo-oophorectomy. Fresh tumor tissue was carefully dissected from the surgical specimens and divided into two: one part was immediately frozen in liquid nitrogen and stored at −80°C for later use; the other half was fixed in formalin for histology. The 57 samples studied were selected at random from a population-based tissue bank of gynecologic cancers with tumor purity ensured to be ≥50% (and >80% neoplastic tissue in the majority of cases).
Series II-Retrospective Validation
A population-based series including all 316 cases of endometrial carcinoma diagnosed in Hordaland County (∼450,000 inhabitants, or 10% of the total Norwegian population) during the years 1981–1990 was used for validation. Of the 316 cases, 12 were excluded because of changed diagnosis at reclassification and 5 because of a diagnosis based on cytology only. Of the remaining 299 cases, paraffin blocks from the primary tumor were available in 286 cases. There was no significant difference in the distribution of clinicopathological variables between series I and II.
Pathology
The following histological variables were included for both series: histological type of primary tumor, histological grade (FIGO), presence of vascular invasion, tumor necrosis, number of mitoses, progesterone and estrogen receptor status, and presence of metastasis. Lymphocytic invasion around vessels at the periphery of the tumor was also recorded.8 Presence of tumor cells within vascular spaces was examined on standard H&E sections as previously described.4 Vascular invasion was considered present when more than one space was occupied by tumor cells; no spaces or a single space occupied was recorded as no vascular invasion.
Follow-Up
For series I, patients were followed from the time of primary surgery until June 2007 or death. Median follow-up time for survivors was 3.6 years (range, 0.8–5.5 years). All events (14 recurrences, 7 deaths from cancer) were recorded; deaths due to other causes were censored. No patient was lost to follow-up. For series II, patients were followed from the time of primary surgery until death or last follow up as of August 2004. Median follow-up time for survivors was 17 years (range, 10–23 years); 74 patients died from endometrial cancer.
Microarray Analysis
Total RNA was isolated from tumor samples as previously described.10 T7 RNA polymerase promoter containing cDNAs and Cy3- and Cy5-labeled cRNAs were generated and hybridized to Agilent 21k and 22k microarrays (Agilent Technologies, Santa Clara, CA).10–12 Generation of Cy3 cRNA targets from human umbilical vein endothelial cell (HUVEC) and human dermal microvascular cell (HMVEC) total RNAs and Cy5 cRNA reference targets from Stratagene universal RNA (Stratagene, La Jolla, CA) and hybridization using human 44k whole-genome microarrays (G4112; Agilent Technologies) were done as previously described.13 Microarrays were scanned and features were extracted using the Agilent microarray scanner bundle.
Data including foreground and background intensity for microarray spots were processed using the J-Express software.14 For each spot the background corrected intensity value for each channel (Cy5, Cy3) was calculated. The lowess method15 was used to correct for dye-specific effects, under the assumption that most genes would have unchanged expression levels. Filtration was done as previously described,11 and missing values were estimated and inserted using the LSimpute_adaptive method.16 Batch adjustment was also performed.17
Cross-Validation
The Leave One Out Cross-Validation (LOOCV) method was used to test the predictability of presence (VI+) or absence (VI−) of vascular invasion, using all except one sample for training data in each round. In this method, a subset of genes is selected to maximize the possibility of discriminating the two groups, based on the training samples. Thus, the gene set is not fixed, but changes each round, based on which samples are left out. The classifier is tested on the one remaining patient, and the result (VI+ or VI−) is compared with the true status. The selected genes were used in a diagonal linear discriminant model for prediction. To test prediction accuracy achieved against pure chance, a permutation test was performed, in which labels (VI+ or VI−) were randomly permuted 1000 times, and subsequently LOOCV was performed for each label permutation. The results were compared with those obtained with the original labeling to estimate the significance of the result.
Differential Gene Expression
The significance analysis of microarrays (SAM) method18 was applied to look for differential expression between samples labeled vascular invasion positive (VI+) and negative (VI−), with an additional requirement of at least twofold change between the categories.
The PANTHER gene expression tool (http://www.pantherdb.org/tools/)was applied to map and correlate gene sets with molecular functions, biological processes, and biological pathways.19,20 A minimum fold change (FC) of 1.5 and a false discovery rate (FDR) of <25% regarding vascular invasion yielded 127 up-regulated and 92 down-regulated genes; these were used for PANTHER analysis. Groups with P values of <0.0001 were considered significant.
Gene Set Enrichment Analysis (GSEA) is a computational method that determines whether an a priori defined set of genes shows statistically significant, concordant differences between two biological states.21 The whole dataset was used for this analysis.
Predictor for Vascular Invasion Using a Fixed Gene Set
Given the differentially expressed genes from the SAM analysis, the option of using a predictor with a fixed gene set that does not change over cross-validation rounds was investigated. Thus, cross-validation was performed with the fixed list of genes from SAM. Additionally, a condensed predictor was constructed from the SAM genes to investigate if better prediction could be obtained with fewer genes in the model. Here, two techniques from machine learning were applied: forward selection and backward elimination.22 Cross-validation was then performed with the condensed gene set. A diagonal linear discriminant was used as the prediction model. Because the gene sets were fixed during cross-validation, and all samples were included when selecting the predictor gene set, the prediction error rate estimates are somewhat optimistic. To obtain unbiased estimates of prediction error, the predictors have to be tested on independent samples not included in the selection of genes.
Clustering of Samples Using Thematic Gene Sets
Gene sets that have been related to angiogenesis were mapped to our dataset. Specifically, the wound response signature23 was included, with 389 genes in common, and the endothelial signature as reported by Ho et al24 in their Table 1 was also mapped, yielding 28 genes in common. Because the endothelial signature had relatively few genes in our dataset, this signature was expanded by including genes with a significant correlation (r > 0.65) to 1 of the 28 signature genes, resulting in a final expanded signature of 468 genes.
Table 1.
Clinicopathologic Characteristics According to Vascular Invasion in 57 Endometrial Carcinomas from which Fresh Tissues Were Prospectively Collected
| Variables | VI negative, no. (%) | VI positive, no. (%) | P value⁎ |
|---|---|---|---|
| Histologic type | 0.017 | ||
| Endometrioid | 34 (97) | 17 (77) | |
| Non-endometrioid | 1 (3) | 5 (23) | |
| Histologic grade | <0.001 | ||
| Grades 1 and 2 | 33 (94) | 11 (50) | |
| Grade 3 | 2 (6) | 11 (50) | |
| Necrosis | <0.001 | ||
| Absent | 20 (57) | 2 (9) | |
| Present | 15 (43) | 20 (91) | |
| Mitoses† | NS‡ | ||
| Low | 28 (80) | 14 (64) | |
| High | 7 (20) | 8 (36) | |
| ER | 0.269 | ||
| Positive | 27 (77) | 14 (64) | |
| Negative | 8 (23) | 8 (36) | |
| PR | 0.053 | ||
| Positive | 30 (86) | 14 (64) | |
| Negative | 5 (14) | 8 (36) | |
| FIGO stage | 0.009 | ||
| I/II | 33 (94) | 15 (68) | |
| III/IV | 2 (6) | 7 (32) |
ER, estrogen receptor; PR, progesterone receptor; FIGO, International Federation of Gynecology and Obstetrics; NS, no significant difference.
Pearson's chi-square test.
Median value used as cutpoint.
No significant difference between VI+ and VI− patients.
Because vascular invasion is related to the epithelial-mesenchymal transition, known to be induced by tumor growth factor β (TGF-β), which is also related to ANGPTL4, two gene sets related to TGF-β signaling were included: a TGF-β response signature reported by Padua et al25 (153 genes) and a 217-gene TGF-β signature (Ambion GeneAssist pathway atlas; Applied Biosystems, Austin, TX). Mapping was done using gene symbols and gene ID, and 121 and 163 common genes, respectively, were found.
We studied the 13 genes in a VEGF-related gene signature published by Hu et al26 that are highly expressed in patients with distant breast cancer metastasis, compared with patients with primary tumors only; all 13 genes were identified, including ANGPTL4 in duplicate. An average expression value across the 13 genes [RRAGD, FABP5, UCHL1, GAL, PLOD1 (previously PLOD), DDIT4, VEGFA (previously VEGF), ADM, ANGPTL4, NDRG1, PNP (previously NP),SLC16A3, and FLVCR2 (previously C14orf58)]was calculated for each patient and divided into two groups with high and low expression by the median value.
Samples were clustered (unsupervised hierarchical clustering, weighted average linkage WPGMA, Pearson's correlation) based on the expression levels of the signature genes. The resulting clusters of samples were tested for associations with vascular invasion status.
PCR Quantification of Gene Expression Associated with Vascular Invasion
For a TaqMan low-density array (Applied Biosystems, Foster City, CA), qPCR confirmation genes (87 genes in addition to controls) and candidate genes significantly up-regulated or down-regulated in relation to vascular invasion (from SAM; n = 30) were included and were combined with 57 hypothesis-based genes related to angiogenesis and invasion. From a base of 300 genes compiled from the literature, hypothesis-based genes were selected based on their overall associations in our dataset (series I) with five basic clinicopathological variables: vascular invasion, mitosis, tumor cell necrosis, FIGO stage, and metastatic phenotype (ranked by the combined P value, a product of individual P values).
For TaqMan low-density array, a 384-well microfluidic card was constructed with two control genes [GAPDH (assay ID Hs99999905_m1) and ACTB (assay ID Hs99999903_m1)] and selected candidate genes, all in duplicate. cDNA synthesis and PCR protocols were performed as previously described.17 SDS2.2 software (Applied Biosystems) was used for analysis of the qPCR data. Data were imported to J-Express, and genes significantly related to vessel invasion (t-test, P < 0.05; fold change ≥ 2.0) were used for further studies. A summary score of the vascular invasion signature was obtained as the sum of normalized expression values for up-regulated genes with subtraction of corresponding values for down-regulated genes: signature summary score = Σ up-regulated genes − Σ down-regulated genes.
Immunohistochemistry
Staining was performed on 5-μm sections of paraffin-embedded tissues, using either regular slides or tissue microarray slides.27 Staining was performed with antibodies against ANGPTL4, collagen VIII, MMP3, IL-8, and N-cadherin. (For immunohistochemical protocols, see Supplemental Table S1 at http://ajp.amjpathol.org.)
Tissue microarray slides were evaluated in a standard light microscope for immunohistochemical staining (by M.M., I.M.S., H.B.S.). Cytoplasmic staining intensity in tumor cells (grades 0–3) and staining area (0, no tumor cells positive; 1, <10%; 2, 10%–50%; 3, >50%) were determined and multiplied, giving a staining index with scores 0–9.28 Cases were divided into two or four subgroups based on median or quartiles for staining index and also considering the size of these subgroups, number of events, and survival similarities. Regular slides were evaluated in a standard light microscope (by M.M., L.A.A.). The invasive tumor front was examined, and staining intensity in endothelial cells and tumor stroma was considered. Two categories were compared: cases with vascular invasion and lymphocytes around vessels (n = 20), and cases without such alterations (n = 20).
Western Blot
Western blotting was used to examine the specificity of the antibodies as described earlier29 Primary antibodies were diluted in non-fat 5% dry milk:ANGPTL4 1:500, collagen 8 1:500, IL-8 1:75, MMP3 1:50; incubation for 1 hour at room temperature. Secondary antibodies were diluted in non-fat dry milk: Envision rabbit 1:500 against ANGPTL4 and collagen 8 (Dako, Glostrup, Denmark), Envision mouse 1:500 against MMP3, and PowerVision poly-GRP anti-goat IgG (ImmunoVision, Springdale, AR) 1:100 against IL-8.
Cell-Line Studies
Endometrial cancer cell lines KLE, RL95-2, AN3 CA, and HEC-1-A (American Type Culture Collection, ATCC, Manassas, VA) and MFE-280, MFE-296, and EFE-184 (German Collection of Microorganisms and Cell Cultures, DSMZ, Braunschweig, Germany) were grown in recommended media supplemented with 2 mmol/L L-glutamine and 1× penicillin-streptomycin-amphotericin B. Conditioned media were collected after 18 hours incubation (37°C, 5% CO2) in basal medium EBM-2 (Lonza, Allendale, NJ), and the medium was cleared by centrifugation. HUVEC and HMVEC cells (Lonza) were grown in EGM-2 and EGM-2MV media (Lonza), respectively, to subconfluence. Cells were then exposed to conditioned medium and nonconditioned medium (control) for 18 hours (37°C, 5% CO2). Cells were harvested using 350 μL TRK lysis buffer per well (E.Z.N.A. gel extraction kit;Omega Bio-Tek, Norcross, GA). Total RNA was purified in accordance with the manufacturer's manual (E.Z.N.A. total RNA kit I; Omega Bio-Tek).
Statistical Analysis
Statistical analyses were performed with the PASW statistical software package version 17 (SPSS, Chicago, IL). Associations between different categorical variables were assessed by Pearson's χ2 test or Fisher's exact test. Correlations between two continuous variables are given by Pearson's correlation coefficient and between a categorical and a continuous variable by Spearman's correlation coefficient. Kappa-statistics was used for interobserver reproducibility. Univariate survival analyses were performed using the Kaplan-Meier method (log-rank significance test). Vascular invasion and standard clinicopathological variables and biological markers were examined by log-log plot to determine how these variables could be incorporated in multivariate survival analysis using Cox' proportional hazards regression models (likelihood ratiosignificance test).
Results
Vascular Invasion Is Associated with Aggressive Subgroups of Endometrial Carcinoma
Vascular invasion (ie, the presence of tumor cells in vascular channels) was observed in 22 of 57 cases in our prospective series (series I) (39%). This feature was associated with characteristics of aggressive tumors, such as nonendometrioid histological type (P = 0.017), high histological grade (P < 0.001), presence of tumor necrosis (P < 0.001), and advanced tumor stage by FIGO classification (P = 0.009) (Table 1). Vascular invasion was also associated with decreased patient survival (log-rank test, P = 0.028) (Figure 1A). These findings were confirmed in a separate and independent validation series of 286 cases (series II) (see Supplemental Table S2 at http://ajp.amjpathol.org); vascular invasion was present in 36% of cases and was strongly associated with reduced patient survival (Figure 1B). Furthermore, vascular invasion was associated with the presence of perivascular lymphocytic infiltration (P < 0.001).
Figure 1.
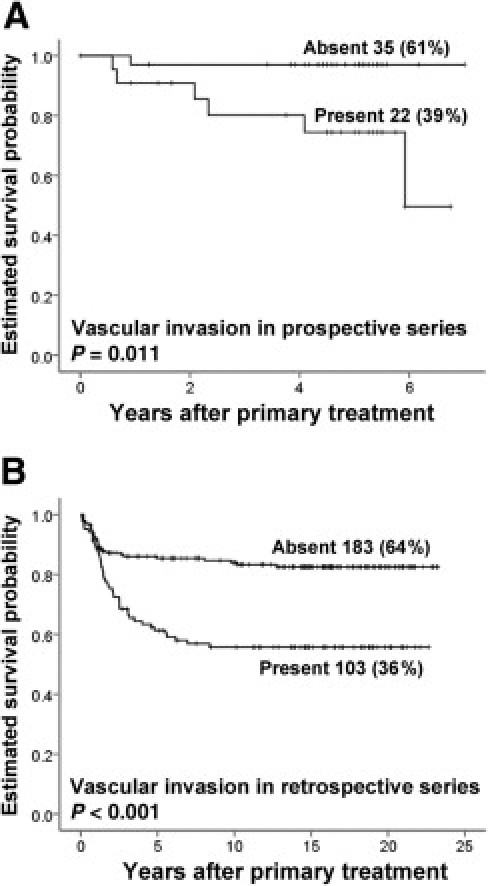
Estimated survival probability based on absent or present vascular invasion. A: In a prospective test series, 57 tumors from endometrial cancer patients were used for gene expression studies. B: In a retrospective validation series, 286 patients were used. Survival curves were estimated using the Kaplan-Meier method and log-rank significance test.
Vascular Invasion Is Associated with Differential Gene Expression and Is Predicted by Condensed Gene Signatures
Based on microarray data (series I), cross-validation (by LOOCV) indicated a correct prediction of vascular invasion status (VI+ versus VI−) for 72% of the samples (P = 0.016 by permutation tests).
Differential gene expression by SAM with respect to vascular invasion indicated that 26 genes were significantly up-regulated in VI+ cases and 9 genes were down-regulated (cutoff value 2.0 for FC = 2.0; FDR = 24.8%) (see Supplemental Table S3 at http://ajp.amjpathol.org). For these 35 genes, the correct classification was 77%. A condensed gene predictor of 15 of the 35 genes gave 84% correct prediction, and a signature of 5 of the 15 genes (ALDH1A2, CAPN13, I_963021, ANGPTL4, and GALNTL1) gave 86% correct prediction (see Supplemental Table S4 at http://ajp.amjpathol.org). Microarray data for these predictors were confirmed by qPCR (data not shown).
A total of 87 candidate genes were analyzed by qPCR using the TaqMan low-density array format, with 96 TaqMan low-density array positions: 30 genes from the SAM list (from 35 different gene assays) and 57 hypothesis-based and angiogenesis-related candidate genes compiled from the literature and ranked by combined P value for vascular invasion, mitosis, tumor cell necrosis, FIGO stage, and metastatic phenotype (two control positions) (see Supplemental Table S5 at http://ajp.amjpathol.org). Genes (n = 18) with differential expression (P < 0.05; FC ≥ 2.0, SAM) in relation to vascular invasion are listed in Table 2 (7 up-regulated, 11 down-regulated). By hierarchical clustering (Pearson's correlation and weighted average linkage WPGMA), two resulting clusters, A and B, were significantly associated with vascular invasion (P = 0.038) (Figure 2A). For this 18-gene signature, microarray data and qPCR data were significantly correlated (r = 0.93) (Figure 2B). Using qPCR-based data (normalized by GAPDH), condensed gene predictors were examined, and a three-gene signature (ALDH1A2, CAPN13, and ANGPTL4) gave 77% correct prediction.
Table 2.
Vascular Invasion Signature Consisting of the 7 Most Up-regulated and 11 Most Downregulated Genes Differentially Expressed (P > 0.05) in Relation to Vascular Invasion and with a Minimum Fold Change of 2.0
| Gene symbol⁎ | Fold change | Gene name⁎ |
|---|---|---|
| MMP3† | 4.6 | Matrix metallopeptidase 3 (stromelysin 1, progelatinase) |
| TNFAIP6 | 2.6 | Tumor necrosis factor, alpha-induced protein 6 |
| FPR2 | 2.6 | Formyl peptide receptor 2 |
| IL8 | 2.2 | Interleukin 8 |
| ANGPTL4 | 2.1 | Angiopoietin-like 4 |
| SERPINE1 | 2.0 | Serpin peptidase inhibitor, clade E (nexin, plasminogen activator inhibitor type 1), member 1 |
| COL8A1† | 2.0 | Collagen, type VIII, alpha 1 |
| OGN | −6.3 | Osteoglycin |
| ATCAY† | −5.3 | Ataxia, cerebellar, Cayman type |
| MAMDC2 | −4.7 | MAM domain containing 2 |
| COL4A6 | −3.9 | Collagen, type IV, alpha 6 |
| C1orf114 | −3.4 | Chromosome 1 open reading frame 114 |
| KLHL13 | −3.4 | Kelch-like 13 (Drosophila) |
| OSR2 | −3.2 | Odd-skipped related 2 (Drosophila) |
| ALDH1A2 | −2.8 | Aldehyde dehydrogenase 1 family, member A2 |
| SEMA5A† | −2.3 | Sema domain, seven thrombospondin repeats (type 1 and type 1-like), transmembrane domain (TM) and short cytoplasmic domain, (semaphorin) 5A |
| FGFR2† | −2.2 | Fibroblast growth factor receptor 2 |
| ITIH5† | −2.1 | Inter-alpha (globulin) inhibitor H5 |
Gene symbols and names are according to the HUGO Gene Nomenclature Committee database (http://www.genenames.org).
Hypothesis-based genes (from the literature); other genes were generated from microarray experiments.
Figure 2.

A: Unsupervised hierarchical clustering was done on the vascular invasion signature with Pearson correlation and average linkage (WPGMA). Two main clusters, A and B, were formed. Distribution of different clinicopathological features between the clusters is shown in the panel below the heat map. MGC10848 is an alias for ITIH5, KIAA1872 is an alias for ATCAY, and FPRL1 is an alias for FPR2 (as in Table 2). B: A summary score for the vascular invasion signature was based on microarrays and qPCR normalized expression data. Good correlation is seen between the two methods. C: The vascular invasion signature was significantly associated with decreased patient survival (Kaplan-Meier method, log-rank test).
By univariate survival analysis, the vascular invasion score of the 18-gene signature (two subgroups by upper quartile) was associated with patient survival (Figure 2C), as were vascular invasion (P < 0.001), higher histological grade (P = 0.001), tumor necrosis (P < 0.001), lack of estrogen receptor expression (P = 0.05), and high FIGO stage (P = 0.03) (Table 3). By multivariate survival analysis, the vascular invasion signature did not achieve independent prognostic importance, compared with standard clinicopathological factors such as histological type, histological grade (FIGO), and FIGO stage (data not shown).
Table 3.
Validation by qPCR of Expression Levels for the 18 Gene Signature for Vascular Invasion in Relation to Clinicopathologic Characteristics
| Variables | VI signature |
P value⁎ | |
|---|---|---|---|
| Low, no. (%) | High, no. (%) | ||
| Vascular invasion | <0.001 | ||
| Absent | 33 (94) | 2 (6) | |
| Present | 10 (45) | 12 (55) | |
| Histologic type | NS | ||
| Endometrioid | 40 (78) | 11 (22) | |
| Non-endometrioid | 3 (50) | 3 (50) | |
| Histologic grade | 0.001 | ||
| Grades 1 and 2 | 38 (86) | 6 (14) | |
| Grade 3 | 5 (38) | 8 (62) | |
| Necrosis | <0.001 | ||
| Absent | 22 (100) | 0 (0) | |
| Present | 21 (60) | 14 (40) | |
| ER | 0.047 | ||
| Positive | 34 (83) | 7 (17) | |
| Negative | 9 (56) | 7 (44) | |
| PR | 0.064 | ||
| Positive | 36 (82) | 8 (18) | |
| Negative | 7 (54) | 6 (46) | |
| FIGO stage | 0.032 | ||
| I/II | 39 (81) | 9 (19) | |
| III/IV | 4 (44) | 6 (56) | |
ER, estrogen receptor; FIGO, International Federation of Gynecology and Obstetrics; NS, no significant difference; PR, progresterone receptor; VI, vascular invasion.
Fisher's exact test.
Vascular Invasion Is Associated with Other Biological Processes
By association with vascular invasion status (FC ≥ 1.5, FDR < 25%), 127 up-regulated and 92 down-regulated genes were included. Using PANTHER classification, up-regulated genes were associated (P < 0.0001) with the following biological processes: immunity and defense, cell communication, signal transduction, macrophage-mediated immunity, and ligand-mediated signaling.
GSEA applied on the whole dataset (1000 permutations, FDR < 25%) indicated that up-regulated genes were associated mainly with cytokine pathways. No significant associations were revealed for down-regulated genes.
Vascular Invasion Is Associated with Expression of Endothelial and Angiogenesis-Related Genes
From mapping known endothelium-related genes24 to our data, 28 genes were selected. With unsupervised hierarchical clustering, there was a significant association with vascular invasion status (Fisher's exact test, P = 0.012) (Figure 3A), indicating a relationship between endothelial gene expression and vascular invasion. To increase robustness, the 28-gene signature was expanded with genes having 0.65 or more in positive or negative correlation to at least one of the 28 signature genes. By hierarchical clustering, this expanded signature (468 genes) was significantly associated with vascular invasion (Fisher's exact test, P = 0.0315) (Figure 3B).
Figure 3.

Clustering of tumors with (red) and without (pink) vascular invasion using the endothelial signature of 28 genes (A), the expanded endothelial signature of 468 genes (B), the wound response signature of 389 genes (C), the combined signature of these 834 unique genes (D), the TGF-β response signature of 121 genes (E), and the TGF-β pathway of 163 genes (F).
By mapping the wound response signature published by Chang et al23 to our data, 389 genes were selected. Subgroups from hierarchical clustering were significantly associated with vascular invasion (Fisher's exact test, P = 0.012) (Figure 3C). After we combined endothelium-related and wound response genes (n = 834 unique genes), subgroups from hierarchical clustering were significantly associated with vascular invasion status (P = 0.004) (Figure 3D).
Both the TGF-β response signature (121 genes) published by Padua et al25 and the TGF-β pathway from the GeneAssist pathway atlas (163 genes) were significantly associated with vascular invasion by hierarchical clustering (P = 0.004 and P = 0.001, respectively) (Figure 3, E and F).
An average expression value was calculated for the 13-gene VEGF signature published by Hu et al,26 and patients were divided into two groups according to median value. High expression of this VEGF signature was associated with vascular invasion (P = 0.007), nonendometrioid tumor subtype (P = 0.01), histological grade 3 (P < 0.001), tumor necrosis (P = 0.01), estrogen and progesterone receptor negativity (P = 0.003 and 0.03, respectively), and FIGO stage III/IV (P = 0.01) (data not shown). Notably, the VEGF signature was significantly correlated with our 18-gene vascular invasion score (Pearson correlation, r = 0.74; P < 0.001). Patients with high VEGF signature score indicated worse patient survival by univariate analysis (log-rank test, P = 0.06) (Figure 4). By multivariate analysis, no independent significance was achieved for the VEGF signature compared with standard clinicopathological factors such as histological type, histological grade (FIGO), and FIGO stage (data not shown).
Figure 4.

An average expression value was calculated for the 13-gene VEGF signature, and two subgroups were obtained by the median value. Patients with a high VEGF signature score exhibited a worse prognosis than those with a low signature score.
Expression of Candidate Markers in Relation to Vascular Invasion and Clinicopathological Phenotype
Up-regulated genes (based on qPCR data) were selected for validation at protein level in a retrospectively collected and independent series (series II). Commercial antibodies were examined by Western blotting for specificity, for all seven up-regulated genes: MMP3, FPR2 (alias FPRL1), TNFAIP6, ANGPTL4, SERPINE1, IL8, and COL8A1. Specificity was indicated for ANGPTL4, collagen VIII (COL8), IL-8, and MMP3 antibodies. For ANGPTL4, two distinct bands were seen, corresponding to the two known isoforms (Figure 5A). Whereas the epitopes for the antibody and microarray probe are located toward the carboxyl terminal end of the protein and gene (aa 222–367, corresponding to exons 5, 6, and 7 for the antibody and exon 7 for the probe), the position for the primers and probes for qPCR is located in the beginning of the reading frame (exon junction 1–2). For ANGPTL4, primers, probes, and the antibody detect both isoforms. Cytoplasmic tumor cell expression of these markers was examined using tissue microarray slides (series II; n = 286).
Figure 5.

A: Western blot analysis supported specificity of ANGPTL4 antibody showing two splice variants. B: Estimated patient survival according to ANGPTL4 protein expression in tumor cells using our validation series (series II) (log-rank significance test). In representative micrographs, endometrial cancer exhibits positive (C) and negative (D) ANGPTL4 protein expression (samples from two different cases). Original magnification, ×400.
ANGPTL4
A small subgroup (5.8%) of the tumors showed weak or no expression of ANGPTL4 protein in tumor cells (staining index, 0–2), and this was significantly associated with markedly reduced survival by univariate analysis (log-rank test, P < 0.001) (Figure 5, B–D). Endothelial cells at the invasive tumor front, stromal tissue, and inflammatory cells were negative (examined on regular slides). When we considered individual levels of expression according to the staining index (values of 0–9), successively reduced survival was seen with weaker expression in tumor cells (see Supplemental Figure S1 at http://ajp.amjpathol.org). ANGPTL4 protein expression was not associated with mRNA values (by microarray or qPCR) (Spearman's rank correlation, P = 0.7 for both), whereas microarray and qPCR data were significantly correlated (Pearson correlation 0.57, P > 0.001). By multivariate analysis, weak ANGPTL4 staining (staining index, 0–2) showed an independent prediction of reduced patient survival (hazard ratio HR = 2.9; P = 0.002) in addition to histological grade (HR = 3.3 for grade 3, P < 0.001) and FIGO stage (HR = 7.7 for stage III/IV, P < 0.001), whereas histological type was not significant. Among endometrioid carcinomas, ANGPTL4 was still significant (HR = 3.2, P = 0.01), in addition to histological grade and FIGO stage.
Endothelial cells (HUVEC and HMVEC) were incubated in vitro with conditioned medium from seven different endometrial cancer cell lines. All HMVEC cultures showed an increased ANGPTL4 mRNA expression (based on microarrays) compared with untreated HMVEC cells, but this was not apparent for HUVEC cells (see Supplemental Figure S2A at http://ajp.amjpathol.org).
MMP3 and COL8
Based on median staining index, MMP3 and COL8 were divided into two subgroups, with high and low expression. These markers were significantly coexpressed in tumor cells (P < 0.0001), and increased tumor cell expression of both MMP3 (P = 0.05) and COL8 (P < 0.001) was associated with vascular invasion, validating our gene expression data. MMP3 and COL8 were significantly associated with increased expression of VEGF-C and bFGF in tumor cells (data not shown). Also, perivascular lymphocytic infiltration was associated with increased tumor cell expression of MMP3 (P = 0.011) and COL8 (P = 0.03). Regarding clinicopathological features, MMP3 was associated with less differentiated tumors and solid growth, whereas COL8 expression was associated with high histological grade, solid tumor growth, and myometrial infiltration (data not shown).
Expression of MMP3 in endothelial cells in vessels at the invasive tumor front (using regular slides) was significantly increased in cases with vascular invasion (P < 0.001).
Endothelial cells (HUVEC and HMVEC) were incubated in vitro with conditioned medium from seven different endometrial cancer cell lines. Most HUVEC and HMVEC cultures exhibited increased MMP3 mRNA expression (based on microarrays), relative to untreated cells (see Supplemental Figure S2B at http://ajp.amjpathol.org). For COL8A1, no clear stimulation was observed (data not shown).
IL-8
Protein expression (three subgroups: weak, medium, and strong expression) was associated with patient survival (P = 0.004): cases with strong expression had the best patient survival (see Supplemental Figure S3 at http://ajp.amjpathol.org). Weak IL-8 staining showed association with high histological grade, solid tumor growth, high mitotic count, necrosis, and myometrial infiltration (data not shown). By multivariate analysis, no independent significance was found for IL-8 expression, compared with standard clinicopathological factors such as histological type, histological grade (FIGO), and FIGO stage (data not shown).
N-Cadherin
Previous results have shown E-cadherin, P-cadherin, and β-catenin to be associated with vascular invasion in this series.27 Here, membranous N-cadherin staining (presence or absence) was not associated with vascular invasion.
Discussion
In endometrial cancer, vascular invasion is a feature of more aggressive tumors and reduced probability of survival.4,30–32 In terms of tumor biology, invasion of tumor cells into vascular channels, already present in the primary tumor, is regarded as an indicator of metastatic spread. In the present study, we found that global gene expression differed significantly according to vascular invasion status. By qPCR, an 18-gene signature for vascular spread was significantly associated with clinicopathological phenotype and patient survival. Notably, vascular involvement was related to predefined gene sets for epithelial-mesenchymal transition, wound response, endothelial cells, and VEGF activity.23–26 Among individual genes associated with vascular invasion by mRNA level, the ANGPTL4, COL8A1, MMP3, and IL-8 genes have been related to vascular biology, invasive properties, and matrix remodeling.25,33–35 The present study indicates that these markers might be involved in vascular invasion and metastatic spread.
We have previously reported that vascular invasion is strongly connected with two important features of active angiogenesis, vascular proliferation and the presence of immature vessels.8 Our present data support these findings by showing a significant relation between vascular invasion and the expression of endothelial genes and the wound response signature considered to reflect activated angiogenesis. In particular, a VEGF signature26 was associated with vascular invasion, as well as with the 18-gene vascular invasion signature, other features of aggressive tumors, and reduced survival. Taken together, these data support a relationship between active angiogenesis, stroma remodeling, and vascular spread as indicators of metastasis.
Activation of the epithelial-mesenchymal transition (EMT) in malignant tumors indicates increased invasive and migratory capacity of tumor cells. We here show that TGF-β-related gene signatures were significantly associated with vascular invasion. Previously, we had reported that the presence of a cadherin switch from E-cadherin to P-cadherin expression, as evidence of EMT, was strongly associated with vascular invasion, more aggressive tumors, and reduced survival.27 The present findings support involvement of EMT in vascular invasion and early metastatic spread in endometrial carcinomas.
Among individual markers related to vascular invasion in the present study, expression of MMP3 (stromelysin-1) has a known relationship with epithelial-mesenchymal transition.34,36,37 MMP3 might promote EMT by degradation of E-cadherin,38 and mammary epithelial cells such as SCp2 show loss of intact E-cadherin after MMP3 treatment, with down-regulation of epithelial markers, up-regulation of mesenchymal markers, and increased motility and invasiveness.37,39,40 Also, MMP3 has been found to trigger EMT and tumor progression in mouse models.41 As shown in the present study, vascular invasion was associated with increased MMP3 expression in both tumor cells and endothelial cells, possibly reflecting tumor-endothelial interactions. Other studies have indicated that MMP3 is active in disrupting vascular integrity, which could predispose for vascular invasion and dissemination.42 Our findings reflect the complex interactions between tumor cells and the microenvironment.
We found that vascular invasion was associated with high tissue levels of ANGPTL4 (angiopoietin-like 4) mRNA based on microarray and qPCR data. Also, our in vitro studies indicated significantly increased ANGPTL4 expression in endothelial cells after stimulation with medium from endometrial cancer cell lines. ANGPTL4 is known to be induced by TGF-β and could thus be involved in activation of the EMT program and invasive growth of tumor cells.25,43 It has been suggested that ANGPTL4 might participate in disruption of vascular endothelial cell-cell junctions to facilitate trans-endothelial passage of tumor cells.25 The fact that ANGPTL4 is induced during hypoxia in both endothelial44 and tumor cells45 could indicate a relationship among angiogenesis, EMT, and vascular invasion. This notion is supported by our previous findings in endometrial cancer, in which vascular invasion was significantly associated with both vascular proliferation and the presence of less mature vessels.8 In an experimental study, up-regulation of ANGPTL4 in cell lines with lung metastasis behavior was found.46
Surprisingly, when we examined protein expression of ANGPTL4 in the present study, using a validated antibody and focusing on the tumor cell compartment, weaker staining was associated with successively reduced patient survival in univariate and multivariate analysis. Although the opposite could be predicted based on our mRNA data, nonetheless patient survival is a different end-point and a result of more complex biological interactions than are reflected in cell line studies. In support of our protein data, a model of lung cancer metastases indicated that increased expression of ANGPTL4 in 3LL cells reduced the presence of intravascular tumor cell emboli at both the primary site and lung metastases.33 Thus, the effect of ANGPTL4 might depend on the tissue context. Further studies are necessary to uncover the explanations for these findings. The relationship between mRNA and protein levels is not clear, because no significant association was found in the present study.
Collagen VIII has previously been involved in angiogenesis.47 In the present study, vascular invasion was associated with increased expression of COL8A1 (collagen, type VIII, α 1). From other reports, collagen VIII is known to be expressed in endothelial cells,48 smooth muscle cells (especially after vascular injury),35,49,50 and tumor cells (as in the present study). Collagen VIII promotes smooth muscle cell chemotaxis and signals through integrin receptors to stimulate MMP synthesis related to cellular migration and invasion.51,52 In the present study, both COL8 and MMP3 were significantly coexpressed in tumor cells and were associated with more aggressive and invasive tumors.
We found that perivascular lymphocytic infiltration was strongly associated with the process of vascular invasion. Inflammation around vessels was accompanied by tumor cell expression of COL8 and MMP3, both of which were associated with vascular invasion in this series. By thematic analysis of gene expression, vascular invasion was associated with immune response and inflammation mediated by cytokine signaling. These associations might reflect the importance of inflammation in cancer progression.53 Of particular interest, it is possible that perivascular inflammation is important for the process of vascular invasion and metastatic spread. The exact mechanism, however, is as yet unknown.
In conclusion, vascular invasion is related to high-grade tumor features and reduced survival for endometrial cancer patients. We found that vascular involvement was significantly associated with gene sets for epithelial-mesenchymal transition, wound response, endothelial cells, and VEGF activation. Among significantly up-regulated genes, ANGPTL4, COL8A1, MMP3, and IL8 are known from other studies to be related to vascular biology, invasive properties, and matrix remodeling. The present study indicates that these markers might be important for vascular invasion and metastatic spread.
Acknowledgments
We thank Gerd Lillian Hallseth, Bendik Nordanger, Britt Edvardsen, Beth Johannessen, and Hua My Hoang for excellent technical assistance.
Footnotes
Supported by the Research Council of Norway, Norwegian Cancer Society, Helse Vest RHF, and the University of Bergen.
Supplemental material for this article can be found at http://ajp.amjpathol.org or at doi:10.1016/j.ajpath.2010.10.040.
Supplementary data
Expression levels for ANGPTL4 in HUVEC and HMVEC cultures before and after incubation with conditioned medium from seven different endometrial cancer cell lines (AN3 CA, EFE-184, HEC-1-A, KLE, MFE-280, MFE-296, and RL95-2) for 18 hours. Cells were harvested and gene expression was measured by cDNA microarray analysis. A: ANGPTL4 was consistently up-regulated in all HMVEC cultures, whereas only minor differences were seen in HUVEC cultures. B: MMP3 was up-regulated in the majority of the stimulated cultures. Expression values are relative to unstimulated HUVEC and HMVEC cells.
Estimated patient survival according to ANGPTL4 protein expression (staining index) in tumor cells (log-rank significance test).
Estimated patient survival according to IL-8 protein expression in tumor cells, using our validation series (series II) (log-rank significance test).
References
- 1.Hanahan D., Weinberg R.A. The hallmarks of cancer. Cell. 2000;100:57–70. doi: 10.1016/s0092-8674(00)81683-9. [DOI] [PubMed] [Google Scholar]
- 2.Ferrari M.K., McNeal J.E., Malhotra S.M., Brooks J.D. Vascular invasion predicts recurrence after radical prostatectomy: stratification of risk based on pathologic variables. Urology. 2004;64:749–753. doi: 10.1016/j.urology.2004.04.070. [DOI] [PubMed] [Google Scholar]
- 3.Mohammed R.A., Martin S.G., Gill M.S., Green A.R., Paish E.C., Ellis I.O. Improved methods of detection of lymphovascular invasion demonstrate that it is the predominant method of vascular invasion in breast cancer and has important clinical consequences. Am J Surg Pathol. 2007;31:1825–1833. doi: 10.1097/PAS.0b013e31806841f6. [DOI] [PubMed] [Google Scholar]
- 4.Stefansson I.M., Salvesen H.B., Immervoll H., Akslen L.A. Prognostic impact of histological grade and vascular invasion compared with tumour cell proliferation in endometrial carcinoma of endometrioid type. Histopathology. 2004;44:472–479. doi: 10.1111/j.1365-2559.2004.01882.x. [DOI] [PubMed] [Google Scholar]
- 5.Straume O., Akslen L.A. Independent prognostic importance of vascular invasion in nodular melanomas. Cancer. 1996;78:1211–1219. doi: 10.1002/(SICI)1097-0142(19960915)78:6<1211::AID-CNCR7>3.0.CO;2-C. [DOI] [PubMed] [Google Scholar]
- 6.Woodhouse E.C., Chuaqui R.F., Liotta L.A. General mechanisms of metastasis. Cancer. 1997;80:1529–1537. doi: 10.1002/(sici)1097-0142(19971015)80:8+<1529::aid-cncr2>3.3.co;2-#. [DOI] [PubMed] [Google Scholar]
- 7.Mannelqvist M., Stefansson I., Salvesen H.B., Akslen L.A. Importance of tumour cell invasion in blood and lymphatic vasculature among patients with endometrial carcinoma. Histopathology. 2009;54:174–183. doi: 10.1111/j.1365-2559.2008.03201.x. [DOI] [PubMed] [Google Scholar]
- 8.Stefansson I.M., Salvesen H.B., Akslen L.A. Vascular proliferation is important for clinical progress of endometrial cancer. Cancer Res. 2006;66:3303–3309. doi: 10.1158/0008-5472.CAN-05-1163. [DOI] [PubMed] [Google Scholar]
- 9.van 't Veer L.J., Dai H., van de Vijver M.J., He Y.D., Hart A.A., Mao M., Peterse H.L., van der Kooy K., Marton M.J., Witteveen A.T., Schreiber G.J., Kerkhoven R.M., Roberts C., Linsley P.S., Bernards R., Friend S.H. Gene expression profiling predicts clinical outcome of breast cancer. Nature. 2002;415:530–536. doi: 10.1038/415530a. [DOI] [PubMed] [Google Scholar]
- 10.Salvesen H.B., Carter S.L., Mannelqvist M., Dutt A., Getz G., Stefansson I.M., Raeder M.B., Sos M.L., Engelsen I.B., Trovik J., Wik E., Greulich H., Bo T.H., Jonassen I., Thomas R.K., Zander T., Garraway L.A., Oyan A.M., Sellers W.R., Kalland K.H., Meyerson M., Akslen L.A., Beroukhim R. Integrated genomic profiling of endometrial carcinoma associates aggressive tumors with indicators of PI3 kinase activation. Proc Natl Acad Sci USA. 2009;106:4834–4839. doi: 10.1073/pnas.0806514106. [DOI] [PMC free article] [PubMed] [Google Scholar]
- 11.Halvorsen O.J., Oyan A.M., Bø T.H., Olsen S., Rostad K., Haukaas S.A., Bakke A.M., Marzolf B., Dimitrov K., Stordrange L., Lin B., Jonassen I., Hood L., Akslen L.A., Kalland K.H. Gene expression profiles in prostate cancer: association with patient subgroups and tumour differentiation. Int J Oncol. 2005;26:329–336. [PubMed] [Google Scholar]
- 12.Rostad K., Mannelqvist M., Halvorsen O.J., Oyan A.M., Bo T.H., Stordrange L., Olsen S., Haukaas S.A., Lin B., Hood L., Jonassen I., Akslen L.A., Kalland K.H. ERG upregulation and related ETS transcription factors in prostate cancer. Int J Oncol. 2007;30:19–32. [PubMed] [Google Scholar]
- 13.Øyan A.M., Anensen N., Bø T.H., Stordrange L., Jonassen I., Bruserud Ø., Kalland K.H., Gjertsen B.T. Genes of cell-cell interactions, chemotherapy detoxification and apoptosis are induced during chemotherapy of acute myeloid leukemia. BMC Cancer. 2009;9:77. doi: 10.1186/1471-2407-9-77. [DOI] [PMC free article] [PubMed] [Google Scholar]
- 14.Dysvik B., Jonassen I. J-Express: exploring gene expression data using Java. Bioinformatics. 2001;17:369–370. doi: 10.1093/bioinformatics/17.4.369. [DOI] [PubMed] [Google Scholar]
- 15.Yang Y.H., Buckley M.J., Speed T.P. Analysis of cDNA microarray images. Brief Bioinform. 2001;2:341–349. doi: 10.1093/bib/2.4.341. [DOI] [PubMed] [Google Scholar]
- 16.Bø T.H., Dysvik B., Jonassen I. LSimpute: accurate estimation of missing values in microarray data with least squares methods. Nucleic Acids Res. 2004;32:e34. doi: 10.1093/nar/gnh026. [DOI] [PMC free article] [PubMed] [Google Scholar]
- 17.Engelsen I.B., Mannelqvist M., Stefansson I.M., Carter S.L., Beroukhim R., Øyan A.M., Otte A.P., Kalland K.H., Akslen L.A., Salvesen H.B. Low BMI-1 expression is associated with an activated BMI-1-driven signature, vascular invasion, and hormone receptor loss in endometrial carcinoma. Br J Cancer. 2008;98:1662–1669. doi: 10.1038/sj.bjc.6604360. [DOI] [PMC free article] [PubMed] [Google Scholar]
- 18.Tusher V.G., Tibshirani R., Chu G. Significance analysis of microarrays applied to the ionizing radiation response. Proc Natl Acad Sci USA. 2001;98:5116–5121. doi: 10.1073/pnas.091062498. [Erratum appeared in Proc Natl Acad Sci U S A 2001, 98:10515] [DOI] [PMC free article] [PubMed] [Google Scholar]
- 19.Leblond C.P., Inoue S. Structure, composition, and assembly of basement membrane. Am J Anat. 1989;185:367–390. doi: 10.1002/aja.1001850403. [DOI] [PubMed] [Google Scholar]
- 20.Thomas P.D., Kejariwal A., Guo N., Mi H., Campbell M.J., Muruganujan A., Lazareva-Ulitsky B. Applications for protein sequence-function evolution data: mRNA/protein expression analysis and coding SNP scoring tools. Nucleic Acids Res. 2006;34:W645–W650. doi: 10.1093/nar/gkl229. [DOI] [PMC free article] [PubMed] [Google Scholar]
- 21.Subramanian A., Tamayo P., Mootha V.K., Mukherjee S., Ebert B.L., Gillette M.A., Paulovich A., Pomeroy S.L., Golub T.R., Lander E.S., Mesirov J.P. Gene set enrichment analysis: a knowledge-based approach for interpreting genome-wide expression profiles. Proc Natl Acad Sci USA. 2005;102:15545–15550. doi: 10.1073/pnas.0506580102. [DOI] [PMC free article] [PubMed] [Google Scholar]
- 22.Guyon I., Elisseeff A. An introduction to variable and feature selection. J Mach Learn Res. 2003;3:1157–1182. [Google Scholar]
- 23.Chang H.Y., Sneddon J.B., Alizadeh A.A., Sood R., West R.B., Montgomery K., Chi J.T., van de Rijn M., Botstein D., Brown P.O. Gene expression signature of fibroblast serum response predicts human cancer progression: similarities between tumors and wounds. PLoS Biol. 2004;2:E7. doi: 10.1371/journal.pbio.0020007. [DOI] [PMC free article] [PubMed] [Google Scholar]
- 24.Ho M., Yang E., Matcuk G., Deng D., Sampas N., Tsalenko A., Tabibiazar R., Zhang Y., Chen M., Talbi S., Ho Y.D., Wang J., Tsao P.S., Ben-Dor A., Yakhini Z., Bruhn L., Quertermous T. Identification of endothelial cell genes by combined database mining and microarray analysis. Physiol Genomics. 2003;13:249–262. doi: 10.1152/physiolgenomics.00186.2002. [DOI] [PubMed] [Google Scholar]
- 25.Padua D., Zhang X.H., Wang Q., Nadal C., Gerald W.L., Gomis R.R., Massagué J. TGFbeta primes breast tumors for lung metastasis seeding through angiopoietin-like 4. Cell. 2008;133:66–77. doi: 10.1016/j.cell.2008.01.046. [DOI] [PMC free article] [PubMed] [Google Scholar]
- 26.Hu Z., Fan C., Livasy C., He X., Oh D.S., Ewend M.G., Carey L.A., Subramanian S., West R., Ikpatt F., Olopade O.I., van de Rijn M., Perou C.M. A compact VEGF signature associated with distant metastases and poor outcomes. BMC Med. 2009;7:9. doi: 10.1186/1741-7015-7-9. [DOI] [PMC free article] [PubMed] [Google Scholar]
- 27.Stefansson I.M., Salvesen H.B., Akslen L.A. Prognostic impact of alterations in P-cadherin expression and related cell adhesion markers in endometrial cancer. J Clin Oncol. 2004;22:1242–1252. doi: 10.1200/JCO.2004.09.034. [DOI] [PubMed] [Google Scholar]
- 28.Aas T., Børresen A.L., Geisler S., Smith-Sørensen B., Johnsen H., Varhaug J.E., Akslen L.A., Lønning P.E. Specific P53 mutations are associated with de novo resistance to doxorubicin in breast cancer patients. Nat Med. 1996;2:811–814. doi: 10.1038/nm0796-811. [DOI] [PubMed] [Google Scholar]
- 29.Bachmann I.M., Puntervoll H.E., Otte A.P., Akslen L.A. Loss of BMI-1 expression is associated with clinical progress of malignant melanoma. Mod Pathol. 2008;21:583–590. doi: 10.1038/modpathol.2008.17. [DOI] [PubMed] [Google Scholar]
- 30.Hanson M.B., van Nagell J.R., Powell D.E., Donaldson E.S., Gallion H., Merhige M., Pavlik E.J. The prognostic significance of lymph-vascular space invasion in stage I endometrial cancer. Cancer. 1985;55:1753–1757. doi: 10.1002/1097-0142(19850415)55:8<1753::aid-cncr2820550823>3.0.co;2-p. [DOI] [PubMed] [Google Scholar]
- 31.Sivridis E., Buckley C.H., Fox H. The prognostic significance of lymphatic vascular space invasion in endometrial adenocarcinoma. Br J Obstet Gynaecol. 1987;94:991–994. doi: 10.1111/j.1471-0528.1987.tb02275.x. [DOI] [PubMed] [Google Scholar]
- 32.Gal D., Recio F.O., Zamurovic D., Tancer M.L. Lymphovascular space involvement–a prognostic indicator in endometrial adenocarcinoma. Gynecol Oncol. 1991;42:142–145. doi: 10.1016/0090-8258(91)90334-2. [DOI] [PubMed] [Google Scholar]
- 33.Galaup A., Cazes A., Le Jan S., Philippe J., Connault E., Le Coz E., Mekid H., Mir L.M., Opolon P., Corvol P., Monnot C., Germain S. Angiopoietin-like 4 prevents metastasis through inhibition of vascular permeability and tumor cell motility and invasiveness. Proc Natl Acad Sci USA. 2006;103:18721–18726. doi: 10.1073/pnas.0609025103. [DOI] [PMC free article] [PubMed] [Google Scholar]
- 34.Nelson C.M., Khauv D., Bissell M.J., Radisky D.C. Change in cell shape is required for matrix metalloproteinase-induced epithelial-mesenchymal transition of mammary epithelial cells. J Cell Biochem. 2008;105:25–33. doi: 10.1002/jcb.21821. [DOI] [PMC free article] [PubMed] [Google Scholar]
- 35.Sibinga N.E., Foster L.C., Hsieh C.M., Perrella M.A., Lee W.S., Endege W.O., Sage E.H., Lee M.E., Haber E. Collagen VIII is expressed by vascular smooth muscle cells in response to vascular injury. Circ Res. 1997;80:532–541. doi: 10.1161/01.res.80.4.532. [DOI] [PubMed] [Google Scholar]
- 36.Przybylo J.A., Radisky D.C. Matrix metalloproteinase-induced epithelial-mesenchymal transition: tumor progression at Snail's pace. Int J Biochem Cell Biol. 2007;39:1082–1088. doi: 10.1016/j.biocel.2007.03.002. [DOI] [PubMed] [Google Scholar]
- 37.Radisky D.C., Levy D.D., Littlepage L.E., Liu H., Nelson C.M., Fata J.E., Leake D., Godden E.L., Albertson D.G., Nieto M.A., Werb Z., Bissell M.J. Rac1b and reactive oxygen species mediate MMP-3 -induced EMT and genomic instability. Nature. 2005;436:123–127. doi: 10.1038/nature03688. [DOI] [PMC free article] [PubMed] [Google Scholar]
- 38.Nö E V., Fingleton B., Jacobs K., Crawford H.C., Vermeulen S., Steelant W., Bruyneel E., Matrisian L.M., Mareel M. Release of an invasion promoter E-cadherin fragment by matrilysin and stromelysin-1. J Cell Sci. 2001;114:111–118. doi: 10.1242/jcs.114.1.111. [DOI] [PubMed] [Google Scholar]
- 39.Lochter A., Srebrow A., Sympson C.J., Terracio N., Werb Z., Bissell M.J. Misregulation of stromelysin-1 expression in mouse mammary tumor cells accompanies acquisition of stromelysin-1-dependent invasive properties. J Biol Chem. 1997;272:5007–5015. doi: 10.1074/jbc.272.8.5007. [DOI] [PubMed] [Google Scholar]
- 40.Lochter A., Galosy S., Muschler J., Freedman N., Werb Z., Bissell M.J. Matrix metalloproteinase stromelysin-1 triggers a cascade of molecular alterations that leads to stable epithelial-to-mesenchymal conversion and a premalignant phenotype in mammary epithelial cells. J Cell Biol. 1997;139:1861–1872. doi: 10.1083/jcb.139.7.1861. [DOI] [PMC free article] [PubMed] [Google Scholar]
- 41.Sternlicht M.D., Lochter A., Sympson C.J., Huey B., Rougier J.P., Gray J.W., Pinkel D., Bissell M.J., Werb Z. The stromal proteinase MMP3/stromelysin-1 promotes mammary carcinogenesis. Cell. 1999;98:137–146. doi: 10.1016/s0092-8674(00)81009-0. [DOI] [PMC free article] [PubMed] [Google Scholar]
- 42.Huang Y., Song N., Ding Y., Yuan S., Li X., Cai H., Shi H., Luo Y. Pulmonary vascular destabilization in the premetastatic phase facilitates lung metastasis. Cancer Res. 2009;69:7529–7537. doi: 10.1158/0008-5472.CAN-08-4382. [DOI] [PubMed] [Google Scholar]
- 43.Welm A.L. TGFbeta primes breast tumor cells for metastasis. Cell. 2008;133:27–28. doi: 10.1016/j.cell.2008.03.012. [DOI] [PubMed] [Google Scholar]
- 44.Le Jan S., Amy C., Cazes A., Monnot C., Lamandé N., Favier J., Philippe J., Sibony M., Gasc J.M., Corvol P., Germain S. Angiopoietin-like 4 is a proangiogenic factor produced during ischemia and in conventional renal cell carcinoma. Am J Pathol. 2003;162:1521–1528. doi: 10.1016/S0002-9440(10)64285-X. [DOI] [PMC free article] [PubMed] [Google Scholar]
- 45.Lal A., Peters H., St Croix B., Haroon Z.A., Dewhirst M.W., Strausberg R.L., Kaanders J.H., van der Kogel A.J., Riggins G.J. Transcriptional response to hypoxia in human tumors. J Natl Cancer Inst. 2001;93:1337–1343. doi: 10.1093/jnci/93.17.1337. [DOI] [PubMed] [Google Scholar]
- 46.Minn A.J., Gupta G.P., Siegel P.M., Bos P.D., Shu W., Giri D.D., Viale A., Olshen A.B., Gerald W.L., Massagué J. Genes that mediate breast cancer metastasis to lung. Nature. 2005;436:518–524. doi: 10.1038/nature03799. [DOI] [PMC free article] [PubMed] [Google Scholar]
- 47.Paulus W., Sage E.H., Liszka U., Iruela-Arispe M.L., Jellinger K. Increased levels of type VIII collagen in human brain tumours compared to normal brain tissue and non-neoplastic cerebral disorders. Br J Cancer. 1991;63:367–371. doi: 10.1038/bjc.1991.87. [DOI] [PMC free article] [PubMed] [Google Scholar]
- 48.Muragaki Y., Mattei M.G., Yamaguchi N., Olsen B.R., Ninomiya Y. The complete primary structure of the human alpha 1 (VIII) chain and assignment of its gene (COL8A1) to chromosome 3. Eur J Biochem. 1991;197:615–622. doi: 10.1111/j.1432-1033.1991.tb15951.x. [DOI] [PubMed] [Google Scholar]
- 49.MacBeath J.R., Kielty C.M., Shuttleworth C.A. Type VIII collagen is a product of vascular smooth-muscle cells in development and disease. Biochem J. 1996;319:993–998. doi: 10.1042/bj3190993. [DOI] [PMC free article] [PubMed] [Google Scholar]
- 50.Bendeck M.P., Regenass S., Tom W.D., Giachelli C.M., Schwartz S.M., Hart C., Reidy M.A. Differential expression of alpha 1 type VIII collagen in injured platelet-derived growth factor-BB–stimulated rat carotid arteries. Circ Res. 1996;79:524–531. doi: 10.1161/01.res.79.3.524. [DOI] [PubMed] [Google Scholar]
- 51.Hou G., Mulholland D., Gronska M.A., Bendeck M.P. Type VIII collagen stimulates smooth muscle cell migration and matrix metalloproteinase synthesis after arterial injury. Am J Pathol. 2000;156:467–476. doi: 10.1016/S0002-9440(10)64751-7. [DOI] [PMC free article] [PubMed] [Google Scholar]
- 52.Adiguzel E., Hou G., Mulholland D., Hopfer U., Fukai N., Olsen B., Bendeck M. Migration and growth are attenuated in vascular smooth muscle cells with type VIII collagen-null alleles. Arterioscler Thromb Vasc Biol. 2006;26:56–61. doi: 10.1161/01.ATV.0000194155.96456.b7. [DOI] [PubMed] [Google Scholar]
- 53.Aggarwal B.B., Gehlot P. Inflammation and cancer: how friendly is the relationship for cancer patients? Curr Opin Pharmacol. 2009;9:351–369. doi: 10.1016/j.coph.2009.06.020. [DOI] [PMC free article] [PubMed] [Google Scholar]
Associated Data
This section collects any data citations, data availability statements, or supplementary materials included in this article.
Supplementary Materials
Expression levels for ANGPTL4 in HUVEC and HMVEC cultures before and after incubation with conditioned medium from seven different endometrial cancer cell lines (AN3 CA, EFE-184, HEC-1-A, KLE, MFE-280, MFE-296, and RL95-2) for 18 hours. Cells were harvested and gene expression was measured by cDNA microarray analysis. A: ANGPTL4 was consistently up-regulated in all HMVEC cultures, whereas only minor differences were seen in HUVEC cultures. B: MMP3 was up-regulated in the majority of the stimulated cultures. Expression values are relative to unstimulated HUVEC and HMVEC cells.
Estimated patient survival according to ANGPTL4 protein expression (staining index) in tumor cells (log-rank significance test).
Estimated patient survival according to IL-8 protein expression in tumor cells, using our validation series (series II) (log-rank significance test).