Cold denaturation is a phenomenon common to many proteins,1 but it has not previously been observed directly for nucleic acids.2 It results from a difference in the heat capacities (ΔCp) of the folded and unfolded states, and correlates with the change in accessible surface area between the two species.3 Incorporation of a ΔCp for (un)folding into the Gibbs free energy results in a modified form of the Gibbs equation (eqs 1 and 2), where T* is an arbitrary reference temperature, and ΔH* and ΔS* are the enthalpy and entropy, respectively, at that temperature. Large ΔCp terms result in curvature of the free energy profile such that a temperature of maximum stability exists, flanked by hot and cold melting temperatures (Tm's).
| (1) |
| (2) |
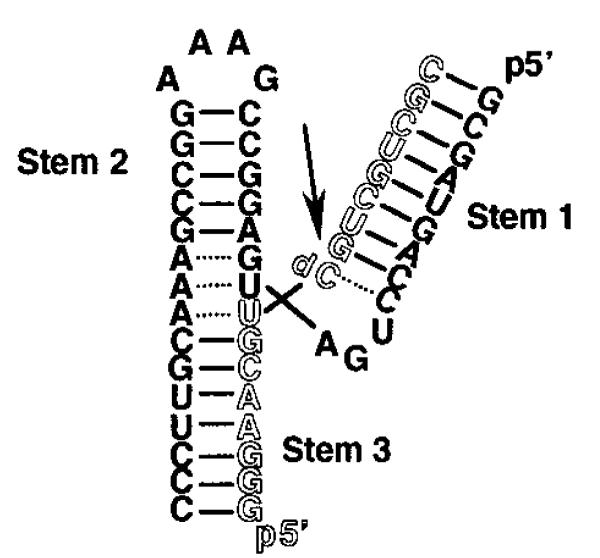
The ΔCp for nucleic acid folding has been commonly assumed to be approximately zero.4–6 However, several recent studies reported significant ΔCp's for DNA duplex formation7–9 and RNA tertiary folding,10–13 leading to predicitions of cold unfolding. Here, we report spectroscopic evidence that the hammerhead ribozyme (Figure 1), a small self-cleaving RNA,14 undergoes cold denaturation, the first direct observation of this phenomenon for a nucleic acid.
Figure 1.

Diagram of HH16, the two-strand, 55-nucleotide (nt) hammerhead construct used in this study. Strands of 38 nts (solid) and 17 nts (outline) anneal to form the complete ribozyme. The arrow marks the cleavage site in the active ribozyme. All samples used for CD employed dC at this site to prevent cleavage.
Recent cryoenzymological studies on hammerhead ribozyme 16 (HH16) demonstrated that a 40% (v/v) methanol in water cryosolvent system only minimally perturbed the ribozyme, maintaining 80% of the rate observed in aqueous solution, with no loss in total extent of cleavage.15 The cryosolvent allowed kinetic measurements of activity at temperatures down to −33 °C. A dramatic reduction in cleavage rate occurred below −27 °C, yielding significant curvature in the Eyring plot. Among the possible explanations for these data was a cold denaturation transition inactivating the ribozyme.
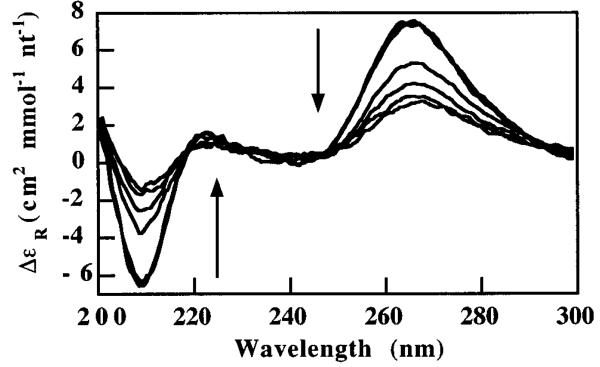
The low-temperature structure of HH16 was therefore investigated, using circular dichroism (CD) spectroscopy.16 CD is an effective probe of nucleic acid secondary and tertiary structure.17,18 For example, by monitoring the CD signal of HH16 at 264 and 209 nm during titration with Mg2+, we obtain Kd values for ion-dependent folding of the ribozyme core in good agreement with published values obtained by native gel electrophoresis,19,20 FRET,21 and calorimetry11 (data not shown). At 20 °C, addition of 40% methanol to folded samples of HH16 causes no significant change in the CD spectrum. Upon cooling, however, a dramatic change occurs between −10 and −30 °C under conditions similar to those used for cryoenzymology, indicative of a near total loss of secondary and tertiary structure (Figure 2). Under these conditions, data monitored at either 264 or 209 nm do not fit a two-state model, but qualitatively resemble two overlapping transitions possibly corresponding to sequential loss of tertiary and secondary structures. Control experiments employing radiolabeled HH16 provide no evidence of precipitation down to −30 °C, the lowest temperature at which we could assay for precipitate by centrifugation.
Figure 2.
Overlaid CD spectra of 7 μM HH16 in 40% MeOH, 50 mM Tris pH 8.0, 10 mM Mg2+. Arrows highlight the observed intensity changes at 264 and 209 nm as temperature descends from 20 to −27 °C. These peaks report on the extent of global structure in the construct.
Optimization of the pH and ion concentrations yielded conditions under which the structural transitions are reversible and fit nicely to a two-state model.22 In 10 mM Mg2+ at pH 5.0, a transition with a Tm of −20 °C is observed (see Figure S1).
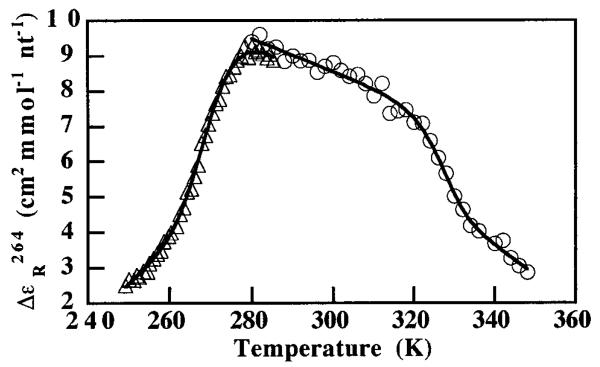
The amplitude of this structural change, in comparison to the Mg2+ titration data and high-temperature melting experiments, indicates a loss of only tertiary structure. In contrast, Figure 3 shows the high- and low-temperature melting curves of a sample at pH 6.6 in 500 mM NaCl. The spectroscopic data under these conditions were fit by least-squares minimization to a double-baseline model (eq 3), where m and b are the baseline slopes and intercepts, and R is the fraction of folded ribozyme. The parameter α is related to K by a two-state model for a nonself-complementary bimolecular system23 (eq 4) in which CT is the total strand concentration.
Figure 3.
Hot and cold unfolding transitions of the same sample: 10 μM HH16 in 40% MeOH, 50 mM cacodylate pH 6.6, 500 mM NaCl. The sample was denatured by heating to 348 K and then ramped to 283 K at 1 °C/min (O) by using a Peltier device. After transfer to a jacketed circulation cell at 288 K, the sample was ramped down to 248 K at 7.5 °C/h (Δ). Solid lines are two-state fits of the CD data at 264 nm.
| (3) |
| (4) |
The fits yield Tm's at 53 and −1 °C and ΔH's of 378 ± 77 and 193 ± 20 kJ mol−1, respectively. The magnitude of the cold transition is comparable to that of the high-temperature melt, indicating a significant loss of secondary structure. Previous work has shown that high (≥1 M) monovalent ion concentrations can substitute for divalent ions normally required for hammerhead activity.24-26 At 500 mM NaCl, however, the ribozyme is somewhat destabilized and only modestly active. The central monotonic region of Figure 3 therefore likely corresponds to a shifting ensemble of tertiary conformers. Using the van't Hoff fitting parameters and eq 1, we determined ΔCp for the folding transition under these conditions with the estimate that ΔCp ) (ΔHhot – ΔHcold)/(Tmhot –Tmcold). This approximation of ΔCp benefits from the wide temperature range separating the two transitions. Parameters obtained from the fits yield a van't Hoff ΔCp for secondary structure formation of 3.4 ± 0.9 kJ K−1 mol−1 under the 500 mM NaCl conditions. This value corresponds to a ΔCp of g0.18 kJ K−1 (mol base pair)−1, where the limit indicates that our data cannot conclusively show that all secondary structure is lost during the cold denaturation transition. These values fall within the range of calorimetric ΔCp's (0.17−0.84 kJ K−1 (mol base pair)−1) recently reported for DNA duplex formation.7-9 ΔCp's calculated from the imposition of a two-state model onto optical melting data must be treated with caution, however.27 “Denatured” end-states are usually more aptly described as complex ensembles with varying degrees of residual stacking.9 Even data that fit beautifully to a two-state model may yield misleading thermodynamic values due to the temperature dependence of these ensembles and their coupled equilibria with other solution components. Furthermore, the solution parameters that affect ΔCp for nucleic acid folding are poorly understood since few studies have focused on this parameter.8 Additional calorimetric experiments currently underway could validate the utility of a two-state model in nucleic acid folding and the energetic importance of the ΔCp term.
The observation of RNA cold denaturation belies the assumption of a negligible ΔCp of folding implicit in most algorithms currently used for RNA (or DNA) structure prediction. Although this approach might be adequate for routine secondary structure prediction, it may prove insufficient when applied to more complex problems such as tertiary folding and multibranch junctions.10
In conclusion, we have provided the first direct evidence for cold denaturation of a nucleic acid. From hot and cold transitions of the same sample, we calculate a van't Hoff ΔCp of secondary structure formation that compares favorably with calorimetric data for DNA duplexes. Our observations contradict a common assumption that the ΔCp of nucleic acid folding is near zero and highlight the need to use thermodynamic models of RNA folding that include ΔCp terms.
Supplementary Material
Acknowledgment
We thank D. Turner and V. Bloomfield for helpful comments on the manuscript. This work was supported by NSF Grant CHE-9909407 (to A.L.F.) and the Indiana University Department of Chemistry.
Footnotes
Supporting Information Available: Derivation of the fitting equation and Δ∈R264 vs. T plot for the 10 mM Mg2+, pH 5.5 sample (PDF). This material is available free of charge via the Internet at http://pubs.acs.org.
References
- 1.Privalov PL. Crit. Rev. Biochem. Mol. Biol. 199025:281–305. doi: 10.3109/10409239009090612. [DOI] [PubMed] [Google Scholar]
- 2.Previous studies involving the docking of the P1 helix of the group I intron showed local unfolding at reduced temperatures. This “cold denaturation” is a somewhat different phenomenon deriving from an entropically driven binding equilibrium. Li Y, Bevilacqua PC, Matthews D, Turner DH. Biochemistry. 199534:14394–14399. doi: 10.1021/bi00044a016. Narlikar GJ, Herschlag D. Nat. Struct. Biol. 19963:701–710. doi: 10.1038/nsb0896-701.
- 3.Robertson AD, Murphy KP. Chem. Rev. 199797:1251–1267. doi: 10.1021/cr960383c. [DOI] [PubMed] [Google Scholar]
- 4.Bloomfield VA, Crothers DM, Tinoco I., Jr. Nucleic Acids: Structures, Properties, and Functions. University Science Books; Sausalito, CA: 2000. [Google Scholar]
- 5.Breslauer KJ, Frank R, Blocker H, Marky LA. Proc. Natl. Acad. Sci. U.S.A. 198683:3746–3750. doi: 10.1073/pnas.83.11.3746. [DOI] [PMC free article] [PubMed] [Google Scholar]
- 6.Lane AN, Jenkins TC. Q. Rev. Biophys. 200033:255–306. doi: 10.1017/s0033583500003632. [DOI] [PubMed] [Google Scholar]
- 7.Chalikian TV, Volker J, Plum GE, Breslauer KJ. Proc. Natl. Acad. Sci. U.S.A. 199996:7853–7858. doi: 10.1073/pnas.96.14.7853. [DOI] [PMC free article] [PubMed] [Google Scholar]
- 8.Rouzina I, Bloomfield VA. Biophys. J. 199977:3242–3251. doi: 10.1016/S0006-3495(99)77155-9. [DOI] [PMC free article] [PubMed] [Google Scholar]
- 9.Holbrook JA, Capp MW, Saecker RM, Record MT., Jr. Biochemistry. 199938:8409–8422. doi: 10.1021/bi990043w. [DOI] [PubMed] [Google Scholar]
- 10.Diamond JM, Turner DH, Mathews DH. Biochemistry. 200140:6971–6981. doi: 10.1021/bi0029548. [DOI] [PubMed] [Google Scholar]
- 11.Hammann C, Cooper A, Lilley DM. Biochemistry. 200140:1423–1429. doi: 10.1021/bi002231o. [DOI] [PubMed] [Google Scholar]
- 12.Klostermeier D, Millar DP. Biochemistry. 200039:12970–12978. doi: 10.1021/bi0014103. [DOI] [PubMed] [Google Scholar]
- 13.Fang XW, Golden BL, Littrell K, Shelton V, Thiyagarajan P, Pan T, Sosnick TR. Proc. Natl. Acad. Sci. U.S.A. 200198:4355–4360. doi: 10.1073/pnas.071050698. [DOI] [PMC free article] [PubMed] [Google Scholar]
- 14.McKay DB. RNA. 19962:395–403. [PMC free article] [PubMed] [Google Scholar]
- 15.Feig AL, Ammons GE, Uhlenbeck OC. RNA. 19984:1251–1258. doi: 10.1017/s1355838298980943. [DOI] [PMC free article] [PubMed] [Google Scholar]
- 16.RNAs were prepared either by chemical synthesis (Dharmacon Research, Inc.) or T7 RNA transcription and gel purified prior to use. The samples were annealed by slow cooling from 95 to 25 °C in the appropriate aqueous buffer. MgCl2 and MeOH were added to their appropriate concentrations after equilibration to room temperature. Data were collected in 1 mm path length cells on a Jasco J715 CD spectrometer. Data are presented as the mean residue molar circular dichroism, Δ∈R. Data were also collected during the warming ramps but they have been omitted for purposes of clarity.
- 17.Fasman GD. Circular Dichroism and the Conformational Analysis of Biomolecules. Plenum; New York: 1996. [Google Scholar]
- 18.Sosnick TR, Fang X, Shelton VM. Methods Enzymol. 2000317:393–409. doi: 10.1016/s0076-6879(00)17026-0. [DOI] [PubMed] [Google Scholar]
- 19.Bassi GS, Mollegaard NE, Murchie AI, von Kitzing E, Lilley DM. Nat. Struct. Biol. 19952:45–55. doi: 10.1038/nsb0195-45. [DOI] [PubMed] [Google Scholar]
- 20.Bassi GS, Murchie AI, Lilley DM. RNA. 19962:756–768. [PMC free article] [PubMed] [Google Scholar]
- 21.Bassi GS, Murchie AI, Walter F, Clegg RM, Lilley DM. EMBO J. 199716:7481–7489. doi: 10.1093/emboj/16.24.7481. [DOI] [PMC free article] [PubMed] [Google Scholar]
- 22.A complete derivation of the model is available as Supporting Information.
- 23.Turner D. In: Nucleic Acids: Structures, Properties, and Functions. Bloomfield VA, Crothers DM, Tinoco I Jr., editors. University Science Books; Sausalito, CA: 2000. pp. 272–273. The two transitions were separately fit for ΔH° and Tm of folding. The reported error is the standard deviation from the least–squares fit. Fitting of the cold transition was complicated by the narrow range of the low temperature baseline data. This factor has a relatively minor effect on the fitted values of ΔH° and Tm. [Google Scholar]
- 24.Murray JB, Seyhan AA, Walter NG, Burke JM, Scott WG. Chem. Biol. 19985:587–595. doi: 10.1016/s1074-5521(98)90116-8. [DOI] [PubMed] [Google Scholar]
- 25.Curtis EA, Bartel DP. RNA. 20017:546–552. doi: 10.1017/s1355838201002357. [DOI] [PMC free article] [PubMed] [Google Scholar]
- 26.O'Rear JL, Wang S, Feig AL, Beigelman L, Uhlenbeck OC, Herschlag D. RNA. 20017:537–545. doi: 10.1017/s1355838201002461. [DOI] [PMC free article] [PubMed] [Google Scholar]
- 27.SantaLucia J, Jr., Turner DH. Biopolymers. 199744:309–319. doi: 10.1002/(SICI)1097-0282(1997)44:3<309::AID-BIP8>3.0.CO;2-Z. [DOI] [PubMed] [Google Scholar]
Associated Data
This section collects any data citations, data availability statements, or supplementary materials included in this article.


