Abstract
In two-dimensional (2D) lattices, the electronic levels are unevenly spaced, and the density of states (DOS) displays a logarithmic divergence known as the Van Hove singularity (VHS). This is the case in particular for the layered cuprate superconductors. The scanning tunnelling microscope (STM) probes the DOS, and is therefore the ideal tool to observe the VHS. No STM study of cuprate superconductors has reported such an observation so far giving rise to a debate about the possibility of observing directly the normal state DOS in the tunnelling spectra. In this study, we show for the first time that the VHS is unambiguously observed in STM measurements performed on the cuprate Bi2Sr2CuO6+δ (Bi-2201). Beside closing the debate, our analysis proves the presence of the pseudogap in the overdoped side of the phase diagram of Bi-2201 and discredits the scenario of the pseudogap phase crossing the superconducting dome.
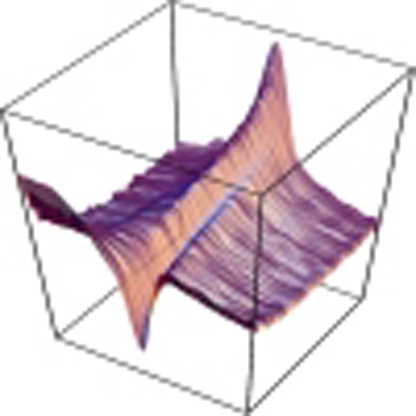 In two-dimensional lattices the electronic levels are unevenly spaced and the density of states exhibits a divergence known as the Van Hove singularity. In this study, the Van Hove singularity is observed for the first time in a cuprate using scanning tunnelling microscopy.
The scanning tunnelling spectroscopy (STS) is known to probe the density of states (DOS)1,2, and a logarithmic peak is therefore expected in the tunnelling spectrum of materials having a Van Hove singularity (VHS) near the Fermi level. However, there is a strong theoretical debate around the possibility to observe such features in tunnelling spectra. The compelling absence of such a peak in the tunnelling spectra of the cuprates has lead to claims that the normal state DOS would in fact be cancelled just like as in ideal planar tunnel junctions3,4. An alternative is that the VHS peak is suppressed because of the interaction of electrons with collective excitations5,6,7.
Among the cuprates, Bi2Sr2CuO6+δ (Bi-2201) has a combination of two properties required for an optimal STS investigation of the VHS: it is nearly 2D and has a low maximal Tc of around 12 K giving access to the normal state at low temperature. Producing large and pure non-cation-doped single crystals of Bi-2201 is difficult and consequently, this compound has attracted little attention. We succeeded in growing such crystals and tuning their macroscopic doping level8, allowing doping-dependent STS studies.
In this study, we demonstrate that the VHS is directly seen in the tunnelling spectra of Bi-2201. We observe that all the spectra can be fitted by a model involving a VHS and a d-wave gap as described in the theory by Bardeen, Cooper, and Schrieffer (BCS). This suggests that the VHS shows up in the low Tc Bi-2201 because of a weak coupling to collective modes. Moreover, our measurement at a temperature above Tc of a heavily overdoped Bi-2201 sample clearly exhibits a gap feature that we interpret as the signature of the pseudogap phase.
Results
STM data for overdoped Bi-2201 samples
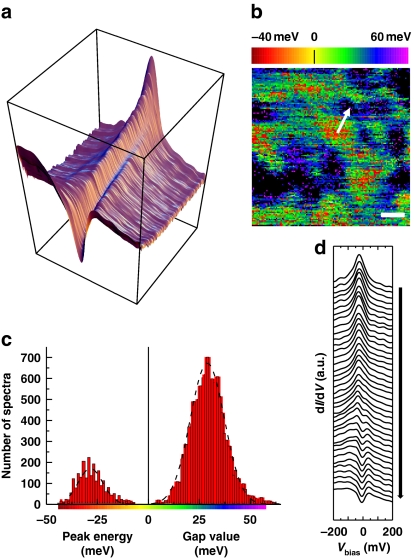
Low temperature spatially resolved STS of an as-grown sample (AG11K) with Tc=11 K and a transition width ΔTc=4.5 K is depicted in Figure 1. Most of the surface presents spectra with a clear superconducting gap in the 15–45 meV range. However, extended regions covering 11% of the sample exhibit qualitatively different spectra, without a gap but with a single sharp peak 10–40 meV below the Fermi energy. A broadly peaked background has been seen earlier in Bi-2201 but only at high temperature9. The observation of this new type of spectra at low temperature, which we attribute to the VHS, is our main finding. To each spectrum, we assign a characteristic energy Ep which is either the peak to peak gap value (if two peaks are detected) or the energy position of the single peak. The transition between the two characteristic kinds of spectra is remarkably gradual and reproducible, both spatially (Fig. 1d) and when the spectra are sorted according to the value of Ep (Fig. 1a). The general trend is that as the height of the peak decreases, a coherence peak emerges at positive energy signalling the opening of the gap, and the negative-bias peak shifts to larger negative energy. The nanometre-sized red to yellow areas corresponding in Figure 1b to single-peak spectra are all surrounded by green regions that have small gaps.
Figure 1. Low-temperature (5 K) STS spectroscopy of as-grown Bi-2201 (AG11 K).
(a) Three-dimensional overview of the data: each curve is the average of 60 spectra sharing the same Ep value (Ep is the peak position for single-peak spectra, and half the peak-to-peak distance for two-peak spectra); the curves are sorted by increasing Ep. Note the smooth transition between completely different curves at extremal values of Ep. (b) Ep map of a 14×14 nm2 area. The white bar corresponds to 2 nm. The red and yellow regions correspond to negative Ep (single-peak spectra) while in green, blue and purple regions, the spectra exhibit a gap width of Δp=Ep. Red-yellow spots are surrounded by green regions where the smallest gap is measured (∼20 meV). Black patches are composed of spectra (∼4,000 in total) in which no gap could be extracted due to a missing left peak (or sometimes no peak at all); these spectra are not included in the histogram of panel c. (c) Distribution of Ep values. The dashed lines are Gaussian fits. The average peak position and average gap values are −28 and +29 meV, respectively. (d) Spatial evolution of the spectra on the path depicted by the arrow in b. The path goes from a red region (top-most single-peak spectrum) to a black region where the left coherence peak is barely visible. Notice the strong similarity with the global evolution shown in a.
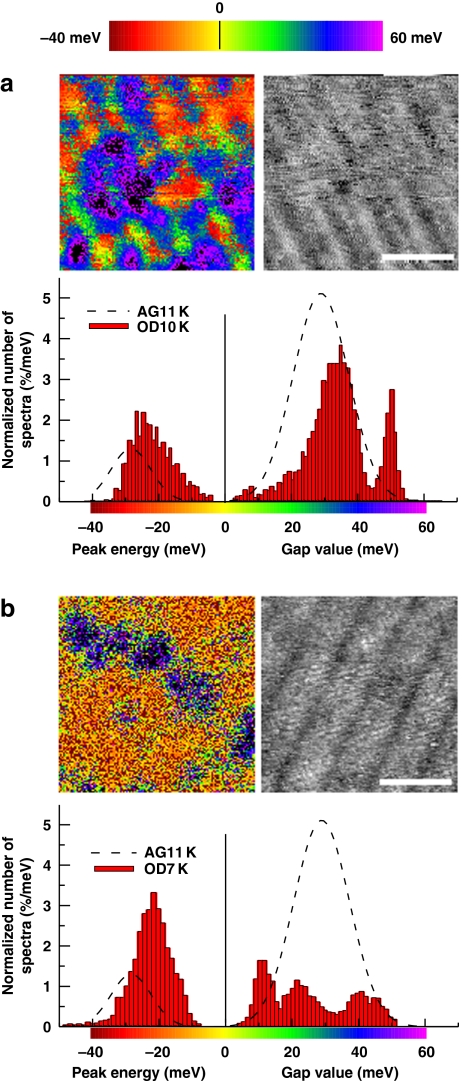
We have then acquired Ep maps and the corresponding histograms for two overdoped samples (OD10 K and OD7 K; Fig. 2). A comparison of the histograms reveals a steady increase in the number of single-peak spectra with doping from 11% at Tc=11 K to 28% at Tc=10 K and 48% at Tc=7 K. The mean peak position also shifts towards the Fermi energy with values −28, −26 and −21 meV at Tc=11, 10 and 7 K, respectively, as expected in a rigid-band picture. Along with the increased proportion of single-peak spectra with increasing overdoping, we also observe a decreased proportion of wide-gap spectra that are excluded from the histograms, as one or both coherence peaks are missing. These spectra (depicted as black pixels in the Ep maps) have a proportion of 28% in AG11 K, 6% in OD10 K and 5% in OD7 K. Much of this decrease is an effect of the postannealing treatments, which favour a more homogeneous distribution of oxygen, as confirmed by the drop in the superconducting transition width ΔTc.
Figure 2. Evolution of the Bi-2201 spectroscopic properties with overdoping.
The top-left panels show the Ep maps (Ep is the peak position for single-peak spectra, and half the peak-to-peak distance for two-peak spectra) for a, an overdoped sample with Tc=10 K and ΔTc=2.5 K (OD10 K), and for b, an overdoped sample with Tc=7 K and ΔTc=1.5 K (OD7 K). The white bars correspond to 5 nm. The distributions of Ep values presented in the histograms were normalized and compared with the histograms obtained in the least overdoped AG11 K sample (dashed lines). The top-right panels are simultaneously acquired topographies: white regions are physically higher than black ones. They show the superstructure common to all Bi-based cuprates23,24. Especially in OD10 K, the smallest gaps (green) are preferentially located on the minima of the superstructure. A similar correlation between gap size and the superstructure has been reported in Bi-221225 and Bi-222316. Our measurements further show that the preferred location of single-peak spectra (red-yellow) is also the minimum of the superstructure, suggesting that the local doping level itself is modulated.
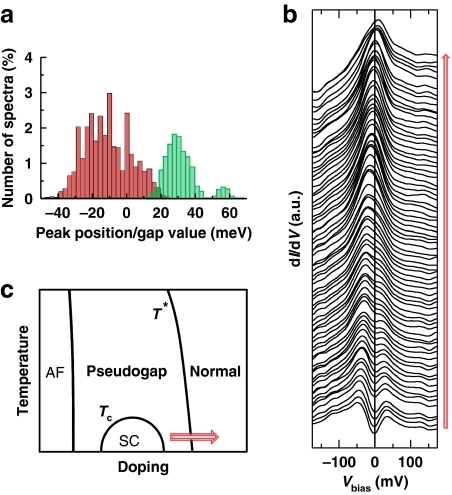
Finally, we have studied heavily overdoped sample in which Tc has been reduced to <1.8 K. The proportion of single-peak spectra increases to ∼65% and some of these spectra even exhibit a peak at energy above EF (Fig. 3a). This suggests that a transition from a (π,π)-centered hole-like to a (0,0)-centered electron-like Fermi-surface takes place in the overdoped region near the border of the superconducting dome. Fits to angle resolved photoemission spectroscopy data in cation-doped Bi-2201 have led to the same conclusion10. As seen in Figure 3b, as the gap vanishes and the peak moves to positive energy, the spectra develop a remarkable electron-hole asymmetry with a drastic suppression of spectral weight for occupied states. This trend mirrors the common phenomenology observed in all cuprates with increasing gap, namely an excess of spectral weight at negative energy. The data of Figure 3 were collected well above the bulk Tc of the sample. It is therefore natural to interpret the series of spectra in Figure 3b as a transition from the non-superconducting pseudogapped state to the un-pseudogapped normal state at fixed temperature (Fig. 3c). As it is not possible to overdope Bi-2212 or Bi-2223 so as to reach a Tc as low as in pure Bi-2201 (refs 8,11), such a transition has not been observed before by STM and can now be investigated because of the identification of the VHS.
Figure 3. Spectral properties of strongly overdoped Bi-2201 (Tc<1.8 K) measured at 5 K.
(a) Distribution of Ep values for single-peak spectra (red part of the histogram corresponds to the position of the single peak) and gapped spectra (green part of the histogram). (b) Representative spectra showing single peak at positive energy (top), single peak at negative energy and gapped structures. This series was obtained by ordering the spectra according to the position of their maximum. (c) Interpretation of b as a transition from the pseudogap to the normal state. T*, the frontier between normal and pseudogap states.
Theoretical modelling of the tunnelling spectra
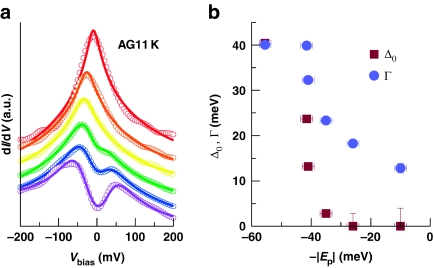
In the first STS study of Bi-2201, the shape of the normal state spectra was not addressed9,12. More recently, sharp features in the tunnelling characteristics have been reported in lead-doped Bi-2201 (ref. 13). The observed structure was a narrow peak very close to the Fermi level (±2 meV) superimposed on the superconducting gap. Such spectra were found at isolated locations on the surface and, based on earlier works in Bi-2212 (refs 14,15), they were convincingly explained as native impurity resonances. The single-peak spectra in our measurements show no trace of a superimposed superconducting gap, cover extended regions of the surface and have their maxima at a doping-dependent energy up to 40 meV below the Fermi level. To support our interpretation that the single-peak spectra are direct manifestations of the VHS in the DOS, we have modelled the dI/dV curves obtained in our samples. Following previous analysis for Bi-2212 (ref. 6) and Bi-2223 (refs 7,16), we consider here the minimal tight-binding model featuring a VHS and a d-wave BCS gap. We then perform least-square fits to determine the band parameters, the gap size Δ0 and a scattering rate Γ. Fits to some representative spectra obtained on the as-grown sample are shown in Figure 4. We observe that the model is able to follow the variety of measured spectral shapes with good accuracy. The amplitude of the BCS gap deduced from the fits is reported in Figure 4b. The fits correctly yield a vanishing gap for single-peak spectra. We thus find that the single-peak spectra exhibit the same shape as the VHS in a 2D tight-binding band. In general, the spectra measured in Bi-2201 are considerably broader than in Bi-2212 or Bi-2223. This hallmark can be captured by a phenomenological energy-independent scattering rate Γ. The typical values of Γ are indeed larger than that in other Bi-based cuprates in which Γ≲10 meV (refs 6,7,16), and we observe a tendency of Γ to follow the trend of the gap, as expected if both would result from the same pairing interaction.
Figure 4. Theoretical interpretation of Bi-2201 tunnelling spectra.
(a) Comparison of representative dI/dV curves in the as-grown sample (circles) with fits based on a simple model (lines). The model involves a 2D tight-binding dispersion with a VHS, a d-wave BCS gap and a constant scattering rate. The curves are offset vertically for clarity. (b) Squares indicate amplitude of the BCS gap determined by the fits, as a function of −|Ep|. When Δ0=0 (single-peak spectra), the model corresponds to independent electrons that are subject to a constant scattering rate, and the peak is the VHS. Circles indicate trend of the phenomenological scattering rate Γ as a function of −|Ep|.
Discussion
In Bi-2212 and Bi-2223, the bilayer and trilayer compounds of the same family, the spatial variations of the tunnelling spectra have been ascribed to inhomogeneities of the doping level on a nanometre scale17. In this scenario, the single-peak structure we observe would correspond to extremely overdoped regions, which are non-superconducting at 5 K. One thus expects that the proportion of such spectra increases in samples with higher doping levels. We have confirmed this by studying overdoped samples with various doping levels. The STM observation of the VHS in a low Tc cuprate superconductor provides a clear-cut experimental answer to a long-standing theoretical question. Our results confirm that the STM tunnelling conductance is proportional to the full-electron DOS, and not only to the 'superconducting DOS', and disqualify qualitative arguments used to claim the opposite. This must be taken seriously for the interpretation and modelling of STM tunnelling spectra in materials with singularities in the electron dispersion.
The appearance of the VHS as a sharp peak in Bi-2201 poses the question of its signature in the spectra of other Bi-based cuprates. It has been shown in refs 5,6,7 that the coupling to the (π,π) spin resonance suppresses the VHS peak and gives rise to the strong dip in Bi-2212 and Bi-2223 spectra. As suggested by ARPES18 and our measurements, if a dip is present in pure Bi-2201, it must be very weak (Fig. 4a). Within a spin-fluctuation pairing scenario, we may tentatively ascribe the low Tc of pure Bi-2201 and the absence of dip in the DOS—hence the presence of the VHS—to a weak coupling to spin fluctuations. Interestingly, in cation-doped Bi-2201, which exhibit higher critical temperatures, the VHS has not been seen19,20,21.
Our observation in the heavily overdoped sample (Fig. 3) confirms the presence of the pseudogap phase well to the overdoped region in Bi-2201 (ref. 9). In a concurrent version of the phase diagram without a pseudogap in the overdoped region, the gapped spectra in Figure 3b would have to be interpreted as regions that are superconducting at T=5 K>Tc because of inhomogeneities. In this scenario, a mechanism different from the pseudogap would be needed to explain the anomalous large gap of ∼30 meV, 30 times larger than the expected value for a BCS superconductor with a Tc of 5 K. Furthermore, the observation of the coexistence of gapped and un-gapped regions above Tc strongly supports the existence of the pseudogap in the overdoped side and questions the universality of a cuprate phase diagram, in which the pseudogap phase would cross the superconducting dome.
Methods
STM measurements
STS measurements were performed in a home-built STM placed in a low temperature and ultra-high-vacuum environment similar to the one reported in ref. 22. The crystals were cleaved at room temperature in a ∼10−9 mbar atmosphere, and immediately cooled down to 5 K. The bias voltage was applied to the sample, while the ground electrode was a mechanically sharpened iridium tip. The tunnelling current was 0.25 nA and the regulation bias was 0.4 V. Conductance maps were obtained by numerical differentiation of the I(V) curves.
Modelling of the spectra
The dI/dV curves were modelled as the thermally broadened DOS, , where f is the Fermi function and N(ω) is the BCS DOS given by  . The d-wave gap reads Δk=Δ0(cos kxa−cos kya)/2, and for the dispersion we used the five-neighbor tight-binding expression ξk=2t1(cos kxa+cos kya)+4t2 cos kxa cos kya+2t3(cos 2kxa−cos2kya)+4t4(cos 2kxa cos kya+cos kxa cos 2kya)+4t5 cos 2kxa cos 2kya−μ, with a being the lattice parameter. The k-mesh involves 1,024×1,024 k points. The model parameters were determined by least-square fits to the STM spectra. Given the restricted energy range of the experimental data, the fits cannot reliably determine the overall bandwidth controlled by t1. We therefore kept t1 fixed to the ARPES value10 t1=−213 meV for all spectra.
Author contributions
A.P. and N.J. have performed the experiments. N.J. constructed the system. A.P. grew the samples and analysed the data. A.P. and C.B. have written the manuscript. N.J., and I.M.-A. helped refine the analysis and the manuscript. Ø.F. discussed the results and manuscript.
Additional information
How to cite this article: Piriou, A. et al. First direct observation of the Van Hove singularity in the tunnelling spectra of cuprates. Nat. Commun. 2:221 doi: 10.1038/ncomms1229 (2011).
Acknowledgments
This work was supported by the Swiss National Science Foundation through Division II and MaNEP. The authors thank Y. Fasano for fruitful discussions.
References
- Tersoff J. & Hamann D. R. Theory and application for the scanning tunneling microscope. Phys. Rev. Lett. 50, 1998–2001 (1983). [Google Scholar]
- Chen C. J. Introduction to Scanning Tunneling Microscopy (Oxford University Press, 1993). [Google Scholar]
- Harrison W. A. Tunneling from an independent-particle point of view. Phys. Rev. 123, 85–89 (1961). [Google Scholar]
- Yusof Z., Zasadzinski J. F., Coffey L. & Miyakawa N. Modeling of tunneling spectroscopy in high-Tc superconductors incorporating band structure, gap symmetry, group velocity, and tunneling directionality. Phys. Rev. B 58, 514–521 (1998). [Google Scholar]
- Eschrig M. & Norman M. R. Neutron resonance: modeling photoemission and tunneling data in the superconducting state of Bi2Sr2CaCu2O8. Phys. Rev. Lett. 85, 3261–3264 (2000). [DOI] [PubMed] [Google Scholar]
- Hoogenboom B. W., Berthod C., Peter M., Fischer Ø. & Kordyuk A. Modeling scanning tunneling spectra of Bi2Sr2CaCu2O8+δ. Phys. Rev. B 67, 224502 (2003). [Google Scholar]
- Levy G., Berthod C., Piriou A., Giannini E. & Fischer Ø. Preeminent role of the Van Hove singularity in the strong-coupling analysis of scanning tunneling spectroscopy for two-dimensional cuprate superconductors. Phys. Rev. Lett. 101, 267004 (2008). [DOI] [PubMed] [Google Scholar]
- Piriou A., Giannini E., Fasano Y., Senatore C. & Fischer Ø. Vortex phase diagram and temperature-dependent second-peak effect in overdoped Bi2Sr2CuO6+δ crystals. Phys. Rev. B 81, 144517 (2010). [Google Scholar]
- Kugler M., Fischer Ø., Renner C., Ono S. & Ando Y. Scanning tunneling spectroscopy of Bi2Sr2CuO6+δ: new evidence for the common origin of the pseudogap and superconductivity. Phys. Rev. Lett. 86, 4911 (2001). [DOI] [PubMed] [Google Scholar]
- Kondo T., Takeuchi T., Mizutani U., Yokoya T., Tsuda S. & Shin S. Contribution of electronic structure to thermoelectric power in (Bi,Pb)2(Sr,La)2CuO6+δ. Phys. Rev. B 72, 024533 (2005). [Google Scholar]
- Piriou A., Fasano Y., Giannini E. & Fischer Ø. Effect of oxygen-doping on Bi2Sr2Ca2Cu3O10+δ vortex matter: crossover from electromagnetic to Josephson interlayer coupling. Phys. Rev. B 77, 184508 (2008). [Google Scholar]
- Boyer M. C. et al. Imaging the two gaps of the high-temperature superconductor Bi2Sr2CuO6+δ. Nat. Phys. 3, 802–806 (2007). [Google Scholar]
- Chatterjee K. et al. Visualization of the interplay between high-temperature superconductivity, the pseudogap and impurity resonances. Nat. Phys. 4, 108–111 (2008). [Google Scholar]
- Pan S. H., Hudson E. W., Lang K. M., Eisaki H., Uchida S. & Davis J. C. Imaging the effects of individual zinc impurity atoms on superconductivity in Bi2Sr2CaCu2O8+δ. Nature 403, 746–750 (2000). [DOI] [PubMed] [Google Scholar]
- Hudson E. W. et al. Interplay of magnetism and high-Tc superconductivity at individual Ni impurity atoms in Bi2Sr2CaCu2O8+δ. Nature 411, 920–924 (2001). [DOI] [PubMed] [Google Scholar]
- Jenkins N. et al. Imaging the essential role of spin-fluctuations in high-Tc superconductivity. Phys. Rev. Lett. 103, 227001 (2009). [DOI] [PubMed] [Google Scholar]
- Fischer Ø., Kugler M., Maggio-Aprile I., Berthod C. & Renner C. Scanning tunneling spectroscopy of high-temperature superconductors. Rev. Mod. Phys. 79, 353–419 (2007). [Google Scholar]
- Wei J. et al. Superconducting coherence peak in the electronic excitations of a single-layer Bi2Sr1.6La0.4CuO6+δ cuprate superconductor. Phys. Rev. Lett. 101, 097005 (2008). [DOI] [PubMed] [Google Scholar]
- Sugimoto A. et al. Enhancement of electronic inhomogeneities due to out-of-plane disorder in Bi2Sr2CuO6+δ superconductors observed by scanning tunneling spectroscopy. Phys. Rev. B 74, 094503 (2006). [Google Scholar]
- Wise W. D. et al. Charge-density-wave origin of cuprate checkerboard visualized by scanning tunnelling microscopy. Nat. Phys. 4, 696–699 (2008). [Google Scholar]
- Wise W. D. et al. Imaging nanoscale Fermi-surface variations in an inhomogeneous superconductor. Nat. Phys. 5, 213–216 (2009). [Google Scholar]
- Kugler M., Renner C., Mikheev V., Batey G. & Fischer Ø. A 3He refrigerated scanning tunneling microscope in high magnetic fields and ultrahigh vacuum. Rev. Sci. Instrum. 71, 1475–1478 (2000). [Google Scholar]
- Gao Y., Lee P., Coppens P., Subramania M. A. & Sleight A. W. The incommensurate modulation of the 2212 Bi-Sr-Ca-Cu-O superconductor. Science 241, 954–956 (1988). [DOI] [PubMed] [Google Scholar]
- Giannini E. et al. Growth, structure and physical properties of single crystals of pure and Pb-doped Bi-based high Tc superconductors. Curr. App. Phys. 8, 115–119 (2008). [Google Scholar]
- Slezak J. A. et al. Imaging the impact on cuprate superconductivity of varying the interatomic distances within individual crystal unit cells. Proc. Natl Acad. Sci. USA 105, 3203–3208 (2008). [DOI] [PMC free article] [PubMed] [Google Scholar]


