Abstract
BMP signaling is fundamental to development, injury response, and homeostasis. We have developed transgenic zebrafish that report Smad-mediated BMP signaling in embryos and adults. These lines express either eGFP, destabilized eGFP, or destabilized KO2 under the well-characterized ‘BMP Response Element’ (BRE). These fluorescent proteins were found to be expressed dynamically in regions of known BMP signaling including the developing tailbud, hematopoietic lineage, dorsal eye, brain structures, heart, jaw, fins, and somites, as well as other tissues. Responsiveness to changes in BMP signaling was confirmed by observing fluorescence after activation in an hsp70:bmp2b transgenic background or by inhibition in an hsp70:nog3 background. We further demonstrated faithful reportage by the BRE transgenic lines following chemical repression of BMP signaling using an inhibitor of BMP receptor activity, dorsomorphin. Overall, these lines will serve as valuable tools to explore the mechanisms and regulation of BMP signal during embryogenesis, in tissue maintenance, and during disease.
INTRODUCTION
Bone morphogenic proteins (BMPs) were originally identified by their ability to induce bone formation (Wozney et al, 1988), although their functions are now known to extend beyond this role. For example, BMPs have been shown to regulate patterning and differentiation of multiple tissues, establish cell polarity, maintain organ homeostasis, and mediate injury responses (for review see Miyazono et al, 2009). BMPs comprise a large family within the transforming growth factor-beta (TGF-β) superfamily of secreted signaling factors, and are expressed in both developing and adult tissues. BMPs are synthesized with an N-terminal pro-domain and undergo dimerization during trafficking through the endoplasmic reticulum. The pro-domains are then cleaved prior to secretion of the active dimer. Dimerized BMPs bind to transmembrane receptors (BMP/Activin type I and type II serine/threonin kinase receptors) on the surfaces of recipient cells, which promotes the assembly of an activated heterotetrameric receptor complex. The activated complex subsequently phosphorylates members of the receptor-activated Smad1/5/8 family. The particular Smad phosphorylated is determined not only by its expression pattern, but also by the identity of the receptor bound by the BMP dimer (Rebbapragada et al, 2003). In addition, BMP activation of receptors can lead to Smad-independent signaling, where typically the Erk, JNK, and p38 MAPK pathways are augmented (Derynck and Zhang 2003). For Smad-dependent signaling, phosphorylated Smad1/5/8 translocate to the nucleus following association with co-Smad4 to modulate target gene transcription. The Smad complex binds to short GC-rich DNA regions contained in target gene promoters (for review see Itoh et al, 2000). As the binding affinity of Smads for the GC-rich sites is relatively low compared to that of other DNA-binding proteins, they are frequently arrayed in tandem. In addition, affinity and specificity is augmented through Smad interactions with additional sequence-specific binding partners such as Runx2 or OAZ (Hanai et al, 1999; Hata et al, 2000; Pardali et al, 2000; for review see Blitz and Cho 2009).
The importance of BMP signaling in development and homeostasis is reflected in the large number of factors that modulate signaling at multiple levels (for review see Sieber et al, 2009). Mechanisms of fine-tuning BMP signaling include spatial-temporal regulation of BMP ligand and receptor expression, ligand homo/hetero-dimerization and receptor complex formation, the actions of endocytosis and proteolysis, and by intracellular regulatory proteins (reviewed in Sieber et al, 2009).
Because of the sizeable cohort of positive and negative regulators, expression analysis of any single component of the pathway may not accurately reflect the precise levels of BMP signaling. Recently, however, several strategies have been employed to directly assess active BMP signaling at the cellular level. For example, antibodies have been generated to label phospho-Smads and evaluate nuclear localization (Eivers et al, 2008; Wrighton et al, 2009). Similarly, expression of fusions between specific Smads and fluorescent proteins have been established to dynamically assess complex formation and nuclear trafficking and thus infer signaling (Harvey and Smith 2009). Neither of these techniques, however, addresses the role of co-factors and chromatin-competency states that might affect target gene activation.
In this light, Korchynskyi and ten Dijke experimentally defined specific DNA sequences capable of binding activated Smads and mediating gene transcription. They demonstrated that inhibitor of differentiation-1 (id1) is a direct target of BMP signaling, and is regulated positively by receptor activated Smads, and negatively by inhibitory Smads (Korchynskyi and ten Dijke 2002). Analysis of the id1 promoter refined the BMP-responsive region from -1231 bp to -996 bp relative to the transcriptional start site, and furthermore showed that when two copies of regions -1105 bp to -1080 bp and -1052 bp and -1032 bp were arranged in a head-to-head formation upstream of a minimal adenoviral major late promoter, demonstrated a dose-dependent transcriptional response to BMPs. Within this short region, several GTCT sites (Smad binding elements, SBE) were identified (Dennler et al, 1998; Zawel et al, 1998). In addition, GCCG sites implicated in BMP-responsiveness (Kusanagi et al, 2000; Yoshida et al, 2000) were found. Finally, CGCC and CAGC sites, which had not previously been implicated in BMP-responsiveness, were identified as important for full Smad-mediated activity. This sequence, named the BMP response element (BRE), was placed upstream of either β-galactosidase or luciferase, and used to generate transgenic mice that faithfully expressed reporter activity in tissues associated with BMP signaling (Monteiro et al, 2004). More recently, the BRE coupled to a minimal promoter was placed upstream of enhanced green fluorescent protein (eGFP) and used to generate transgenic mice that allowed direct observation without the need for enzymatic substrate addition (Monteiro et al, 2008).
Here we present the generation of transgenic zebrafish that use the evolutionarily conserved BRE to express eGFP, destabilized d2GFP, or destabilized monomeric Kusabira-Orange (dmKO2). We take advantage of the optical transparency of live zebrafish larvae to show dynamic BMP-responsiveness during development and organogenesis. We found that the larval transgenic zebrafish respond to overexpression of BMPs or their antagonists by increasing or decreasing GFP levels, respectively. We also demonstrate continued expression of the transgene reporters into adulthood and discovered novel regions of BMP-Smad activity. Furthermore, we show the potential of the transgenic larvae as a screening platform for compounds that modulate the effects of BMPs, which are being developed as therapeutic agents for treatment of bone, liver and kidney disease, as well as certain types of cancer.
RESULTS
BRE promoter expresses in regions of zebrafish larvae associated with BMP-Smad 1/5/8 signaling
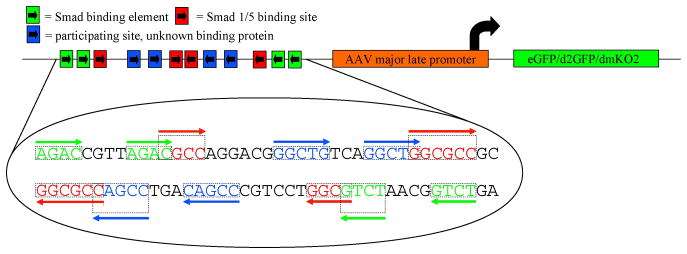
Previous work demonstrated that Smad binding elements identified in the mouse Id1 promoter can report Smad1/5/8 activation initiated by canonical BMP signaling (Korchynskyi and ten Dijke 2002; Monteiro et al, 2004; Monteiro et al, 2008). We placed the 84 bp BMP response element (BRE), containing multiple short Smad-binding sites, and the minimal AAV major late promoter (AAVmlp) upstream of either eGFP, destabilized eGFP, or destabilized Kusabira Orange 2 (dmKO2) to investigate the potential for reporting BMP-Smad1/5/8 signaling in zebrafish (Figure 1). The BRE is highly conserved between mouse, human and zebrafish (Supplemental Figure 1). To investigate functional conservation of the BRE, we generated BRE-AAVmlp:eGFP/d2GFP/dmKO2 constructs using commercially synthesized dsDNA containing the 84 bp BRE and AAVmlp, and the Tol2kit suite of expression vectors (Kwan et al, 2007). These constructs were then used to generate multiple transgenic zebrafish lines to study the pattern of expression conferred by the BRE promoter. One line from each construct was maintained for further analysis. These lines were designated, Tg(BRE-AAVmlp:eGFP)mw29 [or BRE:eGFP], Tg(BRE-AAVmlp:eGFP)mw30 [or BRE:d2GFP], and Tg(BRE-AAVmlp:dmKO2)mw40 [or BRE:dmKO2]
Figure 1.
Schematic of the BRE-reporter construct. Multiple Smad binding elements are arranged in tandem in forward and reverse orientations and placed upstream of the AAV minimal major late promoter (Korchynskyi and ten Dijke, 2002) and used to drive expression of eGFP, destabilized eGFP (d2GFP), or destabilized monomeric Kusabira Orange 2 (dmKO2).
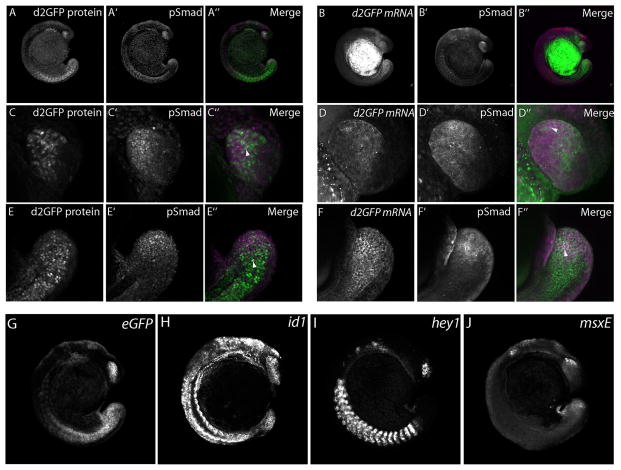
To confirm that the BRE promoter expressed fluorescent proteins in a pattern that faithfully recapitulated Smad1/5/8 phosphorylation, BRE:d2GFP embryos were fixed at 13- to 17-somite stages and processed to co-label phospho-Smad1/5/8 immunoreactivity and d2GFP transcripts. These embryos were also compared to expression patterns of three known BMP-responsive genes, id1, hey1, and msxE (Figure 2; Korchynskyi and ten Dijke 2002; Dahlqvist et al, 2003; Hussein et al, 2003). Although low levels of d2GFP expression was observed in many parts of the embryo, particularly high levels were found in the lower trunk and tail region as previously reported for genes associated with BMP activity (Row and Kimelman 2009), and the developing eye (Figure 2A, C, E). Similarly, Smad1/5/8 phosphorylation was observed robustly in the trunk, tail, and eye (Figure 2A’, C’, E’) although the pattern of expression did not completely overlap with eGFP at the cellular level (Figure 2A’’, C’’, E’’). Higher magnification images of the tailbud and eye showed that d2GFP and phospho-Smad1/5/8 colocalized in some cells, but exclusively labeled d2GFP or phospho-Smad1/5/8 cells were also noted. Similarly, staining for phospho-Smad1/5/8 following detection of d2GFP mRNA showed regional and single-cell co-localization of the transcript and the phosphorylated proteins, but also cells that stained only for d2GFP mRNA or phospho-Smad 1/5/8. We propose that while the BRE promoter reports faithfully on the activity of phosphorylated Smad1/5/8, the delay between promoter activation and d2GFP transcription and translation, coupled with the rapidly dynamic nature of Smad signaling during development, leads to a lag in d2GFP fluorescence as compared to phospho-Smad1/5/8 immunoreactivity. When in situ hybridization was performed using probes specific for eGFP mRNA (under the control of the BRE), and known BMP-regulated genes id1, hey1, and msxE, eGFP transcripts were found to have overlapping expression regions in common with id1 (eye, trunk, tail), hey1 (somites), and msxE (eye, tail) (Figure 2G, H, I, J). Although these genes are known as BMP-responsive, they are not exclusively regulated by BMP signals, and therefore differences between each other and with the BRE transgenic lines are expected.
Figure 2.
Expression of BRE:d2GFP protein and mRNA, and phospho-Smad1/5/8 immunoreactivty in 13 - 17-somite embryos. Whole embryos were imaged for both d2GFP protein (A, C, E) and mRNA (B, D, F) (green) and phospho-Smad1/5/8 immunoreactivity (magenta) (A’ – F’). Note the enriched and overlapping d2GFP and phospho-Smad1/5/8 immunoreactivity in the tail and lower trunk regions. Higher magnification images of the tailbud region showed co-localization of d2GFP protein and mRNA and phospho-Smad1/5/8 immunoreactivity in some cells (arrowheads), although others expressed only d2GFP protein or mRNA, or phospho-Smad1/5/8. Expression of transcripts for known BMP-regulated targets id1, hey1 and msxE (H, I, J) were found in regions associated with the BRE promoter (G).
To evaluate dynamic BRE-driven expression during development, time-lapse imaging was initiated at the sphere stage using BRE:d2GFP transgenic embryos (Supplemental Movie 1). Visualization of all cells in BRE:d2GFP embryos was facilitated by crossing BRE:d2GFP carriers to h2afv-mCherry transgenic fish, which express mCherry in the nuclei in all cells (McMahon et al, 2009). As the embryos developed, d2GFP was observed in the tailbud and migrating mesoderm as it formed the trunk. Strong d2GFP expression was maintained in the developing tail, and became more pronounced in the region of the trunk adjacent to the yolk where the heart and gut organs develop. By the 16 somite stage BRE:d2GFP continued to be expressed in the tailbud and was also initiated in the dorso-temporal part of the eye anlage (Supplemental Movie 2). Shortly thereafter, d2GFP-positive cells emerged from the pharyngeal region to move across the yolk sac and the developing heart became more fluorescent. From approximately 22 somites, d2GFP expression became more dorsally restricted in the developing eye and expression became apparent in the pineal (Supplemental Movies 2 and 3).
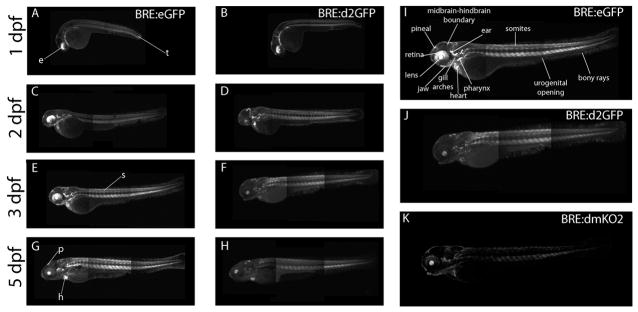
At 1 day post-fertilization (dpf), fluorescent protein expression was observed in the developing somites, heart, otic vesicle, pharyngeal arches, dorsal eye, lens, pineal and other brain regions, as well as sporadic cells in the hatching gland (Figure 3A, B). We observed at this and subsequent stages that the transgenic fish expressing destabilized d2GFP showed reduced levels, but sharper delineation of fluorescent regions, as compared to eGFP-positive embryos. This difference is likely due to the faster turnover of the destabilized reporter. At 2 dpf, GFP expression continued in the developing heart, gut, somites, pineal, dorsal eye and lens, nascent jaw and gill arches, and within the midbrain-hindbrain boundary of the brain (Figure 3C, D). At 3 dpf, GFP expression was maintained in these regions, but was also initiated in cells lining the urogenital opening and in structures of the inner ear (Figure 3E, F, I, J, K). At this time, fish expressing stable eGFP showed robust dorsal expression in the eye; however, those from the destabilized d2GFP- and destabilized dmKO2-expressing lines had abrogated dorsal retinal expression, consistent with down-regulation of BMP signaling with retinal development (Figure 3; Veien et al, 2008; French et al, 2009). At 5 dpf, GFP expression was observed in the heart, pineal, dorsal eye and lens, hindbrain, otic vesicle, gill arches, and somites (Figure 3G, H). GFP was also found along the length of the gut, ending at the urogenital opening. The condensing cartilage of the jaw and other bony structures such as the fins, continued to show high levels of presumptive BMP-Smad signaling. For each fluorophore variant used with the BRE, multiple independent lines were assayed to confirm similar spatial expression profiles and ensure transgene genomic insertion site did not significantly alter expression.
Figure 3.
Expression of eGFP, d2GFP or KO2-PEST driven by the BRE promoter lines during larval development. BRE:eGFP was expressed in the dorsal developing eye (e), somites (s), tail (t), heart (h) and pineal (p) during the first 5 days post fertilization (A, C, E, G). Similarly, d2GFP was found in the same areas, but at lower levels (B, D, F, H). Annotated expression of enlarged view of 3 dpf BRE:eGFP transgenic zebrafish larvae (I), BRE:d2GFP transgenic zebrafish larvae (J), and BRE:KO2-PEST transgenic zebrafish larvae (K). Montaging artifacts are visible in the trunk region at the border of adjacent image frames.
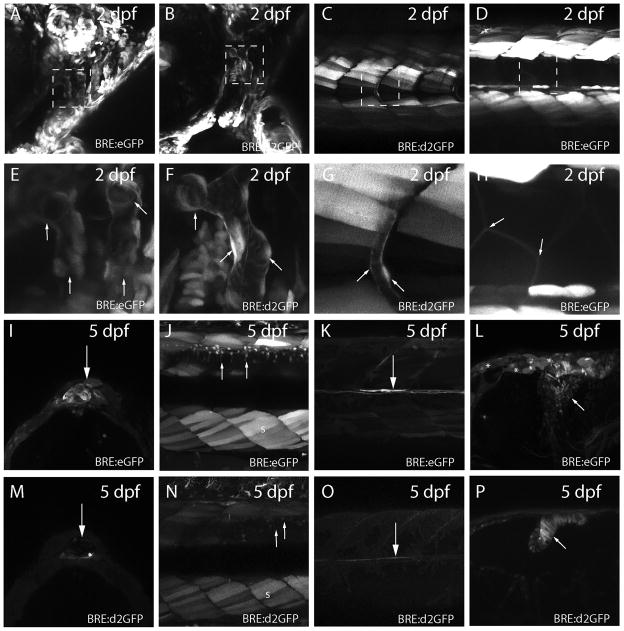
High magnification imaging of BRE:eGFP/d2GFP transgenic larvae revealed subtleties in expression (Figure 4). At 2 dpf the vasculature in the head and intersomitic regions was fluorescent in reporter lines (Figure 4A - G). However, eGFP expression in the intersomitic vasculature could not be discerned in BRE:eGFP larvae, due to saturation of surrounding somites with stable eGFP. Conversely, the cells that line the notochord were positive for eGFP, while equivalent cells were not detected in d2GFP reporter fish, likely due to fluorophore turnover (Figure 4C, D, G, H). At 5 dpf, the pineal was positive in transgenic fish expressing either eGFP or d2GFP, although d2GFP-positive fish had lower levels of fluorescence. Similarly, dorsal spinal neurons, medial longitudinal fasciculus axons, and subsets of midbrain-hindbrain boundary cells were visible in both lines (Figure 4I - P).
Figure 4.
Diverse tissue expression of eGFP or d2GFP in BRE transgenic lines. (A) Expression of eGFP in cranial vasculature of 2 dpf BRE:eGFP larvae. (B) Similar expression of d2GFP in 2 dpf cranial vasculature of BRE:d2GFP larvae. (C) Expression of d2GFP in intersomitic vasculature of 2 dpf BRE:d2GFP larvae. (D) Expression of eGFP in 2 dpf somite muscle cells and underlying notochord cells of BRE:eGFP larvae. (E–H) Higher magnification of boxed regions in A – D. Arrows indicate the vascular structures in E, F, and G; and the somite muscle cells in H. (I) Expression of eGFP in pineal cells of 5 dpf BRE:eGFP larvae (arrow). (J) Expression of eGFP in somite muscle (s) and dorsal spinal neurons (arrows) of 5 dpf BRE:eGFP larvae. (K) Expression of eGFP in medial longitudinal fasciculus axons (arrow) of 5 dpf BRE:eGFP larvae. (L) Expression of eGFP in midbrain-hindbrain neurons (arrow) of 5 dpf BRE:eGFP larvae. Note the ependymal cells that are also weakly eGFP-positive (asterisks). (M) Expression of d2GFP in pineal cells of 5 dpf BRE:d2GFP larvae (arrow). (N) Expression of d2GFP in somite muscle (s) and dorsal spinal neurons (arrows) of 5 dpf BRE:eGFP larvae. (O) Expression of d2GFP in medial longitudinal fasciculus axons (arrow) of 5 dpf BRE:d2GFP larvae. (P) Expression of d2GFP in hindbrain neural progenitor cells (arrow) of 5 dpf BRE:d2GFP larvae.
BRE promoter expresses in adult tissues associated with BMP-Smad 1/5/8 signaling
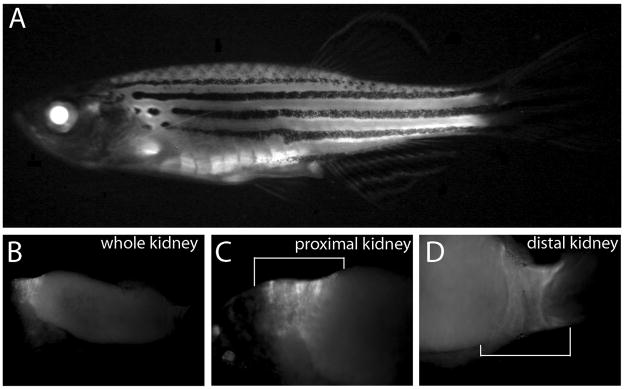
We next imaged adult BRE:eGFP zebrafish for eGFP expression (Figure 5). In anesthetized fish, fluorescence was most obvious in the lens and trunk musculature, but also visible in jaw, sensory barbel adjacent to the mouth, cells around the eyes, the heart and other internal organs of the gut. As an example of fluorescence in an internal organ, isolated kidneys showed eGFP expression in both the proximal and distal regions, which are known sites of BMP activity (Simon et al, 1999; Banas et al, 2007).
Figure 5.
BRE:eGFP in adult fish. (A) eGFP expression viewed in whole fish. (B) Dissected kidney showing eGFP expression (C) Higher magnification of proximal and (C) distal regions (white brackets).
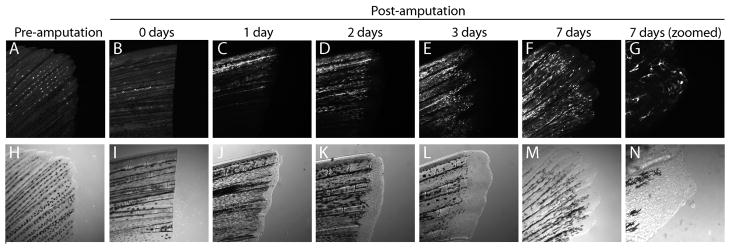
Confocal microscopic imaging of the fins of adult BRE:eGFP zebrafish showed prominent eGFP expression in the bony rays (Figure 6). Previous studies have demonstrated a role for canonical BMP signaling in both fin growth and regeneration (Connors et al, 1999; Bauer et al, 2001; Smith et al, 2006;Schebesta et al, 2006). We therefore investigated expression of the BRE:eGFP transgene during caudal fin regeneration. Amputation of the tip of the caudal fin and subsequent imaging at times during regrowth showed that eGFP expression was first observed in the new fin tissue in a manner that matched previously described patterns of BMP activity (Smith et al., 2006; Schebesta et al, 2006). Enlarged images of the tips of the regenerating tissue at 7 days post-amputation showed eGFP expression in the blastema of the fin, the mass of progenitor cells that enables tissue regeneration.
Figure 6.
Expression of eGFP in regenerating fins of BRE:eGFP adult fish. (A–F) BRE:eGFP expression in adult caudal fins before and during regeneration. Times post-amputation are indicated above each image. Note that BRE:eGFP expression is increased in the regenerating fin tissue following amputation. (G) Magnified view of 7 day post-amputation blastemal cells. (H–N) Corresponding transmitted light images are shown below.
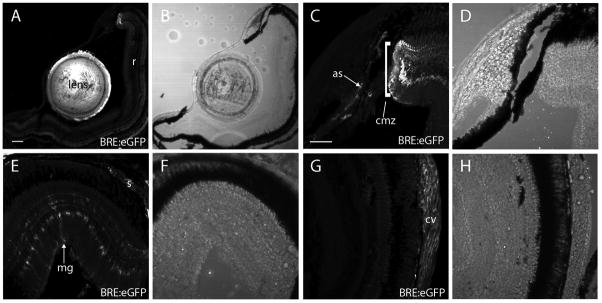
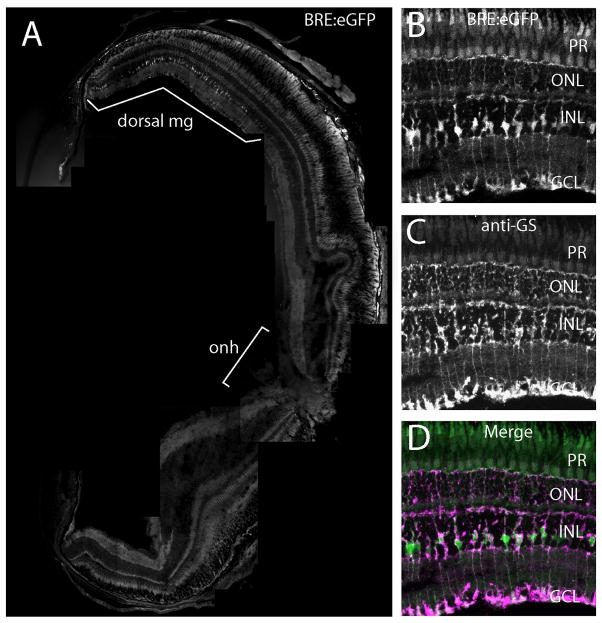
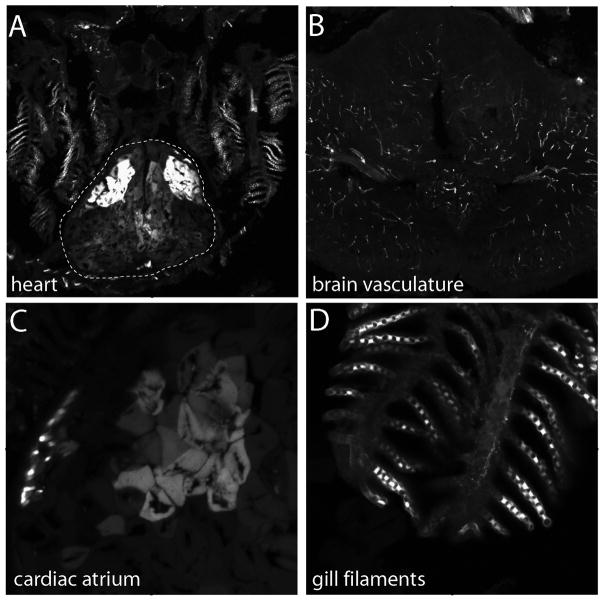
In subsequent studies, we investigated BRE:eGFP expression in adult fish cryosections, focusing on the eye by way of example. In the adult eye, eGFP expression was strong in the lens, sclera, stroma of the anterior segment, iris and dorsal Müller glia (Figure 7). We examined the profile of eGFP expression in Müller glia more closely across the retina, and found a dorsal-high, ventral-low/absent gradient (Figure 8). The eGFP-positive cells in the retina were confirmed as Müller glia by colocalization with glutamine synthetase immunoreactivity, a known marker of Müller glia. Glia associated with the optic nerve head did not express obvious levels of eGFP. Outside of the eye, other noted areas of adult BRE:eGFP expression revealed in cryosections included heart components, brain vasculature, and gill filaments (Figure 9). Regions caudal to the gills were not analyzed by cryosection.
Figure 7.
Adult ocular BRE:eGFP expression revealed in cryosections. (A) BRE:eGFP expression was obvious in the lens and dorsal ciliary margin, but not in the central retina (r). (B) Transmitted light image of A. (C) BRE:eGFP expression in the ciliary marginal zone (cmz) and anterior stromal and vascular cells (as, arrows). (D) Transmitted light image of C. (E) BRE:eGFP expression in dorsal retina showing Müller glia (mg) and scleral cells (s). (F) Transmitted light image of E. (G) BRE:eGFP expression in central retina showing choroidal rete vascular cells (cv). Note the lack of glial expression in the central retina. (H) Transmitted light image of G. Scale bars = 200 μm (A, B), 50 μm (C – H).
Figure 8.
BRE:eGFP expression in adult dorsal Müller glia. (A) Central transverse cryosection of an adult BRE:eGFP eye. Note that the lens was not imaged as part of the montage. Müller glia (mg); optic nerve head (onh). Region showing eGFP-positive Müller glia is indicated with a white bracket. (B) Higher magnification of BRE:eGFP in dorsal Müller glia. (C) Expression of glutamine synthetase immunoreactivity (anti-GS), a Müller glia marker, in the same section as B. (D) Co-localization of B and C.
Figure 9.
BRE:eGFP expression in adult tissues revealed through cryosections. (A) BRE:eGFP expression in the atrium and ventricle of the heart (dotted line) and in the gill filaments. (B) BRE:eGFP expression in the vasculature of the brain. Higher magnification images of the (C) cardiac atrium and (D) gill filaments.
BRE:d2GFP larvae respond to gain and loss of BMP signaling
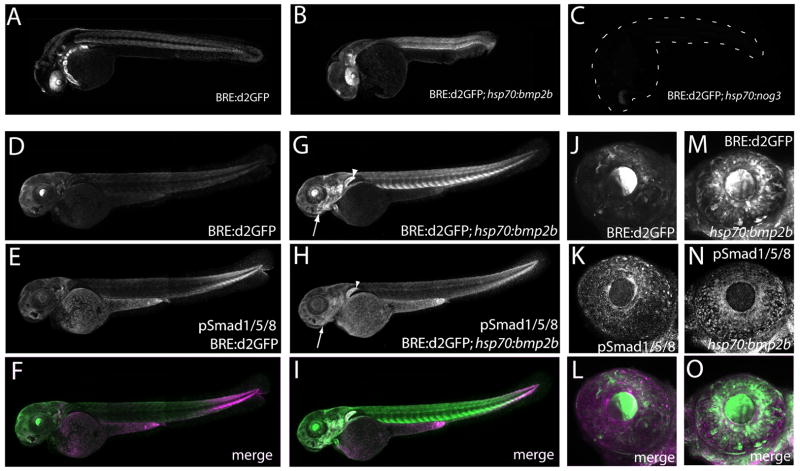
To test whether BRE:d2GFP zebrafish respond to changes in BMP-Smad1/5/8 signaling, we utilized a genetic approach. BMP signaling was increased using the Tg(hsp70l:bmp2b)fr13 line, which globally overexpresses zebrafish Bmp2b in response to heat-shock (Chocron et al, 2007). Reduction in BMP signaling was achieved with the Tg(hsp70l:nog3)fr14 line, which globally overexpresses zebrafish Noggin3, a Bmp signaling inhibitor, following heat-shock (Chocron et al, 2007). Carriers of the bmp2b and noggin3 transgenes were crossed with BRE:d2GFP zebrafish and the resulting embryos were subjected to heat-shock induction. Six hours after a 30 minute heat shock at 37°C at 24 hpf, Tg(BRE-AAVmlp:d2GFP)mw30;Tg(hsp70l:bmp2b)fr13 embryos showed greatly increased d2GFP expression in regions that normally express nominal levels, and novel d2GFP expression where none was previously seen (Figure 10A, B). For example, the dorsal high-ventral low pattern normally observed in the eye was replaced with a more homogeneous expression of eGFP, indicating a disruption of the normal BMP gradient by uniform overexpression of Bmp2b. In contrast, Tg(BRE-AAVmlp:d2GFP)mw30;Tg(hsp70l:nog3)fr14 double transgenic embryos showed reduced d2GFP expression 6 hours after heat shock in regions that normally expressed d2GFP (Figure 10A,C).
Figure 10.
d2GFP levels are altered when BMP activity is manipulated. Overexpression of Bmp2b driven by the inducible hsp70 heat-shock promoter increases d2GFP expression levels (B, E) relative to endogenous BRE:d2GFP in control larvae at 24 hpf when imaged 6 hours after a 30 minute heat shock at 37°C (A, D). Note the loss of the dorsal high-ventral low gradient pattern in the eye which is replaced by a uniformly high level of d2GFP expression. (C) Conversely, inhibition of BMP signaling by hsp70 overexpression of Noggin3 downregulates d2GFP expression. The embryo position is indicated by dashed lines. At 3 dpf, overexpression of Bmp2b increases both d2GFP and pSmad1/5/8 immunoreactivity relative to normal levels, particularly in the jaw (arrow) and pectoral fin (arrowhead) (G, H). In the 3 dpf eye, Bmp2b overexpression increased d2GFP expression and pSmad1/5/8 immunoreactivity (M, N, O).
At 3 dpf, overexpression of Bmp2b similarly induced BRE:d2GFP, and increased Smad1/5/8 phosphorylation was observed relative to larvae expressing endogenous Bmp levels (Figure 10D-O). In particular, the developing jaw and pectoral fin showed elevated phospho-Smad1/5/8 immunoreactivity and d2GFP expression. As with 24 hpf larvae, overexpression of Bmp2b disrupted the ocular dorsal expression pattern leading to a higher, uniform level of both BRE:d2GFP and phospho-Smad1/5/8 immunoreactivity in the eye.
BRE:d2GFP larvae respond to chemical disruption of BMP receptor activity
We next investigated the potential of BRE:d2GFP zebrafish as a platform for small molecule screens to identify agents that affect BMP-Smad1/5/8 signaling. To test pharmacological responsiveness, we used the BMP type I receptor antagonist dorsomorphin (Yu et al, 2008). Treatment of BRE:d2GFP larvae with 50μM dorsomorphin was started at 24 hpf, and reduction in d2GFP was apparent 3 hours later (Figure 11). Three hours after the start of dorsomorphin treatment, d2GFP expression was reduced compared to the DMSO-treated control, notably in the eye, somites, ear, heart, gill arches, and midbrain-hindbrain boundary (Figure 11A–D). To independently verify the effects of dorsomorphin inhibition of BMP receptor function, we treated wild-type 15-somite embryos with 50 μM dorsomorphin, or DMSO control, for 3 hours and performed in situ hybridization to known BMP-regulated genes id1, msxE, and hey1. Following dorsomorphin treatment, id1 RNA levels were strongly reduced (Supplemental Figure 2 A, D) and msxE RNA levels were moderately reduced. RNA levels of hey1 were not noticeably changed, which may reflect regulation of this gene by non-SMAD pathways.
Figure 11.
d2GFP expression driven by the BRE promoter is down-regulated by dorsomorphin. Larvae expressing BRE:d2GFP were treated with DMSO as a control (B, D) or with 50 μM dorsomorphin (A, C) at 24 hpf for 3 hours. d2GFP expression was reduced, particularly in the head and eye following treatment. Magnification: A, B; ×10: C, D; ×40.
DISCUSSION
Here we present the adaptation and validation of a previously characterized BMP response reporter element for use in live zebrafish larvae and adults. The BRE, coupled to a minimal promoter, has been used to characterize BMP-Smad signaling in developing mouse embryos (Monteiro et al, 2004; Monteiro et al, 2008). We utilized the BRE sequence to express fluorophores that can be dynamically monitored in the transparent zebrafish larva as it develops normally. This feature contrasts with existing BMP-responsive reporters in other model systems, which call for embryonic dissection, addition of extraneous compounds to visualize non-fluorescent reporters, or both. The ability of the BRE lines to report BMP-Smad1/5/8 activity was verified by co-expression of nuclear phospho-Smad1/5/8, appropriate responses to genetic and pharmacological manipulations, and predicted expression in a fin regeneration assay. We also showed the value of these lines for dynamic analyses through time-lapse experiments.
To aid in studies of dynamic BMP-Smad signaling we incorporated the destabilized fluorescent protein, d2GFP, which is engineered to be targeted for rapid degradation by the ubiquitinylation pathway (Li et al, 1998). We found that use of this reporter refines the fluorescent signal to more acute signaling events, owing to its shorter half-life as compared to eGFP. A potential caveat with using d2GFP to assess the relative levels of BMP signaling across tissues or developmental stages, is that the enhanced rate of reporter turnover relies on availability of E3 ubiquitin ligases, which may be differentially expressed across tissues or developmental times. Similarly, a BRE:dmKO2-expressing line was generated to provide flexibility when using the BRE in conjunction with other GFP-based transgenes.
In addition to larvae, the BRE transgenic lines continue to express during maturation and into adulthood, opening their utility for studying homeostasis, disease and regeneration. Analysis of adults also facilitated discovery of novel sites of BMP-Smad activity, such as dorsal Müller glia in the retina. We do not know the function of the BMP activity gradient in the Müller glia across the retina, but note that intense light-mediated photoreceptor stress in zebrafish results in extensive photoreceptor loss in dorsal and central regions, while ventral areas suffer less damage (Vihtelic et al, 2006). Potentially, the dorsal-most Müller glia may be differentially primed to respond to damage compared to those in the ventral retina.
Reporter lines such as those described here, while useful, have limitations. In particular, consensus and/or optimal transcription factor response elements seldom fully recapitulate all temporal or spatial expression induced by native signaling and when multimerized can potentially introduce novel responses. It is likely that some cells or tissues that participate in active BMP-Smad signaling do not show GFP expression in our transgenic lines; and conversely, that some GFP-positive cells may over-represent the levels of BMP signaling. In addition, while Smads 1/5/8 are primarily phosphorylated through BMP signaling, activation of these Smads by non-BMP factors, such as TGFβ receptors (Wrighton et al, 2009), should also be reported by the BRE promoter. This could partly explain the non-uniform down-regulation across different tissues in the BRE lines by the BMP-specific inhibitor dorsomorphin. Nonetheless, these transgenic lines complement existing reagents and provide a valuable and convenient tool for studying the complexities and dynamics of BMP-Smad signaling.
EXPERIMENTAL PROCEDURES
Zebrafish maintenance
Zebrafish (Danio rerio) were maintained at 28.5°C on an AHAB recirculating filtered water system (Aquatic Habitats, Apopka, FL) on a 14 h light: 10 h dark lighting cycle. Zebrafish embryos were obtained by natural spawning and were placed in system water after fertilization unless used for microinjection. Where necessary, system water was supplemented with 0.003% phenylthiourea to inhibit melanin synthesis during larval development.
Transgenic lines
Tg(BRE-AAVmlp:eGFP)mw29 (this study)
Tg(BRE-AAVmlp:d2GFP)mw30 (this study)
Tg(BRE-AAVmlp:dmKO2)mw40 (this study)
Tg(h2afx:h2afv-mCherry)mw3 (McMahon et al., 2009)
Tg(hsp70l:bmp2b)fr13 (Chocron et al., 2007)
Tg(hsp70l:nog3)fr14 (Chocron et al., 2007)
Generation of Tg(BRE-AAVmlp:eGFP/d2GFP) transgenic zebrafish lines
The BMP response element (BRE) derived from mouse Id1 promoter Smad-binding elements upstream of the adeno-associated virus major late promoter (BRE-AAVmlp; Fig. 1) (Korchynskyi and ten Dijke 2002) was synthesized with Gateway-compatible att entry sites (GENEART, Inc., Burlingame, CA). Final constructs for transgenic line generation were assembled by Gateway LR reactions (Invitrogen, Carlsbad, CA) to place the BRE-AAVmlp promoter upstream of eGFP, destabilized eGFP with a C-terminal PEST domain from mouse ornithine decarboxylase (d2GFP; Clontech, Mountain View, CA), or destabilized mKO2 with a C-terminal PEST domain from zebrafish Notch3 to facilitate rapid degradation via ubiquitinylation (Yeo et al, 2007, Karasawa et al, 2004, B. Clark, unpublished). Plasmid DNA containing the BRE-AAVmlp:eGFP/d2GFP/dmKO2 constructs contained flanking Tol2 inverted repeats (Kwan et al, 2007) and were co-injected with in vitro-transcribed Tol2 transposase mRNA at 25 ng/μl into 1- to 2-cell zebrafish eggs using a Nanoject II microinjection apparatus. Surviving embryos were raised to adulthood and screened for germline transmission of BRE-AAVmlp:eGFP/d2GFP/dmKO2 transgenes. Multiple independent lines for each transgene were generated, and bred through multiple generations until patterns of Mendelian inheritance demonstrated that the number of inserted transgenes per genome had been reduced to one. For time-lapse developmental imaging series, BRE-AAVmlp:d2GFP lines were crossed to Tg(h2afx:H2A-mCherry)mw3 to allow visualization of the whole embryo during development.
Overexpression and Inhibition of BMPs using Transgenic lines
Transgenic lines Tg(hsp70l:bmp2b)fr13 and Tg(hsp70l:nog3)fr14 (obtained by Zebrafish International Resource Center (ZIRC), Eugene, OR) were used to activate and inhibit BMP signaling, respectively. Embryos were verified as transgenic by finclip PCR genotype screening for FLAG fusion tags at the N-terminus of the transgene. Primers:
FLAG-F 5′…CGCAGGAAAGAACATGTGAGC…3′,
FLAG-R 5′…CGGGTTGGACTCAAGACGATAG…3′
Tg carriers yielded a 500 bp band following PCR amplification for 25 cycles with annealing at 55°C. BRE-AAVmlp:d2GFP fish were crossed to Tg(hsp70l:bmp2b)fr13 or Tg(hsp70l:nog3)fr14 transgenic fish and the offspring examined for eGFP expression patterns. Heat-shock was carried out at 24 hpf for 30 mins by immersing the larvae in 15 ml polypropylene tubes to a 37°C water bath before returning to 28.5°C in Petri dishes containing system water supplemented with PTU. Examination of d2GFP expression profiles was carried out 6 hours after heat shock.
Chemical Inhibition of BMP Signaling
Dorsomorphin (P5499; Sigma-Aldrich, St Louis, MO) was dissolved in dimethyl sulfoxide (DMSO) to 100 mM concentration for long-term storage at −20°C. Zebrafish embryos were treated with 50 μM DMSO (final DMSO concentration at 0.05%) starting at 24 hpf before examination for d2GFP expression profiles at 3 hours and 24 hours after initiation of dorsomorphin treatment. As controls, larvae were treated with DMSO vehicle alone at the same final concentration as the dorsomorphin-treated larvae. Verification of the inhibitory effects of dorsomorphin on BMP signaling was carried out by treating 13- 17-somite embryos with 50 μM dorsomorphin, or DMSO control, for 3 hours followed by in situ hybridization.
Fluorescent Microscopy
Larval zebrafish raised in PTU were screened for transgenic GFP expression using a Leica MZFLIII fluorescent dissection microscope. Transgenic larvae were anesthetized using 20 microgram per milliliter tricaine (Sigma Aldrich, St Louis, MO) and embedding in 1% low-melting point agarose in a glass-bottomed Petri dish before imaging using Nikon Eclipse E800 confocal microscope. Time-lapse imaging during larval development was performed with anesthesia and immobilized in 1% low-melting agarose as above, in addition to submerging the agarose-embedded larva in tricaine solution. Images were assembled using the Nikon EZ-C1 viewer (Nikon Instruments, Melville, NY) and Adobe Photoshop and Illustrator software (Adobe Systems Inc., San Jose, CA). Movies were created using MetaMorph software (Universal Imaging, Philadelphia, PA).
Immunohistochemistry
Adult and larval zebrafish were fixed overnight at 4°C in 4% formaldehyde in PBS. Samples for cryosectioning were equilibrated through a sucrose gradient series before embedding in cryoprotectant and freezing at −20°C. Twelve micrometer sections were cut using a cryostat and thaw-mounted onto Superfrost Plus slides. These were rehydrated using PBS washes before mounting with Vectashield (Vector Labs, Burlingame, CA). Larval samples for wholemount immunohistochemistry were blocked using 2% donkey serum, 1% Tween-20, 1% Trition X-100 in PBS for 1 hour before incubating overnight at room temperature with primary antibodies at 1:100 dilution in blocking buffer. Secondary antibodies were applied following 3 1-hour washes in PBST at a 1:1000 dilution. Primary antibodies used were anti-phospho-Smad1 (Ser463/465)/ Smad5 (Ser463/465)/ Smad8 (Ser426/428) (#9511; Cell Signaling Technology, Beverly, MA), anti-glutamine synthetase ((#610517; BD Biosciences, San Jose, CA). Secondary antibodies were donkey anti-mouse-rhodamine red and donkey anti-rabbit-rhodamine red ((#715–295–151; #711–295–152; Jackson ImmunoResearch Labs Inc., West Grove, PA).
Supplementary Material
Supplemental Fig. 1. Alignment of mouse, human and zebrafish Id1 promoter sequences corresponding to native BMP response elements. Smad 1/5 binding sites, unknown protein binding sites, and Smad binding element sites are highlighted in red, blue and green, respectively. Asterisks indicate identical nucleotides between all three species. Numbers at the right side of the alignment indicate positions relative to transcriptional start sites based on Ensembl genome databases (mouse assembly version NCBI m37; human assembly version GRCh37; zebrafish assembly version Zv8).
Supplemental Figure 2. Treatment of 13 - 17-somite embryos with 50 μM dorsomorphin, or DMSO control, for 3 hours downregulates mRNA levels of BMP-regulated genes by varying degrees: strongly, id1 (A, D); moderately, msxE (B, E); no observed change, hey1 (C, F).
Supplemental Movie 1. Movie of Tg(BRE-AAVmlp:d2GFP)mw30; Tg(h2afx:h2afvmCherry)mw3 embryos from sphere stage to 18 somite stage. Confocal images were collected every 25 minutes to document expression of d2GFP (green) and H2A-mCherry (red). Final movies show compressed Z-planes. d2GFP is enriched in mesodermal tissues, particularly the lower trunk and tail.
Supplemental Movie 2. Movie of Tg(BRE-AAVmlp:d2GFP)mw30; Tg(h2afx:h2afvmCherry)mw3 embryos from 16 somite to 24 hpf. Confocal images were collected every 25 minutes to document expression of d2GFP (green) and H2A-mCherry (red). Final movies shows compressed Z-planes. d2GFP localizes to the heart and continues to express strongly in the tail. d2GFP increases within the dorsal retina and lens.
Supplemental Movie 3. Movie of Tg(BRE-AAVmlp:d2GFP)mw30; Tg(h2afx:h2afvmCherry)mw3 eye from 22–34 hpf. Confocal images were collected every 25 minutes to document expression of d2GFP (green) and H2A-mCherry (red). Final movies shows compressed Z-planes. d2GFP localizes to the dorsal part of the retina and lens during development. Note also d2GFP-positive cells in the trigeminal ganglion temporal to the eye, and the periocular mesechyme moving anteriorly above the developing eye.
Acknowledgments
This work was supported by Grant Sponsor: National Institutes of Health; Grant number: R01EY016060 (BAL)
We are grateful to Anitha Ponnuswami for assistance with molecular biology, and to Michael Cliff, Thomas Waeltz, William Hudzinski, Joseph Hudzinski and Courtney Mendini for zebrafish husbandry. We thank Kala Schilter and Elena Semina, PhD, for sharing the id1 in situ probe. Finally we thank Dr. Christine Mummery for sharing plasmids and sequence.
References
- Banas MC, Parks WT, Hudkins KL, Banas B, Holdren M, Iyoda M, Wietecha TA, Kowalewska J, Liu G, Alpers CE. Localization of TGF-beta signaling intermediates Smad2, 3, 4, and 7 in developing and mature human and mouse kidney. J Histochem Cytochem. 2007;55(3):275–85. doi: 10.1369/jhc.6A7083.2006. [DOI] [PubMed] [Google Scholar]
- Bauer H, Lele Z, Rauch GJ, Geisler R, Hammerschmidt M. The type I serine/threonine kinase receptor Alk8/Lost-a-fin is required for Bmp2b/7 signal transduction during dorsoventral patterning of the zebrafish embryo. Development. 2001;128(6):849–58. doi: 10.1242/dev.128.6.849. [DOI] [PubMed] [Google Scholar]
- Blitz IL, Cho KW. Finding partners: how BMPs select their targets. Dev Dyn. 2009;238(6):1321–31. doi: 10.1002/dvdy.21984. [DOI] [PubMed] [Google Scholar]
- Connors SA, Trout J, Ekker M, Mullins MC. The role of tolloid/mini fin in dorsoventral pattern formation of the zebrafish embryo. Development. 1999;126(14):3119–30. doi: 10.1242/dev.126.14.3119. [DOI] [PubMed] [Google Scholar]
- Dahlqvist C, Blokzijl A, Chapman G, Falk A, Dannaeus K, Ibanez CF, Lendahl U. Functional Notch signaling is required for BMP4-induced inhibition of myogenic differentiation. Development. 2003;130(24):6089–99. doi: 10.1242/dev.00834. [DOI] [PubMed] [Google Scholar]
- Dennler S, Itoh S, Vivien D, ten Dijke P, Huet S, Gauthier JM. Direct binding of Smad3 and Smad4 to critical TGF beta-inducible elements in the promoter of human plasminogen activator inhibitor-type 1 gene. Embo J. 1998;17(11):3091–100. doi: 10.1093/emboj/17.11.3091. [DOI] [PMC free article] [PubMed] [Google Scholar]
- Derynck R, Zhang YE. Smad-dependent and Smad-independent pathways in TGF-beta family signalling. Nature. 2003;425(6958):577–84. doi: 10.1038/nature02006. [DOI] [PubMed] [Google Scholar]
- Eivers E, Fuentealba LC, De Robertis EM. Integrating positional information at the level of Smad1/5/8. Curr Opin Genet Dev. 2008;18(4):304–10. doi: 10.1016/j.gde.2008.06.001. [DOI] [PMC free article] [PubMed] [Google Scholar]
- French CR, Erickson T, French DV, Pilgrim DB, Waskiewicz AJ. Gdf6a is required for the initiation of dorsal-ventral retinal patterning and lens development. Dev Biol. 2009;333(1):37–47. doi: 10.1016/j.ydbio.2009.06.018. [DOI] [PubMed] [Google Scholar]
- Hanai J, Chen LF, Kanno T, Ohtani-Fujita N, Kim WY, Guo WH, Imamura T, Ishidou Y, Fukuchi M, Shi MJ, Stavnezer J, Kawabata M, Miyazono K, Ito Y. Interaction and functional cooperation of PEBP2/CBF with Smads. Synergistic induction of the immunoglobulin germline Calpha promoter. J Biol Chem. 1999;274(44):31577–82. doi: 10.1074/jbc.274.44.31577. [DOI] [PubMed] [Google Scholar]
- Harvey SA, Smith JC. Visualisation and quantification of morphogen gradient formation in the zebrafish. PLoS Biol. 2009;7(5):e1000101. doi: 10.1371/journal.pbio.1000101. [DOI] [PMC free article] [PubMed] [Google Scholar]
- Hata A, Seoane J, Lagna G, Montalvo E, Hemmati-Brivanlou A, Massague J. OAZ uses distinct DNA- and protein-binding zinc fingers in separate BMP-Smad and Olf signaling pathways. Cell. 2000;100(2):229–40. doi: 10.1016/s0092-8674(00)81561-5. [DOI] [PubMed] [Google Scholar]
- Hussein SM, Duff EK, Sirard C. Smad4 and beta-catenin co-activators functionally interact with lymphoid-enhancing factor to regulate graded expression of Msx2. J Biol Chem. 2003;278(49):48805–14. doi: 10.1074/jbc.M305472200. [DOI] [PubMed] [Google Scholar]
- Itoh S, Itoh F, Goumans MJ, Ten Dijke P. Signaling of transforming growth factor-beta family members through Smad proteins. Eur J Biochem. 2000;267(24):6954–67. doi: 10.1046/j.1432-1327.2000.01828.x. [DOI] [PubMed] [Google Scholar]
- Karasawa S, Araki T, Nagai T, Mizuno H, Miyawaki A. Cyan-emitting and orange-emitting fluorescent proteins as a donor/acceptor pair for fluorescence resonance energy transfer. Biochem J. 2004;381(Pt 1):307–12. doi: 10.1042/BJ20040321. [DOI] [PMC free article] [PubMed] [Google Scholar]
- Korchynskyi O, ten Dijke P. Identification and functional characterization of distinct critically important bone morphogenetic protein-specific response elements in the Id1 promoter. J Biol Chem. 2002;277(7):4883–91. doi: 10.1074/jbc.M111023200. [DOI] [PubMed] [Google Scholar]
- Kusanagi K, Inoue H, Ishidou Y, Mishima HK, Kawabata M, Miyazono K. Characterization of a bone morphogenetic protein-responsive Smad-binding element. Mol Biol Cell. 2000;11(2):555–65. doi: 10.1091/mbc.11.2.555. [DOI] [PMC free article] [PubMed] [Google Scholar]
- Kwan KM, Fujimoto E, Grabher C, Mangum BD, Hardy ME, Campbell DS, Parant JM, Yost HJ, Kanki JP, Chien CB. The Tol2kit: a multisite gateway-based construction kit for Tol2 transposon transgenesis constructs. Dev Dyn. 2007;236(11):3088–99. doi: 10.1002/dvdy.21343. [DOI] [PubMed] [Google Scholar]
- Li X, Zhao X, Fang Y, Jiang X, Duong T, Fan C, Huang CC, Kain SR. Generation of destabilized green fluorescent protein as a transcription reporter. J Biol Chem. 1998;273(52):34970–5. doi: 10.1074/jbc.273.52.34970. [DOI] [PubMed] [Google Scholar]
- McMahon C, Gestri G, Wilson SW, Link BA. Lmx1b is essential for survival of periocular mesenchymal cells and influences Fgf-mediated retinal patterning in zebrafish. Dev Biol. 2009;332(2):287–98. doi: 10.1016/j.ydbio.2009.05.577. [DOI] [PMC free article] [PubMed] [Google Scholar]
- Miyazono K, Kamiya Y, Morikawa M. Bone morphogenetic protein receptors and signal transduction. J Biochem. 2009;147(1):35–51. doi: 10.1093/jb/mvp148. [DOI] [PubMed] [Google Scholar]
- Monteiro RM, de Sousa Lopes SM, Bialecka M, de Boer S, Zwijsen A, Mummery CL. Real time monitoring of BMP Smads transcriptional activity during mouse development. Genesis. 2008;46(7) doi: 10.1002/dvg.20402. spcone. [DOI] [PubMed] [Google Scholar]
- Monteiro RM, de Sousa Lopes SM, Korchynskyi O, ten Dijke P, Mummery CL. Spatio-temporal activation of Smad1 and Smad5 in vivo: monitoring transcriptional activity of Smad proteins. J Cell Sci. 2004;117(Pt 20):4653–63. doi: 10.1242/jcs.01337. [DOI] [PubMed] [Google Scholar]
- Pardali E, Xie XQ, Tsapogas P, Itoh S, Arvanitidis K, Heldin CH, ten Dijke P, Grundstrom T, Sideras P. Smad and AML proteins synergistically confer transforming growth factor beta1 responsiveness to human germ-line IgA genes. J Biol Chem. 2000;275(5):3552–60. doi: 10.1074/jbc.275.5.3552. [DOI] [PubMed] [Google Scholar]
- Rebbapragada A, Benchabane H, Wrana JL, Celeste AJ, Attisano L. Myostatin signals through a transforming growth factor beta-like signaling pathway to block adipogenesis. Mol Cell Biol. 2003;23(20):7230–42. doi: 10.1128/MCB.23.20.7230-7242.2003. [DOI] [PMC free article] [PubMed] [Google Scholar]
- Row RH, Kimelman D. Bmp inhibition is necessary for post-gastrulation patterning and morphogenesis of the zebrafish tailbud. Dev Biol. 2009;329(1):55–63. doi: 10.1016/j.ydbio.2009.02.016. [DOI] [PMC free article] [PubMed] [Google Scholar]
- Schebesta M, Lien CL, Engel FB, Keating MT. Transcriptional profiling of caudal fin regeneration in zebrafish. ScientificWorldJournal. 2006;6(Suppl 1):38–54. doi: 10.1100/tsw.2006.326. [DOI] [PMC free article] [PubMed] [Google Scholar]
- Sieber C, Kopf J, Hiepen C, Knaus P. Recent advances in BMP receptor signaling. Cytokine Growth Factor Rev. 2009;20(5–6):343–55. doi: 10.1016/j.cytogfr.2009.10.007. [DOI] [PubMed] [Google Scholar]
- Simon M, Maresh JG, Harris SE, Hernandez JD, Arar M, Olson MS, Abboud HE. Expression of bone morphogenetic protein-7 mRNA in normal and ischemic adult rat kidney. Am J Physiol. 1999;276(3 Pt 2):F382–9. doi: 10.1152/ajprenal.1999.276.3.F382. [DOI] [PubMed] [Google Scholar]
- Smith A, Avaron F, Guay D, Padhi BK, Akimenko MA. Inhibition of BMP signaling during zebrafish fin regeneration disrupts fin growth and scleroblasts differentiation and function. Dev Biol. 2006;299(2):438–54. doi: 10.1016/j.ydbio.2006.08.016. [DOI] [PubMed] [Google Scholar]
- Veien ES, Rosenthal JS, Kruse-Bend RC, Chien CB, Dorsky RI. Canonical Wnt signaling is required for the maintenance of dorsal retinal identity. Development. 2008;135(24):4101–11. doi: 10.1242/dev.027367. [DOI] [PMC free article] [PubMed] [Google Scholar]
- Vihtelic TS, Soverly JE, Kassen SC, Hyde DR. Retinal regional differences in photoreceptor cell death and regeneration in light-lesioned albino zebrafish. Exp Eye Res. 2006;82(4):558–75. doi: 10.1016/j.exer.2005.08.015. [DOI] [PubMed] [Google Scholar]
- Wozney JM, Rosen V, Celeste AJ, Mitsock LM, Whitters MJ, Kriz RW, Hewick RM, Wang EA. Novel regulators of bone formation: molecular clones and activities. Science. 1988;242(4885):1528–34. doi: 10.1126/science.3201241. [DOI] [PubMed] [Google Scholar]
- Wrighton KH, Lin X, Yu PB, Feng XH. Transforming Growth Factor {beta} Can Stimulate Smad1 Phosphorylation Independently of Bone Morphogenic Protein Receptors. J Biol Chem. 2009;284(15):9755–63. doi: 10.1074/jbc.M809223200. [DOI] [PMC free article] [PubMed] [Google Scholar]
- Yeo SY, Kim M, Kim HS, Huh TL, Chitnis AB. Fluorescent protein expression driven by her4 regulatory elements reveals the spatiotemporal pattern of Notch signaling in the nervous system of zebrafish embryos. Dev Biol. 2007;301(2):555–67. doi: 10.1016/j.ydbio.2006.10.020. [DOI] [PubMed] [Google Scholar]
- Yoshida Y, Tanaka S, Umemori H, Minowa O, Usui M, Ikematsu N, Hosoda E, Imamura T, Kuno J, Yamashita T, Miyazono K, Noda M, Noda T, Yamamoto T. Negative regulation of BMP/Smad signaling by Tob in osteoblasts. Cell. 2000;103(7):1085–97. doi: 10.1016/s0092-8674(00)00211-7. [DOI] [PubMed] [Google Scholar]
- Yu PB, Hong CC, Sachidanandan C, Babitt JL, Deng DY, Hoyng SA, Lin HY, Bloch KD, Peterson RT. Dorsomorphin inhibits BMP signals required for embryogenesis and iron metabolism. Nat Chem Biol. 2008;4(1):33–41. doi: 10.1038/nchembio.2007.54. [DOI] [PMC free article] [PubMed] [Google Scholar]
- Zawel L, Dai JL, Buckhaults P, Zhou S, Kinzler KW, Vogelstein B, Kern SE. Human Smad3 and Smad4 are sequence-specific transcription activators. Mol Cell. 1998;1(4):611–7. doi: 10.1016/s1097-2765(00)80061-1. [DOI] [PubMed] [Google Scholar]
Associated Data
This section collects any data citations, data availability statements, or supplementary materials included in this article.
Supplementary Materials
Supplemental Fig. 1. Alignment of mouse, human and zebrafish Id1 promoter sequences corresponding to native BMP response elements. Smad 1/5 binding sites, unknown protein binding sites, and Smad binding element sites are highlighted in red, blue and green, respectively. Asterisks indicate identical nucleotides between all three species. Numbers at the right side of the alignment indicate positions relative to transcriptional start sites based on Ensembl genome databases (mouse assembly version NCBI m37; human assembly version GRCh37; zebrafish assembly version Zv8).
Supplemental Figure 2. Treatment of 13 - 17-somite embryos with 50 μM dorsomorphin, or DMSO control, for 3 hours downregulates mRNA levels of BMP-regulated genes by varying degrees: strongly, id1 (A, D); moderately, msxE (B, E); no observed change, hey1 (C, F).
Supplemental Movie 1. Movie of Tg(BRE-AAVmlp:d2GFP)mw30; Tg(h2afx:h2afvmCherry)mw3 embryos from sphere stage to 18 somite stage. Confocal images were collected every 25 minutes to document expression of d2GFP (green) and H2A-mCherry (red). Final movies show compressed Z-planes. d2GFP is enriched in mesodermal tissues, particularly the lower trunk and tail.
Supplemental Movie 2. Movie of Tg(BRE-AAVmlp:d2GFP)mw30; Tg(h2afx:h2afvmCherry)mw3 embryos from 16 somite to 24 hpf. Confocal images were collected every 25 minutes to document expression of d2GFP (green) and H2A-mCherry (red). Final movies shows compressed Z-planes. d2GFP localizes to the heart and continues to express strongly in the tail. d2GFP increases within the dorsal retina and lens.
Supplemental Movie 3. Movie of Tg(BRE-AAVmlp:d2GFP)mw30; Tg(h2afx:h2afvmCherry)mw3 eye from 22–34 hpf. Confocal images were collected every 25 minutes to document expression of d2GFP (green) and H2A-mCherry (red). Final movies shows compressed Z-planes. d2GFP localizes to the dorsal part of the retina and lens during development. Note also d2GFP-positive cells in the trigeminal ganglion temporal to the eye, and the periocular mesechyme moving anteriorly above the developing eye.


