Abstract
Motivation: Paired-end whole transcriptome sequencing provides evidence for fusion transcripts. However, due to the repetitiveness of the transcriptome, many reads have multiple high-quality mappings. Previous methods to find gene fusions either ignored these reads or required additional longer single reads. This can obscure up to 30% of fusions and unnecessarily discards much of the data.
Results: We present a method for using paired-end reads to find fusion transcripts without requiring unique mappings or additional single read sequencing. Using simulated data and data from tumors and cell lines, we show that our method can find fusions with ambiguously mapping read pairs without generating numerous spurious fusions from the many mapping locations.
Availability: A C++ and Python implementation of the method demonstrated in this article is available at http://exon.ucsd.edu/ShortFuse.
Contact: mckinsel@ucsd.edu
Supplementary information: Supplementary data are available at Bioinformatics online.
1 INTRODUCTION
The discovery of chimeric transcripts emerging from different and potentially distant genes has introduced another layer of complexity to the genome (Gingeras, 2009). Additionally, the importance of fusion transcripts in the genesis and progression of cancer is becoming increasingly apparent (Mitelman et al., 2004; Perner et al., 2008; Yu et al., 2010a). Fusion transcripts may be the product of trans-splicing, the joining of two different transcripts emerging from distinct and often distant genes. This is especially common among lower eukaryotes (Krause and Hirsh, 1987; Sutton and Boothroyd, 1986) where trans-splicing is part of normal transcript processing (Rajkovic et al., 1990). However, trans-splicing has also been observed in higher eukaryotes, including humans (Horiuchi and Aigaki, 2006). Additionally, fusions may be produced by adjacent genes yielding a single, joined RNA product, creating a read-through transcript (Akiva et al., 2006). Fusion transcripts can also result from genomic rearrangement that brings together two once distant regions of the genome. Probably the best known example of this type of fusion is BCR-ABL1, a product of a chromosomal translocation (Shtivelman et al., 1985) found in many hematologic cancers and a successful drug target (Druker et al., 2001). In addition, a growing list of fusion genes are being found in both hematologic and solid tumors that are the product of genomic lesions or trans-splicing (Edwards, 2010). Thus, the study of fusion transcripts has implications clinically as well for our basic understanding of the genome.
The development of high-throughput sequencing methods such as RNA-Seq (Wang et al., 2009) has offered an opportunity to hasten a fuller characterization of the transcriptome (Carninci, 2009), including the identification of fusion transcripts. Maher et al. (2009a, b) demonstrated the potential of the technology by applying transcriptome sequencing to several tumors and cancer cell lines. Using two different sequencing protocols, they were able to detect known fusions such as TMPRSS2-ERG (Tomlins et al., 2005) in a prostate cancer cell line and BCR-ABL1 in a leukemia cell line. Additionally, they identified and experimentally confirmed multiple previously unidentified fusions. Later, Berger et al. (2010) carried out similar work on the melanoma transcriptome, finding 11 novel fusions.
Alongside these biological discoveries has been the development of computational tools and frameworks for the detection of fusion transcripts from RNA-Seq data. Ameur et al. (2010) developed a method for joining partial alignments of single RNA-Seq reads to find splice junctions and gene fusions. Upon application of the method to a public dataset, they found hundreds of examples of transcripts that apparently spanned different chromosomes but were doubtful that many were genuine fusion genes. Hu et al. (2010) created a probabilistic method for aligning RNA-Seq read pairs that uses expectation–maximization (EM) to find maximum-likelihood alignments. They showed that paired-end reads better cover splice junctions than single reads and that their method can reliably identify splice junctions. Then, by augmenting their approach with long single reads, they were able to identify 18 gene fusions in two cancer cell lines.
Common to all of these efforts has been the requirement that a fusion transcript be supported by reads that map uniquely to the genome or transcriptome. Maher and colleagues required single best-hit mappings to the genome or mapped short, 36 nt Illumina paired-end reads to sequences derived from ∼230 nt Roche 454 reads. Berger et al. (2010) required paired-end reads to map uniquely and at least one end of a read to unambiguously map to a junction between exons. Ameur et al. (2010) required each partial alignment for each read to be unique. Hu et al. (2010) considered fusion discovery with short paired-end reads infeasible and found putative fusions with uniquely mapping 75 nt single reads. These strategies highlight a key difficulty in the analysis of transcriptome sequencing data: the transcriptome is filled with repetitive and similar sequences, and many reads cannot be unambiguously mapped to a reference. Some of the repetitiveness is attributable to known repeat families such as the Alu repeat sequence, which can be found both in 5′- and 3′-UTRs as well as occasionally in coding sequence (Yulug et al., 1995). Additionally, many genes are part of gene families or have paralogs or expressed pseudogenes and thus share sequence homology with other parts of the transcriptome. Reads mapping to these genes or regions of these genes will often map well to other loci.
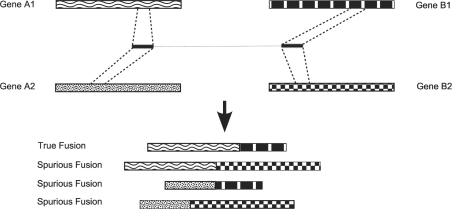
Ambiguously mapped reads are a concern for all transcriptome sequencing analyses and have previously been addressed by discarding them (Carninci et al., 2005) or by proportionately allocating them over the different positions to which they map (Faulkner et al., 2008; Mortazavi et al., 2008). However, this issue becomes more prominent for gene fusions because combinations of mappings are considered. Consider, for example, a fusion between a pair of genes, A1 and B1. It is possible that a read pair that maps to this fusion will also map to paralogs of each gene, say A2 and B2. If all of these mappings were accepted as true, then three spurious fusions would be called (Fig. 1). If the read pair was discarded because of its ambiguous mappings, evidence for the true fusion would be disregarded. As we detail below, our simulations indicate that these ambiguously mapping reads are present in up to 30% of the possible gene fusions, underscoring the significance of the problem.
Fig. 1.
A read pair that maps to a fusion between genes A1 and B1 may also map to homologous genes, leading either to spurious fusion candidates or the elimination of read pairs supporting a true fusion from consideration.
In this article, we propose a method to discover fusion transcripts that exploits ambiguously mapping RNA-Seq read pairs, does not require additional long, 75 nt or greater, single read sequencing and decreases the occurrence of mapping artifacts. We begin by mapping read pairs to the transcriptome independently without imposing any unique-mappability criterion. We then find pairs which do not map to the same gene and build a set of possible gene fusions from the mappings of each read. Next, we employ a generative model of RNA-Seq data that utilizes mapping qualities and insert size distributions to resolve any ambiguous mappings. After the convergence of the EM technique used to find maximum-likelihood transcript abundances, we perform a final partial expectation step for the discordantly mapping read pairs to find optimal fusion assignments for pairs that span fusion junctions. In this way, rather than discarding ambiguously mapping read pairs or allowing them to overstate the number of fusions present, we find the best supported fusions by using the mappings of all the reads in the dataset, the quality of those mappings and the implied insert sizes of read pairs that span a fusion site. This allows our method to more sensitively detect gene fusions than if ambiguously mapping read pairs were discarded.
We have implemented our method on simulated data generated from fusions between genes with very high similarity to other genes to demonstrate that our method can resolve the ambiguous mappings to find the correct fusions when it is possible to do so. We then implemented it on reads derived from neoplastic and hyperplastic prostate tissue and recovered the known TMPRSS2-ERG fusion along with several read-through fusions without finding many spurious, poorly supported fusions as a result of allowing reads to have many mappings. Finally, using publicly available data from several melanoma tumors and cell lines, we find fusion events that would not be detectable without allowing for multimapping reads that span the fusion site.
2 METHODS
2.1 Discovery of putative fusions
The first step of our method is to map each read of a pair independently. We use Bowtie (Langmead et al., 2009) in single-end mode to perform this mapping against a database of RefSeq transcripts (Pruitt et al., 2007) that have been prepended with 50 nt of upstream sequence and appended with string of adenines to account for variation in transcription start site and polyadenylation, respectively. Filtering the mapping results yields a set of read pairs that only map discordantly to different genes. Then, to decrease the possibility of generating inauthentic fusions as a result of SNPs or mapping or annotation errors, we map these discordant read pairs to the genome and transcriptome, and we greatly relax the stringency of reported mappings and allow for many mappings to be reported for each read. For the experiments in this study, we use the Bowtie flags -l 22 -e 350 -y -a -m 5000. These flags cause Bowtie to report all mappings for each read, to try as hard as possible to find valid mappings and to suppress mappings with more than two mismatches in the first 22 bases, summed quality values at all mismatched positions greater than 350 or mappings from reads with more than 5000 reportable mappings. With these less stringent mappings, we check if each pair of reads both map within the genomic bounds of a known gene or within 10 kb of each other in a region of the genome with no annotated genes. This filtering step decreases the possibility of events such as retained introns or unannotated transcripts being mistakenly called as gene fusions.
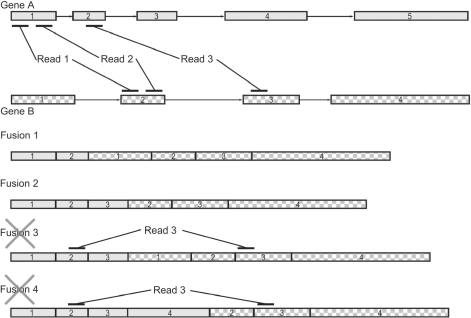
After these filtering steps, we consider each pair of genes to which at least two read pairs map discordantly with fewer than three mismatches. Our aim is to determine which exons from each gene should comprise a putative fusion transcript. Combinations of exons are required to satisfy three conditions. First, all exons upstream of the junction site in the upstream gene isoform and all exons downstream of the junction site in the downstream gene isoform must be included. Hence, in Figure 2 fusion 4, exon 4 from gene A could not be included without also including exon 3. Second, all exons to which a read maps must be included. For example, in Figure 2, exons 1 and 2 from gene A must be included because reads map to them. Third, the implied insert size of any read pair should not be unreasonably large given the known insert size used for sequencing. For example, in Figure 2 fusion 4, the insert size of read pair 3 implied by the inclusion of exons 3 and 4 from gene A may be too large. To decrease the sensitivity of otherwise acceptable exon combinations to occasional abnormally long insert sizes, we allow one-tenth of read pairs to violate this third criterion. While there are certain types of fusions that would not meet these criteria, say a fusion with multiple, similarly expressed isoforms that vary near the fusion site, we find that these criteria effectively eliminate many spurious fusions without losing sensitivity to bona fide ones.
Fig. 2.
Creating fusion genes from discordantly mapping mate pairs. Three mate pairs map to two different gene isoforms. Fusions 1 and 2 include all the exons in either isoform covered by reads. Fusions 3 and 4 also do, but they are rejected because the implied insert size for Read 3 is too large.
Usually, there are multiple combinations of exons from each gene pair that satisfy the above criteria. To enumerate them efficiently, we find every pair of RefSeq isoforms from each gene pair that is supported by at least two discordantly mapping read pairs. For each isoform pair, we build a directed graph of their exon structures augmented with edges that connect each exon in the upstream isoform to each exon in the downstream isoform (Fig. 3). Then, we search for paths from the beginning of the upstream isoform to the end of the downstream isoform by implementing a depth-limited search:
Fig. 3.
To nominate potential fusion transcripts, we build a graph from the exons of each gene isoform in the pair. By adding edges from the upstream transcript to the downstream transcript, we find paths that account for all read pairs mapped to the fusion and that respect an upper bound for the insert size of the read pairs.
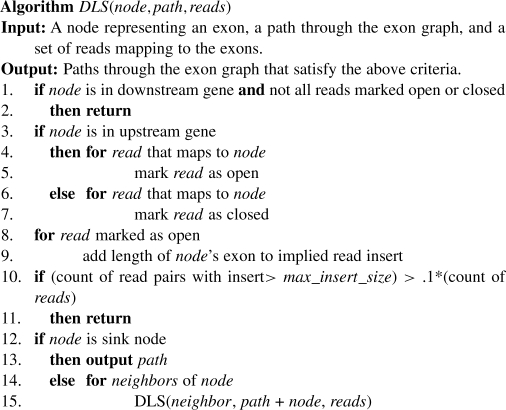
DLS is initially called with the root node S, an empty path and the set of discordantly mapping read pairs for the isoform pair. It then proceeds through the graph in a depth-first fashion. At each node, it checks if there are reads mapping to that node and opens or closes each read pair appropriately, keeping track of the state of each pair independently. If a read maps to a splice junction, the inner boundary of the mapping is used to determine the exon to which it maps. When a read maps to an exon, only the appropriate portion of the exon's length is added to the implied insert size in line 9. The directed edges of the graph ensure that the first criterion above is met. The second and third criteria are ensured explicitly in lines 1 and 2 and lines 10 and 11, respectively. Since the depth of any search path is limited, this procedure can efficiently discover fusions that meet our desired criteria. In addition, to better facilitate the detection of read-through transcripts, the 3′ exon of the upstream gene and the 5′ exon of the downstream gene do not contribute to the reads' implied insert sizes. This follows from our observation that these exons often appear truncated in read-through fusions. Finally, since different isoforms of the same gene mostly contain the same exons, duplicate exon sets can be generated by calling DLS on different isoforms. These duplicates are removed before proceeding to the next step.
2.2 Mapping to augmented reference
After the set of putative fusions are generated, the sequence for each is generated and added to the original set of transcripts from RefSeq. Then, the read pairs are mapped to this augmented reference. Unlike the previous mapping, Bowtie is used in paired-end mode and the default mapping stringencies are used except that up to 1500 possible mappings for each paired-end read are allowed. While the addition of the putative fusion sequences may result in the addition of thousands of additional transcripts to the reference, the total amount of sequence in the augmented reference remains smaller than the genome, and the mapping can still be carried out on a standard desktop computer. After mapping, we proceed, as discussed below, to ranking fusions based on coverage.
2.3 Model of paired-end RNA-Seq data
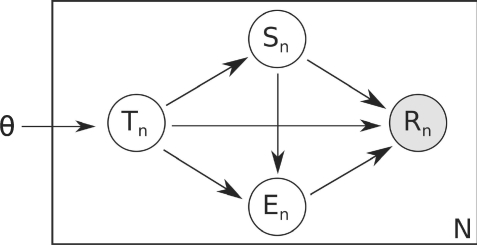
We extend the generative model of Li et al. (2010) to develop a probabilistic model for generating read pairs (Fig. 4). We reason that a read pair is generated in four steps. First the transcript from which the pair will come, tn, is chosen. Then the starting point for the upstream read, sn, within that transcript is chosen; then the end point for the downstream read, en, is chosen. Finally, errors are introduced and the final read pair is observed. As we only observe reads, we can consider transcript choice, starting position, ending position and read error to be hidden variables. The likelihood of a collection of read pairs, and specific values of the hidden variables can be expressed as a function of the true transcript nucleotide abundances:
Fig. 4.
The graphical model of RNA-Seq read pairs. Transcript abundance, transcript choice, starting position, ending position and observed read are represented by θ, T, S, E and R, respectively.
Each term in this equation can be calculated in a straightforward way. The probability of a transcript t being chosen is the relative nucleotide abundance of that transcript, that is, the fraction of all nucleotides that are part of that transcript. Thus, P(tn|θ) = θt. Assuming that each base within a transcript is equally likely to be the starting point of the upstream read, the probability of a particular starting point is the inverse of the length of the transcript ℓt: P(sn|tn) = ℓt−1. The choice of the ending point depends on the distribution of insert sizes used for sequencing and the starting point. We use d(|sn − en|) to indicate the value of the insert size distribution for the distance between the start and end points, which we empirically determine from the read pairs that map concordantly. Finally, the probability of a read being observed from a given transcriptomic locus can be calculated using matches and mismatches between the read sequence and the reference transcriptome and the quality values of the bases in the read (Li et al., 2008). We denote this probability as ε(rn, tn, sn, en).
To expand the probability distribution to N read pairs, we take the product of values for individual reads.
Finally, the probability of our observed variable, the read pairs, given the transcript abundances can be calculated by summing over the values of the hidden variables.
We seek to find the set of transcript abundances, θ, that maximizes this probability by applying EM to the results of the paired-end mapping to the reference augmented with the putative fusions.
2.4 EM
For consistency, we use notation similar to that used by Li et al. (2010). Let Znijk = 1 if (tn, sn, en) = (i,j,k). Then, as the first step of the EM algorithm, we find the expected values of Znijk given the observed reads and the current estimate of θ.
Then, the E-step consists of calculating the log-likelihood weighted by these values.
The values for θ(t+1) are then found by finding the θ that maximizes this function subject to the constraint ∑i=1M θi = 1 using Lagrange multipliers.
 |
Equating all of these terms to zero, we have
 |
This procedure is repeated until convergence. We make the probability calculations tractable by only considering, for each read, the values of t, s and e reported by short read mapping software and assuming the probability of the read coming from any other position to be zero.
2.5 Calculating mappings to fusion junctions
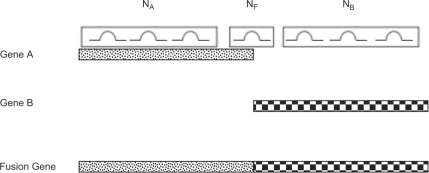
After convergence of the EM algorithm, we have an estimate of the maximum-likelihood abundances for each transcript, including all of the putative fusion transcripts. These abundances reflect the resolution of read mapping ambiguity, as demonstrated by the successful elimination of many spurious fusions in the results below. However, they do not yet account for potential unevenness of coverage across a given transcript. In particular, they can be confounded by a fusion transcript with high coverage everywhere but the fusion site. To illustrate this issue, consider the situation illustrated in Figure 5. We have three reference transcripts: Gene A, Gene B and a fusion gene created by concatenating Genes A and B. We also have three sets of read pairs: NA pairs that map to Gene A and the fusion gene, NB pairs that map to Gene B and the fusion gene and NF pairs that only map to the fusion gene. For simplicity, assume that the values of ε(rn, tn, sn, en) = 1 and d(|sn − en|) = 1 for each mapping of each read pair and the length of both Genes A and B is 1. Then, the probability of the observed data is
Fig. 5.
In this simplified situation, maximizing the likelihood function would set the abundance of the fusion gene to 1 regardless of the relationship between NA, NB and NF.
If we further assume that NA = NB and therefore θA = θB, and use the fact that the sum of the transcript abundances must be 1, we have that  . Then, the probability of the observed data becomes
This expression is maximized by setting θF to 1, which sets θA and θB to zero. So, if there is a single read pair that spans the fusion site in this scenario, all abundance is transferred to the fusion transcript regardless of how large NA and NB may be in relation to NF. While this example has been rather stringently defined for sake of demonstration, a similar situation occurs whenever NF > 0 and NA >> NF or NB >> NF: an unreasonable abundance is assigned to the fusion transcript based on reads that do not map to the fusion site. In the context of seeking fusions, this means a fusion between highly expressed genes supported by a single read pair, perhaps an experimental artifact, will dominate other putative fusions in abundance. To avoid this, rather than simply using the maximum-likelihood abundances, we calculate the sum of the expected values of Znijk for each fusion transcript i for read pairs that span the fusion junction to get a probabilistically weighted count of reads supporting the fusion, Ci.
This retains the ambiguity resolution described above but focuses the abundance estimates on fusions.
As a final filtering step to eliminate experimental artifacts, we find the mean physical coverage, that is, the coverage counting both the reads and the insert, for the upstream and downstream genes in the fusion separately and compare each of them to the physical coverage at the fusion site. If coverage at the fusion site is less than one-twentieth of the upstream and downstream coverage, we discard the fusion as a probable artifact based on the same reasoning discussed above. We also discard fusions where all reads have the sequence of an RNA component of the spliceosome, U1 through U6, as these are likely produced artifactually as well.
3 RESULTS
3.1 Fusion transcripts generate ambiguous reads
To quantify the prevalence of ambiguously mapping read pairs and the extent to which discarding them would impact fusion discovery, we simulated gene fusions by randomly selecting a pair of transcripts from RefSeq and the exon within each transcript that would serve as the fusion breakpoint. For each fusion, we generated, with random errors based on quality scores from an existing dataset, the full set of read pairs that could span it given a constant insert size. We then mapped each of these reads and tabulated the number of read pairs with unique mappings that satisfy default Bowtie mapping criteria (Langmead et al., 2009). We repeated this for several read lengths, generating 100 000 simulated fusions for each read length, while keeping the insert between the two reads at 200 nt.
For each read length, we calculated the fraction of partially ambiguous fusions and totally ambiguous fusions, that is, fusions where some, but not all, of the reads supporting them mapped ambiguously and fusions that only generated ambiguously mapping read pairs. As expected, the fraction of ambiguous fusions declined as read length increased. At a read length of 50 nt, nearly 1 in 20 fusions would only be detectable via ambiguously mapping read pairs (Table 1, Supplementary Table S1). Even at a read length of 100 nt, over a 10-th of all fusions were able to generate an ambiguously mapping read pair. These results suggest that even as read lengths increase, a significant portion of fusions remain difficult to detect if read pairs are required to map unambiguously.
Table 1.
The fraction of totally and partially ambiguous fusions for a range of read lengths
| Read length | % Partially ambiguous fusions | % Totally ambiguous fusions |
|---|---|---|
| 30 | 30.3 | 5.7 |
| 35 | 22.4 | 5.5 |
| 40 | 17.5 | 5.1 |
| 45 | 14.9 | 4.8 |
| 50 | 13.4 | 4.5 |
| 75 | 9.4 | 3.7 |
| 100 | 7.9 | 2.9 |
3.2 Resolving ambiguous simulated fusions
To demonstrate the capability of our method to find gene fusions between highly repetitive regions of the transcriptome using multimapping read pairs, we simulated five fusion genes, outlined in Table 2, derived from possible fusions between genes that share homology with other parts of the transcriptome. Then, 10 000 pairs of 40 nt reads were generated from these five fusions using MAQ (Li et al., 2008) in simulate mode with insert size set to 200 nt. Sequencing errors and quality values were modeled from an existing dataset, and the MAQ simulation code was modified to produce a distribution of different expression levels for each transcript so performance over a range of coverage levels could be examined. As a comparison, the coverage levels used in the simulation would correspond to a range of ∼8 FPKM for MAGED4-MBD3L2 to 80 FPKM for FOXO3-EIF3CL in a 20 M read pair sequencing experiment. Thus, the simulated coverages provide a reasonable range on which to evaluate the performance of our method.
Table 2.
Simulated fusions
| Gene 1 | Gene 2 | Pair count | Pairs spanning fusion |
|---|---|---|---|
| FOXO3 | EIF3CL | 7152 | 281 |
| PSG2 | PHB | 1324 | 117 |
| FRG1 | USP6 | 803 | 47 |
| SMN2 | CSAG1 | 434 | 78 |
| MAGED4 | MBD3L2 | 286 | 34 |
Mapping the 10 000 read pairs to RefSeq transcripts yielded 395 pairs that mapped only discordantly. As expected, all these discordantly mapping pairs mapped to multiple genomic loci and thus suggested multiple fusion candidates. Each discordant read pair is mapped, on average, to seven different pairs of genes, and in some cases mapped to as many as 22. The total number of fusion genes that would be nominated by naïvely accepting all discordant mappings was 56 (Supplementary Table S2).
Applying the filtering and fusion discovery process described in the Section 2.1 yielded 252 putative fusion transcripts. The high number reflects both the multiple gene pairs to which the discordant read pairs mapped and the multiple sets of exons from each gene pair that could be consistent with the discordant mappings.
After allowing the estimate of the maximum-likelihood transcript abundances to converge, only 12 of the 252 nominated fusion transcripts had at least two read pairs assigned to its junction site. Those 12 transcripts represent 7 potential fusion genes (Table 3). All five of the fusions from which the data were generated are included in the results. In addition, two spurious fusions are reported. The results include a fusion between FOXO3 and EIF3C in addition to the true fusion between FOXO3 and EIF3CL. However, this is not a failing of the algorithm. The sequences of EIF3C and EIF3CL are very nearly identical; depending on which isoform of each gene is considered, they differ at most by several bases at the end of their 3′ exons. So, every read that maps to the fusion of FOXO3 and EIF3CL also maps to the fusion of FOXO3 and EIF3C. Rather than discard these reads, the algorithm simply preserved this unresolvable uncertainty and divided them between the two fusions according to values obtained from the probabilistic model. Similarly, SMN1 and SMN2 are nearly indistinguishable. Thus, using only ambiguously mapping read pairs, our method recovered the five true fusions, eliminated 49 spurious ones and retained two fusions that are indistinguishable from true fusions.
Table 3.
Sum of expected values of Znijk for read pairs supporting each fusion after maximum-likelihood transcript abundance estimation
| Upstream partner | Downstream partner | Supporting read pairs |
|---|---|---|
| FOXO3 | EIF3C | 180.3 |
| PSG2 | PHB | 117.0 |
| FOXO3 | EIF3CL | 100.6 |
| SMN1 | CSAG1 | 56.6 |
| FRG1 | USP6 | 46.9 |
| MAGED4 | MBD3L2 | 34.0 |
| SMN2 | CSAG1 | 21.4 |
3.3 Application to a prostate tissue transcriptome data
We applied our method to two datasets derived from tissue resected from an individual with prostate cancer. The first dataset consisted of 18 027 834 pairs of 40 nt reads from neoplastic tissue. The second was 21 978 463 read pairs from adjacent hyperplastic tissue. Of the neoplasia read pairs, 18 177 had only discordant mappings and mapped to 127 102 gene pairs. Of the hyperplasia read pairs, 24 569 had only discordant mappings and mapped to 266 571 gene pairs. Application of the filtering and fusion discovery process described above yielded 887 and 746 putative fusion transcripts for neoplasia and hyperplasia, respectively. After estimating transcript abundances, only 15 fusion transcripts from the neoplasia data had at least two reads assigned to its junction site (Table 4). The top result, a fusion between TMPRSS2 and ERG, is a known recurrent fusion in prostate cancer (Tomlins et al., 2005). A novel fusion between GRHL2 and SNTG1 was also reported. These genes lie about 50 Mb apart on chromosome 8. Intriguingly, there is a short sequence shared by both sequences at the site of the fusion (Supplementary Fig. S2), potentially providing a clue to the origin of the chimera (Li et al., 2009). The remaining results were read-through transcripts present in existing EST databases (Benson et al., 2008).
Table 4.
Prostate neoplasia fusions with sum of expected Znijk values
| Upstream partner | Downstream partner | Supporting read pairs |
|---|---|---|
| TMPRSS2 | ERG | 49.0 |
| AZGP1 | GJC3 | 28.0 |
| TTY14 | NCRNA00185 | 8.0 |
| LOC728606 | KCTD1 | 4.0 |
| ZNF649 | ZNF577 | 3.0 |
| SMA4 | GTF2H2B | 2.5 |
| LOC100134368 | NME4 | 2.0 |
| SYNJ2BP | COX16 | 2.0 |
| SMG5 | PAQR6 | 2.0 |
| PRKAA1 | TTC33 | 2.0 |
| LOC401588 | CHST7 | 2.0 |
| HARS2 | ZMAT2 | 2.0 |
| UQCRQ | LEAP2 | 2.0 |
| GRHL2 | SNTG1 | 2.0 |
| KLK4 | KLKP1 | 2.0 |
In sharp contrast to the neoplasia results, the hyperplasia data showed no evidence of a fusion between TMPRSS2 and ERG (Table 5). This is consistent with the central role that the TMPRSS2-ERG fusion is suspected to play in the progression of prostate cancer (Yu et al., 2010b). Beyond this critical difference, the results largely mirrored those from neoplasia. There was one novel read-through transcript reported, RPL7-LOC100130301, and multiple previously reported read-throughs: AZGP1-GJC3, SPINT2-C19orf33, DHRS1-RABGGTA, TMEM203-C9orf75 and IRF6-C1orf74. The large number of potential fusions suggested by a naïve examination of discordant reads, over 100 000 in each dataset, underscores the complexity of the transcriptome and the often muddled nature of experimentally derived transcriptomic sequencing data. We were gratified that our method was able to discard nearly all of these inauthentic fusions while retaining those of biological importance.
Table 5.
Prostate hyperplasia fusions with sums of expected Znijk values
| Upstream partner | Downstream partner | Supporting read pairs |
|---|---|---|
| AZGP1 | GJC3 | 54.0 |
| SPINT2 | C19orf33 | 6.8 |
| RPL7 | LOC100130301 | 3.0 |
| TMEM203 | C9orf75 | 3.0 |
| DHRS1 | RABGGTA | 3.0 |
| IRF6 | C1orf74 | 2.0 |
3.4 Discovery of novel ambiguous fusions
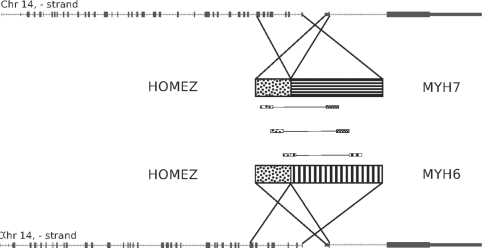
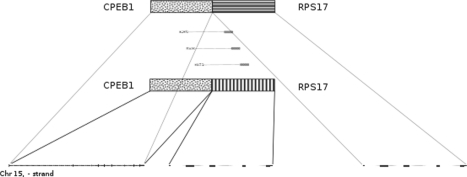
To demonstrate the ability of our method to make new discoveries, we analyzed two publicly available datasets. The first was transcriptome sequencing of a set of melanoma tumors and cell lines originally published by (Berger et al., 2010). The second was sequencing of Stratagene's Universal Human Reference RNA (UHR), a reference composed of RNA from 10 cell lines originally published by (Bullard et al., 2010). Analysis of these data with our method yielded numerous fusions, including all of the fusions reported by Berger and numerous fusions known to be present in UHR including BCR-ABL1, BCAS4-BCAS3 and GAS6-RASA3 (Supplementary Table S3). In addition, we found five fusion transcripts where some or all of the read pairs mapping to them also mapped to other potential fusions (Table 6). In each case, the ambiguity was due to genomic duplications. Some reads mapping to the MYH6 side of the HOMEZ-MYH6 fusion also mapped to MYH6's paralog, MYH7 (Fig. 6). The remaining ambiguous fusions were due to recent segmental duplications. The fusion between CPEB1 and RPS17 was clearly a read-through, but was confounded by the presence of another copy of RPS17 in an upstream segmental duplication (Fig. 7). KIAA1267-ARL17A was similarly made ambiguous by multiple copies of ARL17. The fusions between PPIP5K1-CATSPER2 and TRIM16L-FBXW10 were confounded by mappings to CATSPER2P1 and TRIM16-CDRT1. The sequence of each fusion is available in Supplementary Figure S3. These findings confirm that additional fusions can be detected in tumors when ambiguously mapping read pairs are included in the analysis.
Table 6.
Fusions found in previously published datasets that are either partially or completely supported by ambiguously mapping read pairs
| Fusion | Samples | Supporting read pairs | Ambiguous read pairs |
|---|---|---|---|
| HOMEZ-MYH6 | UHR | 3 | 2 |
| KIAA1267- ARL17A | M000216 | 11 | 11 |
| M010403 | 11 | 11 | |
| UHR | 11 | 11 | |
| CPEB1-RPS17 | M980409 | 3 | 3 |
| MeWo | 5 | 5 | |
| PPIP5K1- CATSPER2 | M010403 | 4 | 3 |
| M990802 | 17 | 13 | |
| TRIM16L-FBXW10 | M010403 | 3 | 3 |
Fig. 6.
The fusion between HOMEZ and MYH6. Three mate pairs support this fusion, but two also map to a fusion between HOMEZ and MYH7.
Fig. 7.
The fusion between CPEB1 and RPS17. A copy of RPS17 lies 2000 bases downstream of CPEB1, but another copy lies 400 kb downstream, as well.
4 DISCUSSION
In this article, we have demonstrated a method to use discordantly and often ambiguously mapping RNA-Seq read pairs to identify fusion transcripts. In doing so, we bring the increasingly sophisticated methods employed to estimate transcript abundance in the presence of multimapping reads to the problem of fusion discovery. In contrast to previously proposed methods for fusion identification that focus on reads that map to the junction between two genes (Ameur et al., 2010), our method estimates fusion transcript abundances by considering physical coverage over the entire length of the proposed fusion. In addition, it employs several filters to minimize experimental artifacts. Finally, it does not require that any single read sequence hit the point of fusion. Instead, it uses implied insert sizes and known exon boundaries to determine the most likely point of fusion. This would be a liability if a fusion transcript contained partial exons, but reported fusions to date suggest that a vast majority of fusions do indeed involve the joining of whole exons from different genes, the breakpoints occurring in introns and the splice sites remaining unchanged (Hahn et al., 2004).
Several avenues for future development are apparent from this work. Here, we chose to use RefSeq transcripts as the reference against which reads are mapped. This allowed us to avoid the issue of reads that map to splice junctions because the splice junction sequence would be contiguous in the transcript sequence. However, it prevents us from identifying transcripts that are produced by novel or aberrant splicing, which is common in cancer (Rajan et al., 2009), or are significantly altered by RNA editing (Skarda et al., 2009). It may be fruitful to combine the approach described here with methods that identify splice junctions and expressed regions of the genome de novo (Ameur et al., 2010; Trapnell et al., 2009). Additionally, fusion transcript discovery shares many parallels with the problem of resolving genomic rearrangements, especially the challenges of repetitive sequence. The adaptation of the methods developed here to genomic sequencing may prove useful in this related field.
Supplementary Material
ACKNOWLEDGEMENTS
We thank Eric Topol for his support and the clinical team at The Scripps Translational Science Institute for sample collections.
Funding: National Institutes of Health [grant numbers RO1-HG004962, 5U54HL108460, 1R21CA152613-01, CTSA-1U54RR025204] and the California Institute for Regenerative Medicine [grant number DR1-01430].
Conflict of Interest: none declared.
REFERENCES
- Akiva P., et al. Transcription-mediated gene fusion in the human genome. Genome Res. 2006;16:30–36. doi: 10.1101/gr.4137606. [DOI] [PMC free article] [PubMed] [Google Scholar]
- Ameur A., et al. Global and unbiased detection of splice junctions from RNA-seq data. Genome Biol. 2010;11:R34. doi: 10.1186/gb-2010-11-3-r34. [DOI] [PMC free article] [PubMed] [Google Scholar]
- Benson D.A., et al. GenBank. Nucleic Acids Res. 2008;36:25–30. [Google Scholar]
- Berger M.F., et al. Integrative analysis of the melanoma transcriptome. Genome Res. 2010;20:413–427. doi: 10.1101/gr.103697.109. [DOI] [PMC free article] [PubMed] [Google Scholar]
- Bullard J.H., et al. Evaluation of statistical methods for normalization and differential expression in mRNA-Seq experiments. BMC Bioinformatics. 2010;11:94. doi: 10.1186/1471-2105-11-94. [DOI] [PMC free article] [PubMed] [Google Scholar]
- Carninci P. Is sequencing enlightenment ending the dark age of the transcriptome? Nat. Methods. 2009;6:711–713. doi: 10.1038/nmeth1009-711. [DOI] [PubMed] [Google Scholar]
- Carninci P., et al. The transcriptional landscape of the mammalian genome. Science. 2005;309:1559–1563. doi: 10.1126/science.1112014. [DOI] [PubMed] [Google Scholar]
- Druker B.J., et al. Efficacy and safety of a specific inhibitor of the BCR-ABL tyrosine kinase in chronic myeloid leukemia. N. Engl. J. Med. 2001;344:1031–1037. doi: 10.1056/NEJM200104053441401. [DOI] [PubMed] [Google Scholar]
- Edwards P.A. Fusion genes and chromosome translocations in the common epithelial cancers. J. Pathol. 2010;220:244–254. doi: 10.1002/path.2632. [DOI] [PubMed] [Google Scholar]
- Faulkner G.J., et al. A rescue strategy for multimapping short sequence tags refines surveys of transcriptional activity by CAGE. Genomics. 2008;91:281–288. doi: 10.1016/j.ygeno.2007.11.003. [DOI] [PubMed] [Google Scholar]
- Gingeras T.R. Implications of chimaeric non-co-linear transcripts. Nature. 2009;461:206–211. doi: 10.1038/nature08452. [DOI] [PMC free article] [PubMed] [Google Scholar]
- Hahn Y., et al. Finding fusion genes resulting from chromosome rearrangement by analyzing the expressed sequence databases. Proc. Natl Acad. Sci. USA. 2004;101:13257–13261. doi: 10.1073/pnas.0405490101. [DOI] [PMC free article] [PubMed] [Google Scholar]
- Horiuchi T., Aigaki T. Alternative trans-splicing: a novel mode of pre-mRNA processing. Biol. Cell. 2006;98:135–140. doi: 10.1042/BC20050002. [DOI] [PubMed] [Google Scholar]
- Hu Y., et al. A probabilistic framework for aligning paired-end RNA-seq data. Bioinformatics. 2010;26:1950–1957. doi: 10.1093/bioinformatics/btq336. [DOI] [PMC free article] [PubMed] [Google Scholar]
- Krause M., Hirsh D. A trans-spliced leader sequence on actin mRNA in C. elegans. Cell. 1987;49:753–761. doi: 10.1016/0092-8674(87)90613-1. [DOI] [PMC free article] [PubMed] [Google Scholar]
- Langmead B., et al. Ultrafast and memory-efficient alignment of short DNA sequences to the human genome. Genome Biol. 2009;10:R25. doi: 10.1186/gb-2009-10-3-r25. [DOI] [PMC free article] [PubMed] [Google Scholar]
- Li B., et al. RNA-Seq gene expression estimation with read mapping uncertainty. Bioinformatics. 2010;26:493–500. doi: 10.1093/bioinformatics/btp692. [DOI] [PMC free article] [PubMed] [Google Scholar]
- Li H., et al. Mapping short DNA sequencing reads and calling variants using mapping quality scores. Genome Res. 2008;18:1851–1858. doi: 10.1101/gr.078212.108. [DOI] [PMC free article] [PubMed] [Google Scholar]
- Li X., et al. Short homologous sequences are strongly associated with the generation of chimeric RNAs in eukaryotes. J. Mol. Evol. 2009;68:56–65. doi: 10.1007/s00239-008-9187-0. [DOI] [PubMed] [Google Scholar]
- Maher C.A., et al. Chimeric transcript discovery by paired-end transcriptome sequencing. Proc. Natl Acad. Sci. USA. 2009a;106:12353–12358. doi: 10.1073/pnas.0904720106. [DOI] [PMC free article] [PubMed] [Google Scholar]
- Maher C.A., et al. Transcriptome sequencing to detect gene fusions in cancer. Nature. 2009b;458:97–101. doi: 10.1038/nature07638. [DOI] [PMC free article] [PubMed] [Google Scholar]
- Mitelman F., et al. Fusion genes and rearranged genes as a linear function of chromosome aberrations in cancer. Nat. Genet. 2004;36:331–334. doi: 10.1038/ng1335. [DOI] [PubMed] [Google Scholar]
- Mortazavi A., et al. Mapping and quantifying mammalian transcriptomes by RNA-Seq. Nat. Methods. 2008;5:621–628. doi: 10.1038/nmeth.1226. [DOI] [PubMed] [Google Scholar]
- Perner S., et al. EML4-ALK fusion lung cancer: a rare acquired event. Neoplasia. 2008;10:298–302. doi: 10.1593/neo.07878. [DOI] [PMC free article] [PubMed] [Google Scholar]
- Pruitt K.D., et al. NCBI reference sequences (RefSeq): a curated non-redundant sequence database of genomes, transcripts and proteins. Nucleic Acids Res. 2007;35:D61–D65. doi: 10.1093/nar/gkl842. [DOI] [PMC free article] [PubMed] [Google Scholar]
- Rajan P., et al. Alternative splicing and biological heterogeneity in prostate cancer. Nat. Rev. Urol. 2009;6:454–460. doi: 10.1038/nrurol.2009.125. [DOI] [PubMed] [Google Scholar]
- Rajkovic A., et al. A spliced leader is present on a subset of mRNAs from the human parasite Schistosoma mansoni. Proc. Natl Acad. Sci. USA. 1990;87:8879–8883. doi: 10.1073/pnas.87.22.8879. [DOI] [PMC free article] [PubMed] [Google Scholar]
- Shtivelman E., et al. Fused transcript of abl and bcr genes in chronic myelogenous leukaemia. Nature. 1985;315:550–554. doi: 10.1038/315550a0. [DOI] [PubMed] [Google Scholar]
- Skarda J., et al. RNA editing in human cancer: review. APMIS. 2009;117:551–557. doi: 10.1111/j.1600-0463.2009.02505.x. [DOI] [PubMed] [Google Scholar]
- Sutton R.E., Boothroyd J.C. Evidence for trans splicing in trypanosomes. Cell. 1986;47:527–535. doi: 10.1016/0092-8674(86)90617-3. [DOI] [PMC free article] [PubMed] [Google Scholar]
- Tomlins S.A., et al. Recurrent fusion of TMPRSS2 and ETS transcription factor genes in prostate cancer. Science. 2005;310:644–648. doi: 10.1126/science.1117679. [DOI] [PubMed] [Google Scholar]
- Trapnell C., et al. TopHat: discovering splice junctions with RNA-Seq. Bioinformatics. 2009;25:1105–1111. doi: 10.1093/bioinformatics/btp120. [DOI] [PMC free article] [PubMed] [Google Scholar]
- Wang Z., et al. RNA-Seq: a revolutionary tool for transcriptomics. Nat. Rev. Genet. 2009;10:57–63. doi: 10.1038/nrg2484. [DOI] [PMC free article] [PubMed] [Google Scholar]
- Yulug I.G., et al. The frequency and position of Alu repeats in cDNAs, as determined by database searching. Genomics. 1995;27:544–548. doi: 10.1006/geno.1995.1090. [DOI] [PubMed] [Google Scholar]
- Yu J., et al. An integrated network of androgen receptor, polycomb, and TMPRSS2-ERG gene fusions in prostate cancer progression. Cancer Cell. 2010a;17:443–454. doi: 10.1016/j.ccr.2010.03.018. [DOI] [PMC free article] [PubMed] [Google Scholar]
- Yu J., et al. An integrated network of androgen receptor, polycomb, and TMPRSS2-ERG gene fusions in prostate cancer progression. Cancer Cell. 2010b;17:443–454. doi: 10.1016/j.ccr.2010.03.018. [DOI] [PMC free article] [PubMed] [Google Scholar]
Associated Data
This section collects any data citations, data availability statements, or supplementary materials included in this article.


