Abstract
We demonstrate wide-field fluorescent and darkfield imaging on a cell-phone with compact, light-weight and cost-effective optical components that are mechanically attached to the existing camera unit of the cell-phone. For this purpose, we used battery powered light-emitting diodes (LEDs) to pump the sample of interest from the side using butt-coupling, where the pump light was guided within the sample cuvette to uniformly excite the specimen. The fluorescent emission from the sample was then imaged using an additional lens that was positioned right in front of the existing lens of the cell-phone camera. Because the excitation occurs through guided waves that propagate perpendicular to our detection path, an inexpensive plastic colour filter was sufficient to create the dark-field background required for fluorescent imaging, without the need for a thin-film interference filter. We validate the performance of this platform by imaging various fluorescent micro-objects in 2 colours (i.e., red and green) over a large field-of-view (FOV) of ~81 mm2 with a raw spatial resolution of ~20 μm. With additional digital processing of the captured cell-phone images, through the use of compressive sampling theory, we demonstrate ~2 fold improvement in our resolving power, achieving ~10 μm resolution without a trade-off in our FOV. Further, we also demonstrate darkfield imaging of non-fluorescent specimen using the same interface, where this time the scattered light from the objects is detected without the use of any filters. The capability of imaging a wide FOV would be exceedingly important to probe large sample volumes (e.g., >0.1 mL) of e.g., blood, urine, sputum or water, and for this end we also demonstrate fluorescent imaging of labeled white-blood cells from whole blood samples, as well as water-borne pathogenic protozoan parasites such as Giardia Lamblia cysts. Weighing only ~28 g (~1 ounce), this compact and cost-effective fluorescent imaging platform attached to a cell-phone could be quite useful especially for resource-limited settings, and might provide an important tool for wide-field imaging and quantification of various lab-on-a-chip assays developed for global health applications, such as monitoring of HIV+ patients for CD4 counts or viral load measurements.
Introduction
As of 2010, close to 60% of the world-population has at least one cell-phone subscription, which is expected to further increase up to ~90% by 2015.1 About two-thirds of these cell-phones are actually being used in the developing world,1 which holds significant promise for various telemedicine applications potentially impacting the fight against several global health problems. The use of the existing hardware and/or software architecture of cell-phones to improve healthcare is a recently emerging theme, which has already enabled implementation of various telemedicine technologies on a cell-phone including electrical impedance tomography, electrocardiography, fluorescent microscopy, and lensfree on-chip microscopy.2-7
Among these technologies, fluorescent microscopy is particularly important since fluorescent markers have gone through a significant advancement over the last decade bringing specificity and sensitivity to various lab-on-a-chip devices for e.g., diagnosis of disease, quantification of target cells/bacteria, or detection of biomarkers.8,9 For this end, Fletcher et al. has recently demonstrated fluorescent microscopy on a cell-phone achieving ~1.2 μm resolution across a field-of-view (FOV) of ~0.025 mm2 using an optical attachment of >15 cm in length.6 This is a rather important step-forward for telemedicine based fluorescent microscopy, which could especially be valuable for diagnosis of infectious diseases such as tuberculosis. On the other hand, there is still a need for higher throughput platforms that can image much larger sample areas and volumes using more compact and lighter weight telemedicine interfaces.
To provide a complementary effort to this important need, here we demonstrate fluorescent microscopy on a cell-phone (see Fig. 1) using a compact (3.5 × 5.5 × 2.4 cm) and light-weight (~28 g) optical attachment to the existing camera-unit of the cell-phone. This platform achieves an imaging FOV of ~81 mm2 with a raw spatial resolution of ~20 μm, which can further be improved to ~10 μm using digital signal processing of the captured fluorescent images based on compressive sampling theory.10-12 In this approach, the fluorescent sample is pumped using battery-powered light-emitting diodes (LEDs) that are butt-coupled to the sample from the side (see Fig. 1). This pump light is guided within the sample cuvette uniformly exciting the specimen of interest. The fluorescent emission from the sample is then imaged using a simple lens that is placed in front of the existing cell-phone camera lens. Since the excitation light is guided perpendicular to our detection path, a simple plastic colour filter can be used to create the necessary dark-field background. This feature is rather important to eliminate the use of expensive fluorescent filters (e.g., thin-film interference filters) that are used in conventional fluorescent microscopes.
Fig. 1.
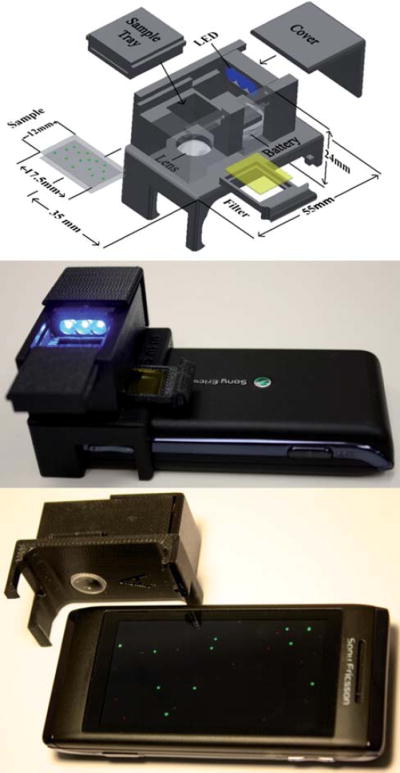
(Top) Schematic diagram of the designed optical attachment for wide-field fluorescent imaging on a cell-phone. (Middle and Bottom) Different views of the fluorescent imager prototype. This entire attachment to the cell-phone weighs ~28 g (~1 ounce) and has dimensions of ~3.5 × 5.5 × 2.4 cm. This compact and light-weight unit can be repeatedly attached and detached to the cell-phone body without the need for any fine alignment, making its interface fairy easy to use.
There are several important features of this cell-phone based fluorescent microscope that make it especially suitable for global health applications:
(1) Cost-effectiveness
Major components of our microscope attachment include a simple lens (cost: ~12 USD/piece), a plastic colour filter (cost: ~1.1 USD/piece), 3 LEDs (cost: ~0.3 USD/piece), and a battery (cost: ~0.5 USD/piece), which make this fluorescent imaging platform on a cell-phone extremely cost-effective.
(2) Imaging throughput
The large FOV (~81 mm2) and the depth-of-field (>1–2 mm) of this platform permits imaging of >0.1 mL of sample volume, which would be important for high-throughput imaging of specially designed micro-fluidic channels for detection and quantification of e.g., rare cells or low concentration bacteria/pathogens.
(3) Compactness and light-weight
The entire attachment to the cell-phone (which includes all the above mentioned optical components, battery, as well as the mechanical components shown in Fig. 1) weighs ~28 g (~1 ounce) and has dimensions of ~3.5 × 5.5 × 2.4 cm. This compact and light-weight unit can be repeatedly attached and detached to the cell-phone body without the need for any fine alignment/tuning, making its interface fairy easy to use even in resource limited settings.
While the above discussed features make this platform rather promising for telemedicine applications, a trade-off in spatial resolution has also been made in our design, i.e., in return for achieving a cost-effective and compact wide-field fluorescent imaging interface on a cell-phone, our spatial resolution is limited to ~10 μm. This, however, is still an acceptable resolution for several applications that demand rapid screening of large sample volumes of e.g., blood, urine, sputum or water. To exemplify such opportunities, in this manuscript we demonstrate the performance of this cell-phone based wide-field fluorescent microscope by successfully imaging labeled white-blood cells from whole blood samples, as well as water-borne pathogenic protozoan parasites such as Giardia Lamblia cysts. In addition, we also illustrate the performance of this platform by imaging fluorescent micro-particles in 2 different colours (i.e., red and green) and compare the acquired cell-phone images against conventional fluorescent microscope images of the same samples, validating our spatial resolution across an FOV of ~81 mm2. And finally, we also demonstrate the dark-field imaging of a non-fluorescent specimen using the same cell-phone interface, where this time the scattered light from the objects is detected without the use of any colour filters.
We believe that this cost-effective, compact and light-weight fluorescent microscopy platform running on a cell-phone could be especially important for resource-limited settings, providing an important tool for wide-field imaging and quantification of various lab-on-a-chip assays that are already developed for global health applications.
Results and discussion
Our fluorescent microscopy platform is directly attached to the existing camera unit of the cell-phone with a compact and light-weight interface, which mainly includes 3 LEDs, a simple lens, and a mechanical tray for holding a plastic colour filter as illustrated in Fig. 1. Note that the LEDs and the plastic filter can be easily changed for different excitation/emission colours, and therefore this platform is compatible with a wide range of fluorophores.
We initially demonstrated the fluorescent imaging capability of this platform by using fluorescent micro-beads (with a diameter of 10 μm) at two different emission wavelengths, i.e., 515 nm and 605 nm as shown in Fig. 1 (bottom image) and Fig. 2, 3. To characterize the FOV of this platform, red fluorescent beads (between two microscope slides) were imaged as illustrated in Fig. 2 over an area of 14.7 mm × 11 mm. Toward its edges, this large imaging area has aberrations (see e.g., Fig. 2(F–J)), and therefore only the central region spanning an area of ~9 mm × 9 mm exhibited a decent imaging performance, creating an FOV ~81 mm2 as indicated with the dashed square in Fig. 2. Due to its large FOV and low numerical aperture, this cellphone based fluorescent microscopy platform has the capability to screen large sample volumes (>0.1 mL) which could be especially important for rapid screening of e.g., blood, urine, saliva, water etc. We should also note that while the aberrated regions (e.g., Fig. 2(F–J)) look significantly distorted when compared to the central imaging area (e.g., Fig. 2(A–E)), for various cell counting or detection applications in resource-limited settings, such aberrated regions could still be useful, which would potentially further increase the imaging area beyond 81 mm2.
Fig. 2.
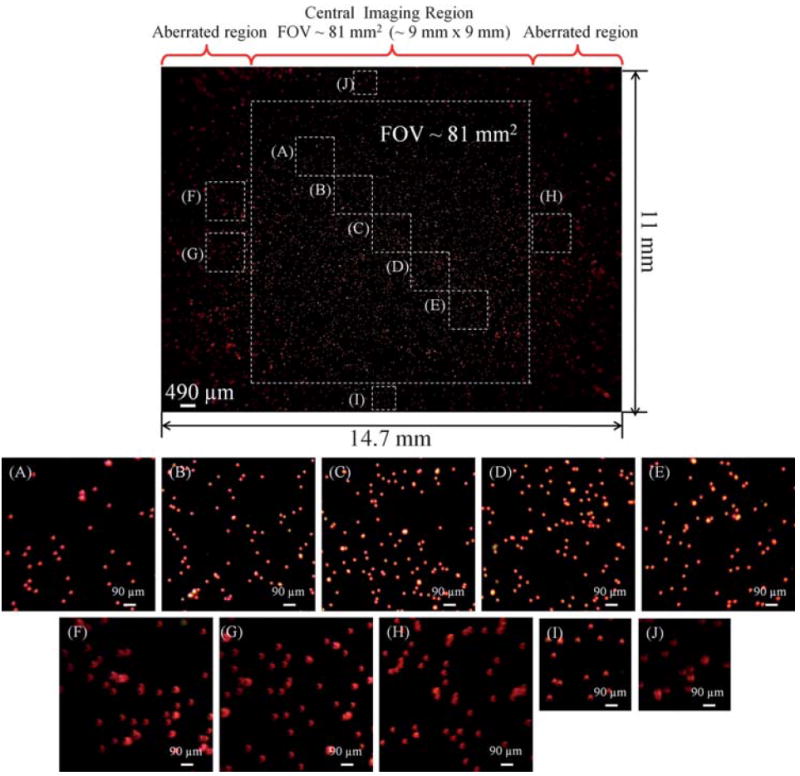
Imaging performance of the cell-phone fluorescent microscope shown in Fig. 1 is demonstrated using fluorescent beads (10 μm diameter; excitation/emission: 580 nm/605 nm). The central field-of-view of each cell-phone image is ~8l mm2, which exhibits a decent imaging performance. The edges of the image, which lie outside of this central region exhibit aberrations, and therefore are not included in the reported field-of-view. For counting purposes, however, those aberrated regions could still be useful despite their poorer image quality. Note that all the scale bars in zoomed frames (A–J) have the same length.
Fig. 3.
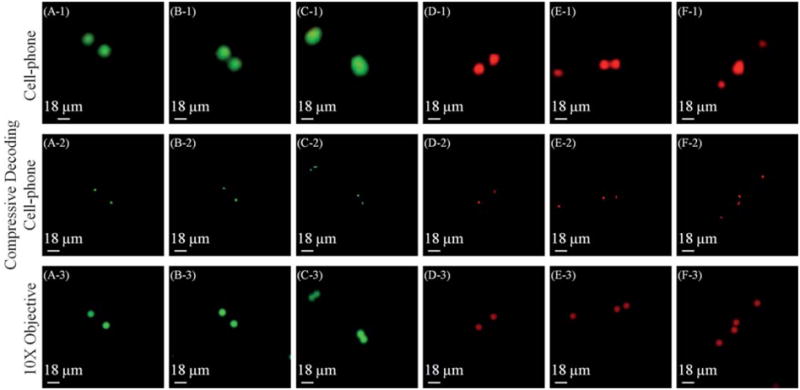
Spatial resolution of the cell-phone fluorescent microscope shown in Fig. 1 is illustrated using green and red fluorescent beads. The top row shows raw cell-phone images of the particles which demonstrate ~20 μm resolution in both of the fluorescent colors, e. g., the particles in B-1 and E-1 can be resolved from each other by our cell-phone microscope. The middle row illustrates the compressive decoding results of the top row cell-phone images which can now resolve ~10 μm spaced fluorescent particles in both green and red colors, as shown in C-2 and F-2, respectively. The bottom row illustrates, for comparison purposes, 10× microscope-objective (NA = 0.25) images of the same samples acquired with a conventional fluorescent microscope. Note that because the samples were suspended in a solution, their relative orientations might be slightly shifted in microscope comparison images. Markers were used on the sample slides to be able to conveniently match the microscope images to their corresponding cell-phone images.
Next we performed a series of experiments to characterize the spatial resolution of our platform using green and red fluorescent beads (10 μm diameter). Fig. 3 top row (Fig. 3(A-1) to Fig. 3(F-1)) illustrates the imaging performance of the cell-phone microscope for several set of beads. The same samples were also imaged by a conventional fluorescent microscope using a 10x microscope-objective (numerical aperture 0.25) as shown in Fig. 3 bottom row (Fig. 3(A-3) to Fig. 3(F-3)). Based on these results, using the raw cell-phone images we can resolve 2 beads that are separated by ~20 μm (center-to-center). This resolving power can be further improved through digital signal processing of the captured fluorescent images based on compressive sampling theory,10-12 the details of which will be presented in the Experiment Methods section. Based on this numerical recipe, the decoded cell-phone images are shown in Fig. 3 (Middle Row) which this time indicates that 2 beads having a center-to-center distance of ~10 μm (that could not be resolved in the raw cellphone images) are now digitally resolved as illustrated in Fig. 3(C-2) and 3(F-2). We should emphasize that even though this resolving power (~10 μm) is fairly modest, because of the large FOV of this platform (~81 mm2), it is still quite useful for various cell/pathogen detection and quantification applications, involving e.g., bodily fluid analysis in remote locations.
Following these characterization experiments, we next investigated the feasibility of using our cell-phone based fluorescent microscopy platform to image labeled cells in whole blood samples. For this end, we imaged white-blood cells that were labeled with STYO®16 nucleic acid staining. These white-blood cells were excited with blue LEDs (470 nm peak wavelength) and were imaged using our cell-phone based microscope, the results of which are summarized in Fig. 4. In this Fig. 4, (A1-C1) are digitally cropped from the central FOV of the cell-phone fluorescent image, showing raw signatures of the labeled white-blood cells. For comparison purposes, the same zoomed regions of the sample were also imaged using a conventional fluorescent microscope (10x microscope objective) as shown in Fig. 4(A3-C3), which all provide a decent match to our cell-phone fluorescent images. To further improve our image quality, we have compressively decoded Fig. 4(A1-C1) to digitally arrive at Fig. 4(A2-C2), which clearly demonstrate our improved resolving power similar to Fig. 3 (see e.g., the closely spaced white-blood cells as pointed by white arrows in Fig. 4).
Fig. 4.
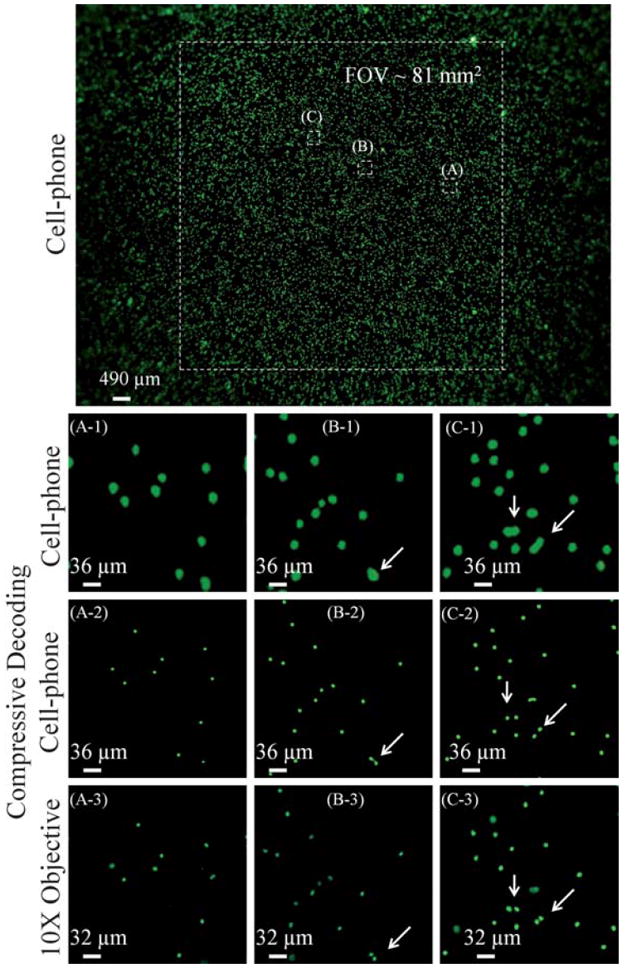
Imaging performance of our cell-phone fluorescent microscope is demonstrated using labeled white blood cells. Microscope objective (10×, NA = 0.25) images of the same samples, acquired with a conventional fluorescent microscope, are also provided for comparison purposes. White arrows point to cells that can be resolved using compressive decoding, which further demonstrate our improved resolving power similar to Fig. 3. Note that because the samples were suspended in a solution, their relative orientations might be slightly shifted in microscope comparison images, as a result of which the FOV and the scale-bars of the microscope images are slightly different when compared to the cell-phone images.
We also explored the potential application of this cell-phone based fluorescent microscope for water quality monitoring. For this purpose, Giardia Lamblia was chosen as the model system in our study because it is one of the most widely found pathogen that exists in water sources. Since it only takes ingestion of as few as ten Giardia Lamblia cysts to cause an infection, it is highly desirable to have a detection method that can rapidly identify low concentration cysts in drinking water. To demonstrate its proof-of-concept, Fig. 5 (Top Row) illustrates raw cell-phone fluorescent images of Giardia Lamblia cysts that were labeled using SYTO®16. These cell-phone images were digitally cropped from a large FOV (~81 mm2), and for comparison purposes, the same regions of interest were also imaged using a conventional fluorescent microscope (10x microscope-objective), which very well matched to our cell-phone imaging results. As discussed earlier, our cell-phone fluorescent microscopy platform has the capability to rapidly image large samples volumes of e.g., >0.1 mL. In addition to this, fluorescent labeling can also provide high specificity and sensitivity for detection of pathogenic parasites at low concentration levels, all of which make our cell-phone fluorescent microscope a promising tool for monitoring of water-quality in resource limited environments.
Fig. 5.
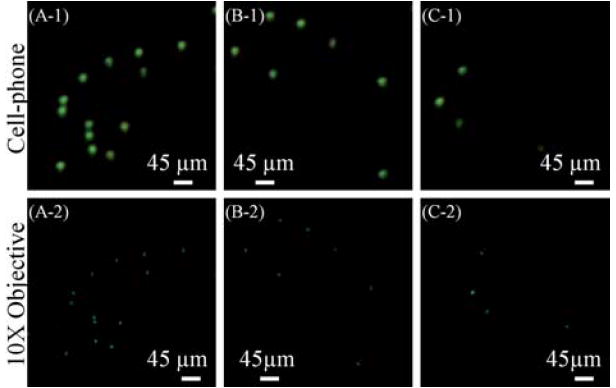
(Top) Giardia Lamblia cysts that are imaged using the fluorescent cell-phone microscope of Fig. 1. (Bottom) Microscope objective (10×, NA = 0.25) images of the same samples are also provided for comparison purposes. Note that because the samples were suspended in a solution, their relative orientations might be slightly shifted in the microscope comparison images. In (B-2) and (C-2) there are 2 dead-pixels at the microscope images which do not show up in our cell-phone images.
We would like to briefly point out an alternative sample handling method that involves the use of glass capillary tubes in our cell-phone microscopes. Rather than using planar substrates (as illustrated in Fig. 2-5 so far) our cell-phone based fluorescent microscope can also image samples that are loaded into capillary tubes through simple capillary action.
The excitation of the specimen within such capillary tubes shares the same approach that we used so far, such that the pump can be guided within the capillary tube which acts as a waveguide once loaded with a sample solution. This waveguide, even though has a lower refractive index at the core, permits efficient excitation of the labeled objects within its core as illustrated in Fig. 6 and Supplementary Fig. 1.† Such a simple capillary based sample preparation approach could be rather convenient to use especially in remote locations where even basic laboratory instruments might not be readily available.
Fig. 6.
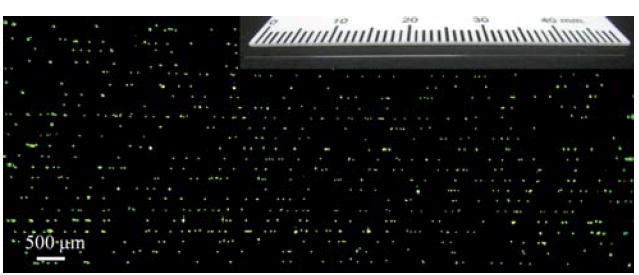
Fluorescent samples can also be imaged within micro-capillaries using our cell-phone based fluorescent microscope. In this case, simple capillary action is sufficient to load the specimen into a capillary tube. Each capillary, when loaded with the sample solution, acts as a wave-guide for pump photons, such that efficient excitation of the samples could be achieved as illustrated in this figure for 10 μm fluorescent beads that were loaded into several capillary tubes in parallel. The inset figure at the top corner illustrates one of the capillaries used in this work (100 μm inner diameter; 170 μm outer diameter). For further information please refer to Supplementary Fig. 1.†
Finally, we would like to emphasize that the same compact and cost-effective cell-phone microscopy interface can also image non-fluorescent objects as demonstrated in Fig. 7. In this dark-field imaging mode, the scattered light from the objects is imaged using the cell-phone microscope without the use of any colour filters. In Fig. 7, a sample that contains both fluorescent and non-fluorescent beads (10 μm diameter) is imaged. In the top row of Fig. 7, darkfield images of two different zoomed regions of the sample are illustrated. Because the illumination was achieved using a white LED (without any colour filter in front of the sensor), the side-scattered light from non-fluorescent beads creates their darkfield images. The fluorescent beads within the mixture can still be excited using this white LED, and therefore their green fluorescent emission is also visible in this darkfield image. In the Second Row of Fig. 7 fluorescent images of the same FOV are illustrated using our cell-phone microscope. The illumination was achieved using a blue LED which efficiently pumped the fluorescent beads as evident in their images. The non-fluorescent beads do not show up in this fluorescent image since a colour filter in front of the cell-phone sensor rejected the pump wavelength that is scattered toward the sensor. Fig. 7 also presents conventional microscope comparison images (both fluorescent and brightfield) of the same samples.
Fig. 7.
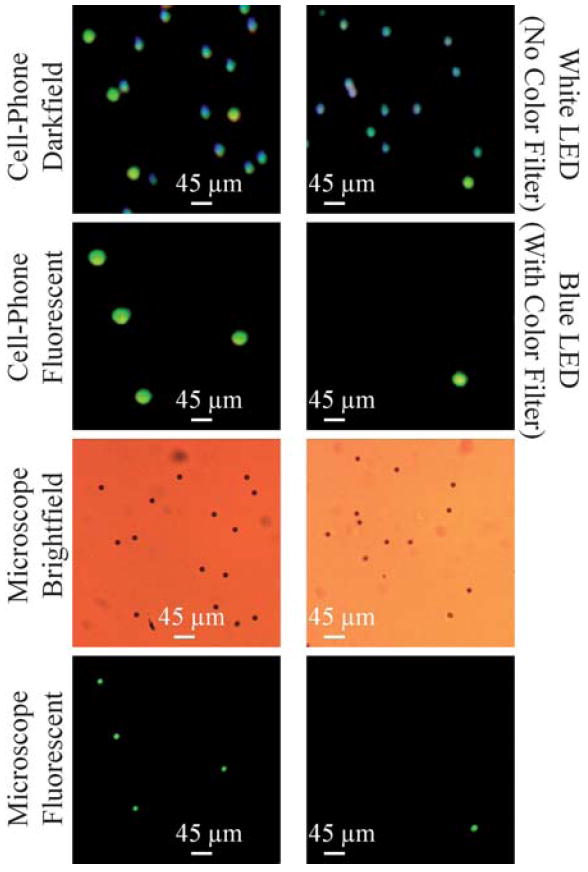
Darkfield imaging capability of our cell-phone microscope (Fig. 1) is demonstrated using a mixture of fluorescent and non-fluorescent 10 μm beads. (Top row) Darkfield images of two different zoomed regions of the sample are illustrated. Because the illumination was achieved using a white LED (without any color filter in front of the sensor), the scattered light from non-fluorescent beads creates their darkfield images. The fluorescent beads can still be excited using this white LED and therefore their green fluorescent emission is also visible in this darkfield image. (Second row) Fluorescent images of the same FOV are illustrated using the cell-phone microscope. The illumination was achieved using a blue LED which efficiently pumped the green fluorescent beads as evident in their images. The non-fluorescent beads do not show up in this image since a color filter in front of the cell-phone sensor rejected the pump wavelength. (Third row) Conventional bright-field microscope images of the same FOV are illustrated using a 10× objective lens for comparison purposes. (Bottom row) Conventional fluorescent microscope images of the same FOV are illustrated using a 10× objective lens for comparison purposes. Note also that because the samples were suspended in a solution, their relative orientations might be slightly shifted in their microscope comparison images.
Experimental methods
Design of the wide-field fluorescent imager installed on the cell-phone
We used Sony-Erickson U10i Aino™ as the starting base of our fluorescent cell-phone microscope. However, we should emphasize that the presented technique can easily be installed on various other cell-phones independent of the operating system or the communication protocol (see e.g., Supplementary Fig. 2†). This cell-phone has an ~8 Mpixel colour RGB sensor installed on it, which we used to capture the fluorescent images of the samples as described in earlier sections.
The digital camera unit of this cell-phone has already a built-in lens in front of the CMOS chip, which has a focal length of f ~ 4.65 mm. To image the fluorescent sample onto the CMOS sensor chip, we placed another lens (f2 = 15 mm) in front of the existing camera lens, which creates a de-magnification of f2/f ≃ 3.2 between the sample plane (located at the focal plane of f2) and the CMOS sensor plane. This de-magnification factor can easily be tuned by changing the value of f2, and quite conveniently, it is independent of the physical distance between the two lenses, which makes it rather tolerant to vertical misalignments of the attached unit. Based on this imaging geometry, the effective pixel size at the sample plane becomes ~5–6 μm, which is in good agreement with our raw resolution of ~20 μm as demonstrated in Fig. 3. As will be detailed in the next sections, this raw resolving power can further be improved by another factor of ~2, without a trade-off in the imaging FOV.
Besides resolution and FOV, another important challenge in fluorescent microscopy is the rejection of the pump photons. For this end, conventional fluorescent microscopes mostly utilize thin-film interference filters which are relatively expensive. In our cell-phone microscope design, to achieve a decent dark-field background without the use of such expensive filters, we have used a different pumping scheme as illustrated in Fig. 1, where the pump light (generated by 3 LEDs – Digikey Corp, Thief River Falls, MN) was actually coupled to the sample holder from the side using lensfree butt-coupling. Because of the large cross-section of the LED light, this coupling is quite insensitive to alignment, which makes it repeatable from sample to sample. Our sample holder can be considered to be a multi-mode slab waveguide, which has a 3-layered refractive index structure (glass-sample-glass) surrounded by air on both sides. Such a waveguide has strong refractive index contrast at the air-glass interfaces (i.e., the top and the bottom surfaces), as a result of which the pump photons are tightly guided within this waveguide. On the other hand, the refractive index contrast at glass-sample solution interfaces are much weaker compared to air-glass interfaces, which permits a significant portion of the pump photons to leak into the sample solution to efficiently excite e.g., labeled cells/pathogens suspended within the sample. As can be seen in Fig. 2-5, this excitation is fairly efficient and uniform, and is quite repeatable from sample to sample. The same principles also apply to the capillary based fluorescent imaging as demonstrated in Fig. 6 and Supplementary Fig. 1,† where the pump light is guided within the tube.
Because the excitation modes of the sample structure propagate perpendicular to the detection path of our fluorescent microscope, ignoring scattering, the only detected photons would be the fluorescent emission coming from the excited samples. To eliminate detection of scattered pump photons (due to e.g., possible scratches on the surface of the glass sample or scattering from the cells/particles), an inexpensive plastic colour filter (Kodak Wratten Color Filter 12) is also used to improve our dark-field condition (see Fig. 1). Experimental results presented in the previous section illustrate the success of this approach despite its simple, compact and cost-effective design installed on a cell-phone camera unit.
With this imaging architecture, the acquired fluorescent images are stored at the cell-phone memory in jpg format, and can be viewed through the screen of the cell-phone after appropriate digital zooming (see e.g., Fig. 1 - bottom image). These jpg files (typically ~2–3 MB for an ~8 Mpixel image) can also be transferred to a computer (e.g., through memory cards or using wireless communication) for further digital processing, including but not limited to compressive decoding to fine resolve some of the overlapping fluorescent signatures in the raw images. If a smaller FOV is acceptable, the cell-phone also permits the capture of e.g., ~3 Mpixel images (corresponding to an FOV of ~20–30 mm2) which now can be stored with ~1 MB.
Sample preparation
Fluorescent bead sample preparation
Fluorescent beads with 10 μm diameter (red beads: product #F8834 excitation/emission 580 nm/605 nm; green beads: product #F8836: excitation/emission 505 nm/515 nm) were purchased from Invitrogen (Carlsbad, CA). To prepare the fluorescent bead samples, 10 μL of beads was mixed with 40 μL of DI water. Then 10 μL of this mixture was placed between two glass slides (12.5 mm × 17 mm) using a micropipette. Alternatively simple capillary action was also used to load the sample into capillary tubes as in Fig. 6. The sample was then inserted into the sample tray and slid into the cell-phone attachment (Fig. 1(top)).
White blood cell sample preparation
1X red blood cell lysis buffer (product #00-4333) was purchased from eBioscience, Inc (San Diego, CA) and stored at 4 °C. SYTO®16 green fluorescent nucleic acid stain (product #S7578, excitation/emission 488 nm/518 nm (+DNA) and 494 nm/525 nm (+RNA)) was purchased from Invitrogen (Carlsbad, CA). To prepare labeled white-blood cell samples, 1 mL of red blood cell lysis buffer was added to 200 μL of whole blood and incubated for 3 min. The lysed blood sample was then centrifuged and the white-blood cell pellet was re-suspended in 200 μL of PBS.13,14 Then 5 μL 1 mM STYO®16 solution was added to this 200 μL white blood cell sample and incubated in dark for ~30 min. After this incubation, the sample was centrifuged again. Supernatant was removed and the labeled white-blood cell pellet was re-suspended in PBS buffer. This labeled white blood cell solution was then placed between two glass slides (12.5 mm × 17 mm) and was imaged using our cellphone fluorescent microscope, as illustrated in Fig. 4.
Giardia lamblia sample preparation
Giardia Lamblia cysts were purchased from WaterBorne Inc. (New Orleans, LA, USA). The initial Giardia Lamblia cyst concentration was ~5 × 10⁶ parasites/mL which were all fixed in 5% Formalin/PBS at pH 7.4/ 0.01% Tween-20. 100 μL of this sample was centrifuged and the pellet was re-suspended into 100 μL PBS buffer. 2.5 μL 1 mM SYTO®16 solution was added to this 100 μL Giardia Lamblia sample and incubated in dark for ~30 min. After this incubation, the sample was centrifuged and the pellets were re-suspended in PBS buffer. The Giardia Lamblia sample was then placed between two glass slides (12.5 mm × 17 mm) and was imaged using our cell-phone fluorescent microscope, as illustrated in Fig. 5.
Compressive decoding of cell-phone images for enhanced fluorescent resolution
As illustrated in Fig. 2-3, the raw spatial resolution of our cellphone microscope is ~20 μm. This resolving power, however, can be digitally improved by processing the acquired cell-phone images based on compressive sampling algorithms. Compressive sampling (also known as compressive sensing)10-12 is a recently emerging field that aims to recover a sparse function from many fewer measurements or samples than normally required according to the Shannon’s sampling theorem.
Recently, we have applied compressive sampling theory to lensfree fluorescent imaging on a chip,15 where by using an l1-regularized least squares optimization algorithm16 we were able to achieve a spatial resolution that is much better than the incoherent point-spread function of the system would normally permit. This approach is especially powerful for imaging of randomly distributed rare cells/bacteria (suspended in a solution or captured within a micro-fluidic channel) since the sparsity constraint of compressive sampling is then rather easy to satisfy for practical samples of interest.
In this work, we took a similar approach and used compressive sampling to improve the resolving power of our raw fluorescent images by a factor of ~2 (see Fig. 3, 4). Towards this end, we first recorded fluorescent images of several isolated microspheres (4 and 10 μm diameter) using the cell-phone microscope. These single particle fluorescent images were then aligned with respect to each other based on their center-of-mass calculations.17 After normalization of each image, by averaging these aligned particle images, we created an incoherent point-spread-function (PSF) corresponding to our cell-phone microscope. With this well defined PSF, one can easily calculate the projected image on the CMOS sensor for any arbitrary distribution of fluorescent point sources located at the sample plane. Using this principle, we used an iterative algorithm16 to minimize the differences between the theoretically projected and the measured fluorescent images while also enforcing the sparsity constraint for the fluorescent channel.15 Mathematically, this recovery process can be expressed as an l1 -regularized least squares problem, such that:
where β > 0 is a regularization parameter; I is the detected raw fluorescent image at the sensor-array (in a vector form); M represents the 2D convolution matrix based on the measured incoherent PSF of our cell-phone; c̄ is the theoretical fluorescent source distribution that creates the image at the cell-phone sensor plane; and represents the lp norm of x̄. Based on this numerical recipe, we successfully decoded the raw fluorescent images acquired by our cell-phone microscope as illustrated in Fig. 3,4.
Finally, we should note that other numerical reconstruction approaches can also be used to improve our raw resolution. For example, Lucy–Richardson deconvolution algorithm15,18,19 can work very well with both sparse and non-sparse objects. However, the resolution that it can achieve with sparse objects is limited due to the fact that the prior knowledge of sparsity in the fluorescent object distribution is not fully utilized during the reconstruction process.
Conclusions
In conclusion, we have demonstrated wide-field fluorescent and darkfield microscopy on a cell-phone using a compact and light-weight attachment to the existing camera unit of the cell-phone to achieve ~10 μm resolution over a field-of-view of ~81 mm2. Weighing only ~28 g (~1 ounce), this compact and cost-effective fluorescent imaging platform attached to a cell-phone could be quite useful especially for resource-limited settings by providing an important tool for wide-field imaging and quantification of various lab-on-a-chip assays developed for global health applications, such as cost-effective monitoring of HIV+ patients for CD4 + T lymphocyte counts or measurement of viral load.
Supplementary Material
Acknowledgments
A. Ozcan gratefully acknowledges the support of NSF CAREER Award on BioPhotonics, the Office of Naval Research (ONR) under the Young Investigator Award 2009 and the NIH Director’s New Innovator Award – Award Number DP2OD006427 from the Office of The Director, National Institutes of Health. The authors also acknowledge the support of the Okawa Foundation, Vodafone Americas Foundation, DARPA DSO (under 56556-MS-DRP), NSF BISH program (under Awards # 0754880 and 0930501), NIH (under 1R21EB009222-01), and AFOSR (under Project # 08NE255). The authors also acknowledge A. F. Coskun for his assistance with the figures.
Footnotes
Electronic supplementary information (ESI) available: Supplementary Fig. 1 and 2. See DOI: 10.1039/c0lc00358a
References
- 1.International Telecommunication Union. Market information and statistics. 2010 http://www.itu.int/ITU-D/ict/statistics/index.html.
- 2.Woodward B, Istepanian RSH, Richards CI. IEEE Trans Inf Technol Biomed. 2001;5:13–15. doi: 10.1109/4233.908361. [DOI] [PubMed] [Google Scholar]
- 3.Martinez AW, Philips ST, Carrilho E, Thomas SW, III, Sindi Hayat, Whitesides GM. Anal Chem. 2008;80:3699–3707. doi: 10.1021/ac800112r. [DOI] [PMC free article] [PubMed] [Google Scholar]
- 4.Ruano-López JM, Agirregabiria M, Olabarria G, Verdoy D, Bang DD, Bu M, Wolff A, Voigt A, Dziuban JA, Walczak R, Berganzo J. Lab Chip. 2009;9:1495–1499. doi: 10.1039/b902354m. [DOI] [PubMed] [Google Scholar]
- 5.Granot Y, Ivorra A, Rubinsky B. PLoS One. 2008;3:e2075. doi: 10.1371/journal.pone.0002075. [DOI] [PMC free article] [PubMed] [Google Scholar]
- 6.Breslauer DN, Maamari RN, Switz NA, Lam WA, Fletcher DA. PLoS One. 2009;4:e6320. doi: 10.1371/journal.pone.0006320. [DOI] [PMC free article] [PubMed] [Google Scholar]
- 7.Tseng D, Mudanyali O, Oztoprak C, Isikman SO, Sencan I, Yaglidere O, Ozcan A. Lab Chip. 2010;10:1787–1792. doi: 10.1039/c003477k. [DOI] [PMC free article] [PubMed] [Google Scholar]
- 8.Shaner NC, Steinbach PA, Tsien RY. Nat Methods. 2005;2:905–909. doi: 10.1038/nmeth819. [DOI] [PubMed] [Google Scholar]
- 9.Lichtman JW, Conchello J-A. Nat Methods. 2005;2:910–919. doi: 10.1038/nmeth817. [DOI] [PubMed] [Google Scholar]
- 10.Candes EJ, Romberg JK, Tao T. Commun Pure Appl Math. 2006;59:1207–1223. [Google Scholar]
- 11.Candes EJ, Tao T. IEEE Trans Inf Theory. 2006;52:5406–5425. [Google Scholar]
- 12.Donoho DL. IEEE Trans Inf Theory. 2006;52:1289–1306. [Google Scholar]
- 13.Mudanyali O, Erlinger A, Seo S, Su T, Tseng D, Ozcan A. J Visualized Exp. 2009 doi: 10.3791/1650. [DOI] [PMC free article] [PubMed] [Google Scholar]
- 14.Seo S, Isikman SO, Sencan I, Mudanyali O, Su T, Bishara W, Erlinger A, Ozcan A. Anal Chem. 2010;82:4621–4627. doi: 10.1021/ac1007915. [DOI] [PMC free article] [PubMed] [Google Scholar]
- 15.Coskun AF, Sencan I, Su T, Ozcan A. Opt Express. 2010;18:10510–10523. doi: 10.1364/OE.18.010510. [DOI] [PMC free article] [PubMed] [Google Scholar]
- 16.Kim SJ, Koh K, Lustig M, Boyd S, Gorinevsky D. IEEE J Sel Topics Signal Process. 2007;1:606–617. [Google Scholar]
- 17.Su T, Isikman SO, Bishara W, Tseng D, Erlinger A, Ozcan A. Opt Express. 2010;18:9690–9711. doi: 10.1364/OE.18.009690. [DOI] [PMC free article] [PubMed] [Google Scholar]
- 18.Richardson WH. J Opt Soc Am. 1972;62:55–59. [Google Scholar]
- 19.Lucy L. Astron J. 1974;79:745–754. [Google Scholar]
Associated Data
This section collects any data citations, data availability statements, or supplementary materials included in this article.


