Abstract
The vibrations in the azido-, N3, asymmetric stretching region of 2′-azido-2′-deoxyuridine (N3dU) are examined by two-dimensional infrared spectroscopy. In water and tetrahydrofuran (THF), the spectra display a single sharp diagonal peak that shows solvent sensitivity. The frequency-frequency correlation time in water is 1.5 ps, consistent with H-bond making and breaking dynamics. The 2D IR spectrum is reproduced for N3dU in water based on a model correlation function and known linear response functions. Its large extinction coefficient, vibrational frequency outside the protein and nucleic acid IR absorption, and sensitivity to water dynamics renders -N3 a very useful probe for 2D IR and other nonlinear IR studies: its signal is ca. 100 times that of nitrile.
Introduction
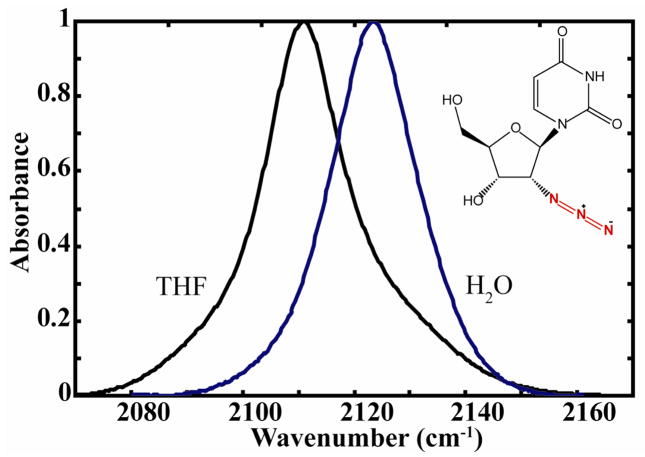
Infrared markers, such as nitriles and azides, have become useful as vibrational probes of biomolecules.1–8 In particular, ultrafast measurements of the stretching mode of the nitrile group in biological systems have provided local site-specific vibrational dynamics.9,10 Several studies, including peptide membrane interactions and drug-enzyme interactions, have taken advantage of the relatively sharp spectral features of nitriles that occur in a spectrally transparent region of most biological molecules while having sensitivity to the local environment.1,4,5,9–11 However, the relatively small absorption cross section of the nitrile vibrational transition compromises it’s utility for nonlinear IR work and necessitates use of higher concentrations than desirable for biological systems in both linear and nonlinear IR experiments; furthermore the absorption signal overlaps some water absorption bands. Thus, new vibrational probes are needed that are suitable to be used as biological probes.4,6 One promising candidate for nonlinear spectroscopy is the azido-, N3, group shown in Figure 1 associated with a nucleic acid, 2′-azido-2′-deoxyuridine (N3dU). The absorption cross section of azides is about one order of magnitude greater than nitriles allowing for much lower concentrations to be utilized. Also, the N3 transition, like CN, is sensitive to changes in the local environment. The aliphatic azides are stable under most conditions. The potential utility of the azido group as an infrared probe of local environment has been demonstrated in peptides and proteins.2,8 This utility has been further extended to nucleosides as infrared and NMR experiments.12 The azido- group has a relatively simple vibrational signature in the 2100 cm−1 region where one sharp transition is observed. It has sensitivity to the solvent environment2,8,12 and as such is suitable for detailed study by 2D IR methods13 from which the local fluctuation correlation functions can be determined.
Fig. 1.
FTIR spectra of 2′-azido-2′-deoxyuridine (inset: structure) in water (blue) and THF (black). (normalized to unity at the peak maximum) The extinction coefficient for H2O solvent is given in the text.
Two-dimensional infrared photon echo (2D IR) spectroscopy has been shown to be useful for understanding vibrational properties including spectral diffusion, intermode coupling, conformational analysis, chemical exchange, and many other properties.6,14–19 Although the spectral diffusion of the azide anion in both solution and bound as a ligand to peptides has been investigated by 2D IR,20–23 there is no such work on a covalently linked azido- group. The asymmetric N3 stretch is a sufficiently isolated band that its 2D IR time dependence should provide a clear signature of the frequency fluctuations of the associated solvent. The 2D IR signal can vary as the square of the extinction coefficient; so azido-could give 100 times the signal in 2D IR as nitrile. These azido-nucleosides present a challenge to 2D IR spectroscopy which in principle could measure the frequency-frequency correlation functions (FFCF) that determine the spectral diffusion contribution to the vibrational dynamics. The FFCF presents a direct measure of the local environment dynamics. The ability to measure the FFCF depends on the square of the absorption cross section of the FTIR bands, so the improvement of azido- over nitrile is significant for nonlinear spectroscopy. While there have been theoretical calculations of the frequency fluctuations of the azido- in water, experiments are not yet available.24 Here, we report the 2D IR of the N3 region of N3dU and capture the spectral diffusion in both water and THF. The frequency-frequency correlation function (FFCF) is determined for N3 in water and is used to simulate the 2D IR spectrum.
There have been difficulties in incorporating azides into nucleic acids using standard methods.25–27 Furthermore some DNA constructs with azido groups have been photoactive and unstable.28 An alternative approach for the incorporation of stable azides into DNA and RNA has been proposed in recent work.12 Through the FFCF the azide probe is proposed to be a useful monitor of site specific dynamics in environments such as the major groove, minor groove, and phosphate sugar region. In particular, the phosphate sugar region becomes accessible because of the much lower acidity of protons alpha to the azido group, which makes 2′-azido-nucleosides and oglionucleotides stable.26,29 The increased stability upon incorporation, the significant environmental sensitivity, and improved dipole strength suggest that the azido- group has significant potential as a 2D IR probe of the phosphate sugar region.
Experimental Section
Materials
Solutions of 20–25 mM N3dU (synthesized by methods found in reference 12) in water and tetrahydrofuran (THF, Fisher) were used for both 2D IR and FTIR experiments. The optical density of the samples ranged from 0.060–0.065 with a 25 μm path length CaF2 cell.
2D IR Method
Fourier-transform limited 75-fs pulses with a center frequency of 2123 cm−1 were used in the 2D IR experiments for the samples in THF and water. Three laser pulses each with an energy, ~ 400 nJ, having wave vectors k1, k2, and k3, were incident to the sample to generate a signal in the direction ks=−k1+k2+k3 with the ordering 123 (rephasing) and 213 (nonrephasing). To obtain absorptive spectra, the rephasing and nonrephasing 2D frequency spectra were properly phased and combined. To observe the dynamics of the spectra, the waiting time, T, between the second and third pulse, was varied from 0 to 2 ps for THF and 0 to 3 ps for water. After appropriate Fourier transforms along the coherence, τ, and detection, t, axes, The 2D IR spectra are plotted as ωτ vs.ωt.30 The vibrational relaxation time, T10, for the two main transitions were estimated from the signal strength of the 2D IR at different T values. More details of the 2D IR methodology are presented in the supplementary information.
Results
The linear IR spectrum of 2′-azido-2′-deoxyuridine in THF and water exhibits one band in the region of the N3 asymmetric stretching mode (Figure 1). The transition is observed in water at 2224 cm−1 with a peak extinction equal to 1160 ± 150 M−1 cm−1. A spectral shift of the band to higher frequency of approximately 14 cm−1 is observed when changing from the aprotic solvent, THF, to water. A FWHM of 18 cm−1 is observed in THF, and it increases to 22 cm−1 in water for the N3 mode. The bandwidth of the N3 band increases in water compared with THF. In water the shape is more Gaussian while in THF the Lorentzian component has increased and the band becomes asymmetric. A Gaussian 03 DFT frequency calculation using a B3PW91/6-31++G(d,p) level of theory for 2′-azido-2′-deoxyuridine predicts one allowed transition in the 2100 cm−1 region. As expected the mode is localized to the azido- group and corresponds approximately to an N3 asymmetric stretch.
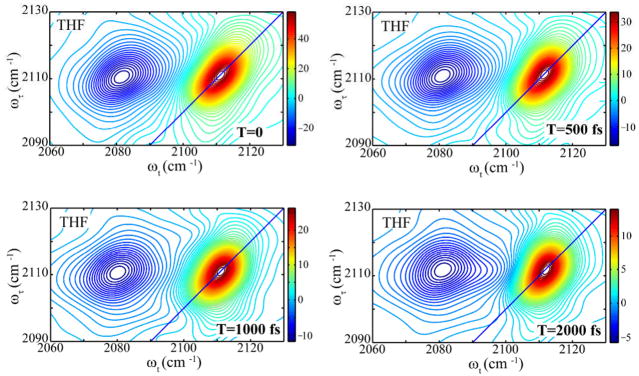
The 2D IR spectra (Figure 2) of N3dU in THF has at one positive peak along the diagonal at positions ωτ= ωt= 2110 cm−1 corresponding to the ν=0→ν=1 transition of the N3 asymmetric mode. The negative region peaked at ωt = 2082 cm−1 indicates an anharmonicity of ca 28 ± 1 cm−1. The peaks are tilted and elongated along the diagonal. The asymmetry observed in the linear FTIR lineshape contributes to the elongation along the diagonal of the 2D IR spectrum. The positive diagonal signals decay during T with a time constant of 0.8 ± 0.2 ps assumed to be due to population relaxation (T10). The slope at the intersection of the positive and negative peaks,31 which is a measure of the spectral diffusion, does not vary significantly as a function of waiting time up to ~2 ps in THF, and it does not decay to zero in the timescale of the experiment. On the contrary, the 2D IR peaks of N3dU in water form a two-dimensional pattern similar to that of THF but with shifted frequencies and a significant T-dependence of the slope (Figure 2 and 3).
Fig. 2.
Real part of the absorptive 2D IR spectra for 2′-azido-2′-deoxyuridine in THF at waiting times T=0 (top left), T=500 fs (top right), T=1.0 ps (bottom left), and T=2.0 ps (bottom right).
Fig. 3.
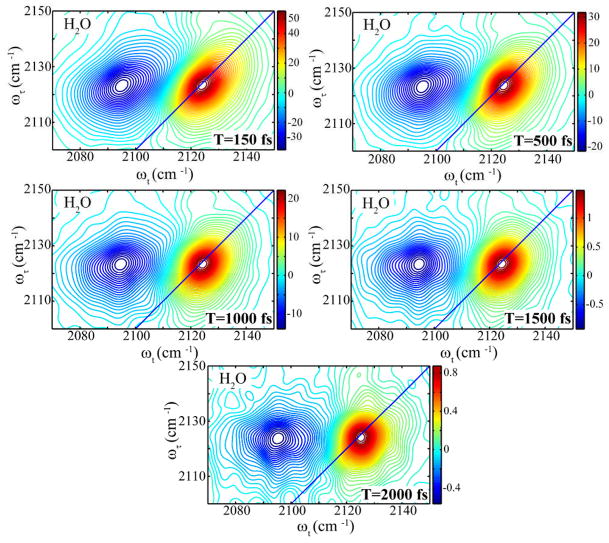
Real part of the absorptive 2D IR spectra for 2′-azido-2′-deoxyuridine in water at waiting times T=150 fs (top left), T=500 fs (top right), T=1.0 ps (middle left), T=1.5 ps (middle right), and T=2.0 ps (bottom).
In water, the N3 transition is observed as the positive peak at position ωτ= ωt= 2124 cm−1. The negative peak is shifted by 29 cm−1 by the anharmonicity. In contrast to the behavior in THF, the 2D IR of the N3 region (Figure 3) in water changes significantly with waiting time. At T=0 the inhomogeneously broadened transitions are tilted and elongated along the diagonal of the ωτ vs ωt plot. The elliptically shaped transitions become more circular and less tilted as the waiting time increases. This spectral behavior is related to the loss of correlation (spectral diffusion) between components of the inhomogeneous distribution of frequencies of the N3 mode in water (see below). The positive diagonal signal strengths decay exponentially with T, yielding the time constant of 1.1 ± 0.1 ps for the population relaxation. The N3 asymmetric stretch overlaps with the water combination band at 2127 cm−1.32 An increase in the spectral noise is observed after 1 ps resulting from the large thermal grating signal generated at all frequencies by the water combination band. This grating signal would be greatly diminished in D2O. The significant spectral diffusion resulting from the frequency fluctuations of the azido- group is more quantitatively evaluated below.
Frequency-Frequency correlation function (FFCF) and Simulation
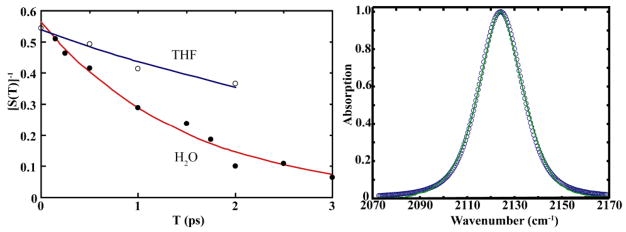
The correlation decay of the frequency fluctuations for the N3 mode can be obtained from the 2D IR spectrum. S(T) is defined as the slope of the tangential line of the zeroth contour between the positive and negative peaks of the ωτ versus ωt 2D IR spectrum. The T-dependence of the inverse slope, [S(T)]−1, of this nodal line marking the intersection between the positive ν=0→ν=1 and the negative ν=1→ν=2 transitions allows measurement of the correlation times31 that are long compared with the inverse bandwidth of the FTIR spectrum of the mode. The inverse slope versus T has been determined from the 2D IR spectrum of N3dU in both solvents (Figure 4 - left). The correlation decay times with the foregoing caveat were measured to be 1.5 ps for water and ~4.8 ps for THF. The intercept of the correlation decay is not equal to 1 at T=0 because the correlation at time zero is reduced by the homogeneous dephasing, , and T10.
Fig. 4.
Inverse Slope [S(T)]−1 vs population time for 2′-azido-2′-deoxyuridine in water (closed circles) and THF (open circles). The smooth lines are the corresponding fits to equations 1 and 2 using the parameters in the text (Right). Linear IR spectra of 2′-azido-2′-deoxyuridine. The solid line is the absorption experimental absorption line shape and the open circles are the fitted linear IR spectrum (Left).
Only for the azido- compounds in water was significant spectral diffusion observed over the timescale of the experiments. The single component decay of the normalized FFCF suggests a model correlation function of the form
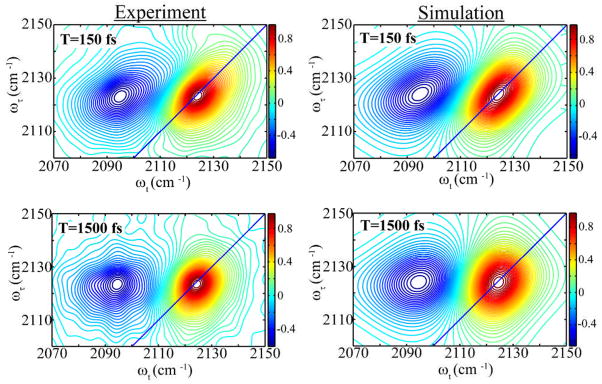
which contains: homogeneous dephasing ; the variance of frequency distribution, ; a static inhomogeneous component, ; and the observed correlation time, τc. The 2D IR was simulated (See SI) from the known echo response functions33 and the parameters from the fit of the linear FTIR that reproduced best the experimental slope were found to be , and Δ1 = 1.56 ps−1 for the N3 mode in H2O. The computation of the linear FTIR spectra from this correlation functions is shown in Figure 4 (right panel). The 2D IR spectra in water shown in Figure 5 are simulated for 150 fs and 1.5 fs.
Fig. 5.
Comparison of normalized 2D IR spectrum of 2′-azido-2′-deoxyuridine at 150 and 1500 fs from experiment (left) and simulation (right) using the model frequency-frequency correlation.
Discussion
The FTIR spectrum of 2′-azido-2′-deoxyuridine in water has a transition arising from the asymmetric stretch of N3. The significant solvent shifts in combination with the strong dipole strength, lineshape and bandwidth variations illustrate the sensitivity of this probe to different environments. The lineshapes of the bands vary significantly for the different solvents. The near Lorentzian lineshape of the N3 stretch in THF suggests that the transition is dominated by homogeneous broadening. The observed asymmetry of the N3 band in THF may be the result of a Fermi resonance. A more likely possibility is that two conformers of the molecule are present in THF whereas only one is seen in water. For example, both the north and south puckers of the sugar ring may be present in THF solution while only the north pucker is present in water.34 The N3 FTIR spectrum in THF can be fit reasonably to two Gaussians with a peak separation of 3 cm−1. A similar type of asymmetry of the N3 band was also observed in the FTIR spectrum of azidoalanine dipeptide in THF, as a result of two different conformations.2 The 2D IR results seem to further support this explanation and will be discussed below.
The 2D IR spectrum of the N3 mode in THF has a shape that is essentially independent of the waiting time. The ca. 5 ps or greater decay of the slope, S(T), indicates slow spectral diffusion (Figure 4) which is consistent with the presence of two conformers in THF, with each having a distinct transition. The presence of two different sugar puckers, would be manifested as a static inhomogeneous component ( ) in the frequency-frequency correlation function 35 which is what is observed. A full simulation of the THF spectra was not performed.
The significant changes in the spectral shape with T of the 2D IR spectrum in water result from homogenization of the frequency distribution (spectral diffusion). By 1.5 ps, the tilt has almost completely disappeared and the spectral shape has become circular. The drastic change in the spectral shape in water illustrates how clearly the 2D IR method exposes the dynamics of the water motions.21 The modeled FFCF generated parameters , Δ1, and τC that reproduced the FTIR spectrum (Figure 4), the decay of the slope, and shape of the 2D IR (Figure 5) reasonably well. The temporal evolution of the FFCF must manifest the characteristic time scales of the associated solvent. This clearly demonstrates that the azido- group can be used as a probe to directly measure the local water dynamics.
Based on experiments on water,36,37 carbonyls in water,38–41 and ions in water,35 the characteristic time for making and breaking of hydrogen bonds either with other water molecules or with polar solutes is 0.8–2.0 ps. The value of τC = 1.5 ps observed here for the N3dU asymmetric N3 stretch is therefore exactly what would be expected for water dynamics. So, it is interpreted as H-bond dynamics with the waters associated with the azido- group. Given the foregoing properties the azido- group asymmetric stretch mode is definitely usable as a sensitive vibrational probe of the solvent dynamics in a variety of systems. Its utility stems from: its frequency, which is well separated from protein and DNA absorptions and sensitive to solvent, its absorption cross section which is 10 times that of CN implying that 2D IR signals are increased by ca. 100 times; and the sensitivity of its FFCF to the environment of the probe. This probe, like amide C=O,38 will be very useful for identifying the presence of mobile water in biological systems.
Conclusions
The asymmetric stretching region of the N3 modes of 2′azido-2′-deoxyuridine are examined by two-dimensional infrared spectroscopy in water and THF. The correlation decay was directly measured from the 2D IR spectra to be 1.5 ps in water and >4.8 ps in THF. The comparison demonstrates the sensitivity of the correlation function of the azido- group to the solvent dynamics and in particular to H-bonding dynamics. A model FFCF reproduced the 2D IR spectrum in water. The azido- group should prove to be an excellent probe for studying the dynamics of proteins, protein water, and nucleic acid systems.
Supplementary Material
Acknowledgments
The research was supported by NIH, NSF, and instrumentation developed at the Research Resource (NIH P41RR001348) to RMH and NIH (R15GM093330) to SHB/EEF.
Footnotes
Electronic Supplementary Information (ESI) available: [details of any supplementary information available should be included here]. See DOI: 10.1039/b000000x/
References
- 1.Getahun Z, Huang CY, Wang T, De Leon B, DeGrado WF, Gai F. J Am Chem Soc. 2003;125:405–411. doi: 10.1021/ja0285262. [DOI] [PubMed] [Google Scholar]
- 2.Oh KI, Lee JH, Joo C, Han H, Cho M. J Phys Chem B. 2008;112:10352–10357. doi: 10.1021/jp801558k. [DOI] [PubMed] [Google Scholar]
- 3.Silverman LN, Pitzer ME, Ankomah PO, Boxer SG, Fenlon EE. J Phys Chem B. 2007;111:11611–11613. doi: 10.1021/jp0750912. [DOI] [PMC free article] [PubMed] [Google Scholar]
- 4.Suydam IT, Boxer SG. Biochemistry. 2003;42:12050–12055. doi: 10.1021/bi0352926. [DOI] [PubMed] [Google Scholar]
- 5.Tucker MJ, Getahun Z, Nanda V, DeGrado WF, Gai F. J Am Chem Soc. 2004;126:5078–5079. doi: 10.1021/ja032015d. [DOI] [PubMed] [Google Scholar]
- 6.Tucker MJ, Kim YS, Hochstrasser RM. Chem Phys Lett. 2009;470:80–84. doi: 10.1016/j.cplett.2009.01.025. [DOI] [PMC free article] [PubMed] [Google Scholar]
- 7.Watson MD, Gai XS, Gillies AT, Brewer SH, Fenlon EE. J Phys Chem B. 2008;112:13188–13192. doi: 10.1021/jp8067238. [DOI] [PubMed] [Google Scholar]
- 8.Ye SX, Huber T, Vogel R, Sakmar TP. Nat Chem Biol. 2009;5:397–399. doi: 10.1038/nchembio.167. [DOI] [PMC free article] [PubMed] [Google Scholar]
- 9.Suydam IT, Snow CD, Pande VS, Boxer SG. Science. 2006;313:200–204. doi: 10.1126/science.1127159. [DOI] [PubMed] [Google Scholar]
- 10.Fang C, Bauman JD, Das K, Remorino A, Arnold E, Hochstrasser RM. Proc Natl Acad Sci U S A. 2008;105:1472–1477. doi: 10.1073/pnas.0709320104. [DOI] [PMC free article] [PubMed] [Google Scholar]
- 11.Maienschein-Cline MG, Londergan CH. J Phys Chem A. 2007;111:10020–10025. doi: 10.1021/jp0761158. [DOI] [PubMed] [Google Scholar]
- 12.Gai XS, Fenlon EE, Brewer SH. J Phys Chem B. 2010;114:7958–7966. doi: 10.1021/jp101367s. [DOI] [PubMed] [Google Scholar]
- 13.Kim YS, Hochstrasser RM. J Phys Chem B. 2009;113:8231–8251. doi: 10.1021/jp8113978. [DOI] [PMC free article] [PubMed] [Google Scholar]
- 14.Edler J, Hamm P. J Chem Phys. 2003;119:2709–2715. [Google Scholar]
- 15.Fang C, Wang J, Charnley AK, Barber-Armstrong W, Smith AB, Decatur SM, Hochstrasser RM. Chem Phys Lett. 2003;382:586–592. [Google Scholar]
- 16.Fang C, Wang J, Kim YS, Charnley AK, Barber-Armstrong W, Smith AB, Decatur SM, Hochstrasser RM. J Phys Chem B. 2004;108:10415–10427. [Google Scholar]
- 17.Kim YS, Hochstrasser RM. Proc Natl Acad Sci U S A. 2005;102:11185–11190. doi: 10.1073/pnas.0504865102. [DOI] [PMC free article] [PubMed] [Google Scholar]
- 18.Kim YS, Hochstrasser RM. J Phys Chem B. 2006;110:8531–8534. doi: 10.1021/jp060935n. [DOI] [PMC free article] [PubMed] [Google Scholar]
- 19.Kumar K, Sinks LE, Wang JP, Kim YS, Hochstrasser RM. Chem Phys Lett. 2006;432:122–127. [Google Scholar]
- 20.Bandaria JN, Dutta S, Hill SE, Kohen A, Cheatum CM. J Am Chem Soc. 2008;130:22. doi: 10.1021/ja077599o. [DOI] [PMC free article] [PubMed] [Google Scholar]
- 21.Hamm P, Lim M, Hochstrasser RM. Phys Rev Lett. 1998;81:5326–5329. [Google Scholar]
- 22.Li SZ, Schmidt JR, Piryatinski A, Lawrence CP, Skinner JL. J Phys Chem B. 2006;110:18933–18938. doi: 10.1021/jp057568k. [DOI] [PubMed] [Google Scholar]
- 23.Lim MH, Hamm P, Hochstrasser RM. Proc Natl Acad Sci U S A. 1998;95:15315–15320. doi: 10.1073/pnas.95.26.15315. [DOI] [PMC free article] [PubMed] [Google Scholar]
- 24.Choi JH, Oh KI, Cho MH. J Chem Phys. 2008:129. doi: 10.1063/1.3001915. [DOI] [PubMed] [Google Scholar]
- 25.Sylvers LA, Wower J. Bioconjugate Chem. 1993;4:411–418. doi: 10.1021/bc00024a001. [DOI] [PubMed] [Google Scholar]
- 26.Polushin NN, Smirnov IP, Verentchikov AN, Coull JM. Tetrahedron Lett. 1996;37:3227–3230. [Google Scholar]
- 27.Jawalekar AM, Meeuwenoord N, Cremers JGO, Overkleeft HS, van der Marel GA, Rutjes F, van Delft FL. J Org Chem. 2008;73:287–290. doi: 10.1021/jo702023s. [DOI] [PubMed] [Google Scholar]
- 28.Evans RK, Haley BE. Biochemistry. 1987;26:269–276. doi: 10.1021/bi00375a037. [DOI] [PubMed] [Google Scholar]
- 29.Verheyde Jp, Wagner D, Moffatt JG. J Org Chem. 1971;36:250. doi: 10.1021/jo00801a002. [DOI] [PubMed] [Google Scholar]
- 30.Kim YS, Wang J, Hochstrasser RM. J Phys Chem B. 2005;109:7511–7521. doi: 10.1021/jp044989d. [DOI] [PubMed] [Google Scholar]
- 31.Kwac K, Cho MH. J Chem Phys. 2003;119:2256–2263. [Google Scholar]
- 32.Venyaminov SY, Prendergast FG. Anal Biochem. 1997;248:234–245. doi: 10.1006/abio.1997.2136. [DOI] [PubMed] [Google Scholar]
- 33.Ge NH, Zanni MT, Hochstrasser RM. J Phys Chem A. 2002;106:962–972. [Google Scholar]
- 34.Barbe S, Le Bret M. J Phys Chem A. 2008;112:989–999. doi: 10.1021/jp075777u. [DOI] [PubMed] [Google Scholar]
- 35.Kuroda DG, Vorobyev DY, Hochstrasser RM. J Chem Phys. 2010:132. doi: 10.1063/1.3285265. [DOI] [PMC free article] [PubMed] [Google Scholar]
- 36.Bakker HJ, Skinner JL. Chem Rev. 2010;110:1498–1517. doi: 10.1021/cr9001879. [DOI] [PubMed] [Google Scholar]
- 37.Kumar R, Schmidt JR, Skinner JL. J Chem Phys. 2007;126:12. doi: 10.1063/1.2742385. [DOI] [PubMed] [Google Scholar]
- 38.Hamm P, Lim MH, Hochstrasser RM. J Phys Chem B. 1998;102:6123–6138. [Google Scholar]
- 39.Schmidt JR, Corcelli SA, Skinner JL. J Chem Phys. 2004;121:8887–8896. doi: 10.1063/1.1791632. [DOI] [PubMed] [Google Scholar]
- 40.DeCamp MF, DeFlores L, McCracken JM, Tokmakoff A, Kwac K, Cho M. J Phys Chem B. 2005;109:11016–11026. doi: 10.1021/jp050257p. [DOI] [PubMed] [Google Scholar]
- 41.Kim YS, Liu L, Axelsen PH, Hochstrasser RM. Proc Natl Acad Sci U S A. 2009;106:17751–17756. doi: 10.1073/pnas.0909888106. [DOI] [PMC free article] [PubMed] [Google Scholar]
Associated Data
This section collects any data citations, data availability statements, or supplementary materials included in this article.


