


Abstract
Mismatch uracil DNA glycosylase (Mug) from Escherichia coli is an initiating enzyme in the base-excision repair pathway. As with other DNA glycosylases, the abasic product is potentially more harmful than the initial lesion. Since Mug is known to bind its product tightly, inhibiting enzyme turnover, understanding how Mug binds DNA is of significance when considering how Mug interacts with downstream enzymes in the base-excision repair pathway. We have demonstrated differential binding modes of Mug between its substrate and abasic DNA product using both band shift and fluorescence anisotropy assays. Mug binds its product cooperatively, and a stoichiometric analysis of DNA binding, catalytic activity and salt-dependence indicates that dimer formation is of functional significance in both catalytic activity and product binding. This is the first report of cooperativity in the uracil DNA glycosylase superfamily of enzymes, and forms the basis of product inhibition in Mug. It therefore provides a new perspective on abasic site protection and the findings are discussed in the context of downstream lesion processing and enzyme communication in the base excision repair pathway.
INTRODUCTION
DNA glycosylases are the enzymes that initiate base-excision repair (BER) by recognizing and removing base lesions. Mono-functional DNA glycosylases remove the base lesion through cleavage of the N-glycosidic bond, resulting in an apurinic/apyrimidinic (AP) site (1). The AP site is a substrate for the next enzyme in the repair pathway, an AP endonuclease, which cleaves 5′ of the abasic lesion, to leave a 3′-OH, enabling completion of repair by DNA polymerase and ligase.
The Escherichia coli mismatch uracil DNA glycosylase (Mug) was first identified on the basis of sequence similarity to the core region of the eukaryotic thymine DNA glycosylase (TDG) (2). It is a mono-functional DNA glycosylase initially cited as having activity against U·G (2) and T·G (3) lesions. Subsequent studies have identified ethenocytosine as its primary target, but with good activity against U·G (4,5). It has been reported as having a broad spectrum of activity against a variety of lesions (6–9), although for many of these, including T·G, the rates of reaction are unlikely to be of physiological significance (5). In vivo studies have demonstrated that it is expressed in the stationary phase of cell growth, although Mug mutants exhibit only a minor mutator phenotype (10), so its precise role remains something of an enigma.
One of the notable aspects of BER is that the intermediate AP lesions are frequently more unstable and thus potentially more damaging than the initial base lesion. There has thus been a great deal of interest in how the enzymes in BER are able to coordinate their action to minimize the escape of unstable intermediates. Several DNA glycosylases have been noted to have very slow rates of product dissociation including Mug (5) and TDG (11), and it has been suggested that this may be a general protective mechanism, whereby coordination of enzyme activity in BER is achieved through displacement of the DNA glycosylase by the downstream AP endonuclease. Numerous DNA glycosylases have now been cited as having an increased turnover in the presence of an AP endonuclease (12–21).
Such studies on DNA glycosylase/AP endonuclease interactions rarely discriminate between possible mechanistic models, which could either function via a passive mode, whereby the DNA glycosylase dissociates and the AP endonuclease then binds and cleaves the abasic site to relieve the product inhibition; alternatively an active mechanism would require the displacement of the glycosylase by the AP endonuclease, thus actively facilitating turnover of the DNA glycosylase. Many of the cited studies use a large excess of AP endonuclease to observe an effect, which may suggest a passive enhancement, although a recent study of TDG (21) used burst phase kinetics to demonstrate an active mechanism for TDG displacement by HAP1.
In light of the possible downstream interactions that delineate BER pathways, the mode of DNA binding by glycosylases is of significant interest. DNA glycosylases have generally been assumed to be monomeric functional enzymes, although cooperative binding has been observed for O6-alkylguanine-DNA alkyltransferase (22,23). TDG has also been observed to bind DNA with a 2:1 stoichiometry, although a 1:1 complex is sufficient for activity (24). Here we investigate the binding of Mug to its abasic DNA product and of an inactive Mug mutant enzyme to substrate DNA. We have identified differential binding modes between substrate and product and investigated the effects on catalysis.
MATERIALS AND METHODS
Protein purification
The mismatch uracil glycosylase from E. coli (Mug) was overexpressed and purified as described earlier (5). The concentration of the protein was calculated from the OD280, based on an extinction coefficient of 25 590 M−1cm−1 after concentration by ultrafiltration using the eluent for background correction. This method for determining protein concentrations was also verified using a Bio-Rad protein assay. Glycerol was added to 20% (v/v) based on the mass of glycerol added and its specific gravity (1.129 at 25°C), and aliquots of the enzyme were snap-frozen and stored at −20°C. Concentrations were re-measured by spectrometry after addition of glycerol to both enzyme and the eluent used for background correction. The N18A catalytic mutant was made by quick-change mutagenesis and was expressed, purified and quantified as above.
Oligonucleotide synthesis and purification
All oligonucleotides were synthesised by Eurogentec S.A. (Seraing, Belgium) and supplied HPLC purified, where necessary they were re-purified by HPLC as described earlier (25), but using a Thermo-Electron Surveyor HPLC system. Abasic and non-specific oligonucleotides have the same sequence 5′ GCT ATG GAC TAA XAA TGA CTG CGT G 3′ where X is the abasic tetrahydrofuran analogue (AP), cytosine (C) or uracil (U). Both oligonucleotides were labeled with 6-carboxy-2′,4,4′,5′,7,7′-hexachlorofluorescein (Hex) on their 5′-terminus. Double-stranded substrates were made by annealing the AP, C or U strand with an equimolar amount of the complementary strand containing a G opposite the abasic/non-specific site (5′ CAC GCA GTC ATT GTT AGT CCA TAG C 3′). The strands were annealed by heating to 90°C and cooling slowly to room temperature. The double-stranded substrates are referred to as HexAP·G, HexC·G or HexU·G. Unlabelled abasic competitor that was used for competition titration experiments contained the same sequence as HexAP·G, except it wasn’t labelled, and is referred to as AP·G. Oligonucleotides used in band shift assays were 5′ Hex GAC TAA XAA TGA CTG CG 3′, where X is the abasic furanose analogue, cytosine or uracil, and annealed to the complementary strand (5′ CGC AGT CAT TGT TAGTC 3′), as above, to give 17–AP·G, 17–C·G and 17-U·G, respectively. 17-U·G was also used in the glycosylase activity assays, and uracil was replaced by ethenocytosine in the relevant assays.
Oligonucleotide concentrations were determined by OD260 using extinction coefficients based on their nucleotide composition. Where Hex labels were present these were included in the calculation using ε260 31 580 M−1 cm−1 (Glenn Research). These were measured as single strands following purification to avoid hyperchromicity changes on formation of double-stranded DNA.
Equilibrium DNA binding assays
Equilibrium DNA binding assays were performed to examine the binding of Mug glycosylase to the 5′-hexachlorofluorescein-labelled oligonucleotides (HexAP·G, HexC·G and HexU·G). A Fluoromax-3 spectrofluorometer, fitted with automated polarization filters (Horiba Scientific) was used to measure fluorescence anisotropy. Data were recorded using an excitation wavelength of 535 nm and an emission wavelength of 556 nm. The binding assays were conducted at 25°C in 400 µl reaction volume in standard Mug binding buffer (50 mM Tris–HCl, pH 8.0, 1 mM EDTA and 50 mM NaCl), or with alternative concentrations of NaCl, as indicated. Small amounts of the enzyme were titrated into 100 nM of HexAP·G, HexC·G or HexU·G. Five measurements of anisotropy were made and averaged and each protein titration repeated at least in duplicate. Data were fitted using Grafit 6 with a Hill equation (Erithacus Software) or a tight binding equation (26).
Time-resolved fluorescence anisotropy analysis
Fluorescence decays were collected using a custom built time-resolved spectrofluorometer, incorporating a tunable picosecond excitation source with spectrally and polarization resolved detection by time-correlated single photon counting, as previously described in Manning et al. (27). Enzyme titrations were performed as described earlier. Excitation was set to 530 nm with emission collected at 550 nm. Decays were measured at polarizations angles parallel, perpendicular and at the magic angle to the excitation. Typical acquisition times were 30 s at each polarization setting. An instrument response function was measured using a scattering solution of LUDOX and a G-factor was measured using rhodamine B in methanol.
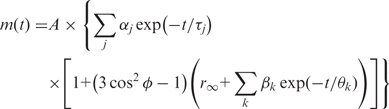
Analysis of the fluorescence anisotropy decays was performed using TRFA data processor (Scientific Software Technologies Center, Minsk, Belarus). The data were fitted using the anisotropy model shown in Equation 1 (28). In this equation m(t) is the polarization intensity at time t. A is the parameter that accounts for the different detection efficiencies of the system at different polarization angles and in this case the measured G-factor was used. αj is the pre-exponential associated with the lifetime value τj,  is the polarization angle,
  is the limiting anisotropy and βk the pre-exponential associated with the rotational correlation time θk.
 |
(1) |
The goodness of fit was judged based on the reduced χ2-value and visual inspection of the residuals. The data were best fitted using two fluorescence lifetime components and two rotational correlation times.
Bands shift assays
In a standard assay (50 µl volume), 100 nM Hex-labelled oligonucleotide duplex was incubated with increasing concentrations of either wild-type or N18A Mug in reaction buffer [50 mM Tris–HCl, pH 8.0, 50 mM NaCl, 1 mM EDTA and 0.1 mg ml−1 bovine serum albumin (BSA)] at 25°C for 30 min. Prior to loading, samples were mixed with glycine betaine to a concentration of 1 M, left for 5 min and then mixed with 6× loading buffer (0.042% bromophenol blue) and loaded immediately onto an 8% polyacrylamide gel, which had been pre-run at constant 40 V in 1× TBE buffer for 60 min at 4°C. Glycine betaine has been shown to act as an osmolyte that stabilizes protein–DNA interactions, which is particularly important during loading of a native gel (29). PAGE was performed at constant 40 V in 1× TBE buffer for 220 min at 4°C. The gels were visualized using a Fuji FLA-5000 fluorescent image analyzer and band intensities quantified using PhoretixTM 1D software. Data were fitted using GraFit 6 (Erithacus Software).
DNA glycosylase activity assays
In order to determine the optimal Mug:DNA ratio for maximum glycosylase activity, 200, 400, 600 nM 17-U·G was incubated with increasing amounts of Mug for 15 min. The substrate was reacted at 25°C with Mug in reaction buffer (50 mM Tris–HCl, pH 8.0, 50 mM NaCl, 1 mM EDTA and 0.1 mg ml−1 BSA), or with NaCl concentration as indicated. At selected time points, 10 µl samples were removed and quenched with 10 µl aliquots of 0.1 M NaOH. The quenched samples were then heated to 90°C for 30 min to cleave the abasic site. An equal volume of formamide loading buffer (95% formamide, 0.02% bromophenol blue and 20 mM EDTA) was added before loading onto a 20% denaturing PAGE. Imaging and analysis was as above.
RESULTS AND DISCUSSION
Time-resolved measurements of fluorophore in DNA binding by Mug
The binding of enzymes to fluorescently labelled DNA can be monitored via fluorescence anisotropy since the binding of DNA by Mug increases the size of the fluorescent entity and therefore slows its rotational diffusion (rotational correlation time). This can be conveniently read out by steady-state fluorescence anisotropy measurements, which have frequently been used as a convenient means for measuring DNA binding in free solution (30,31). Unfortunately, while the steady-state anisotropy varies with the rotational correlation time, it is also a function of the fluorescence lifetime, and changes in fluorescence lifetime upon binding can introduce significant ambiguity into anisotropy measurements (32). Experiments directly measuring the rotational correlation time are more rigorous, but also much more time-consuming and require more complex instrumentation. Here we aim to monitor DNA binding processes using convenient steady-state fluorescence anisotropy measurements and would like also to validate such measurements as well an estimation of the size of the bound complex from the rotational correlation time.
We used a multidimensional fluorimeter (27) to determine the variation in rotational correlation time, fluorescence lifetime and steady-state anisotropy as a function of Mug binding to double-stranded 5′ Hex labelled oligonucleotides. The DNA molecules either contain an abasic analogue (AP), or are non-specific and are simply composed of normal DNA bases. In the former case the labelled oligonucleotide with the AP site is annealed to an unlabelled complementary strand so that the AP site is opposite a G, and is thus equivalent to the enzymes reaction product (HexAP·G); in the non-specific DNA a C in the labelled strand is opposite the same G (HexC·G).
Time-resolved fluorescence anisotropy measurements were made as Mug was titrated into HexAP·G DNA (100 nM) with the magic angle position serving as an internal control. Analysis of the fluorescence and anisotropy decay profiles required that the data were fitted to a double exponential model resulting in short and long rotational correlation times (Supplementary Figures S1 and S2, Table S1). The short rotational correlation time (0.28 ± 0.08 ns) did not change significantly with the addition of Mug and can be attributed to the fast rotational diffusion of the Hex about its flexible linker, which would not be affected by the binding of Mug (31). The second rotational correlation time increased from ∼3 to 19 ns (Figure 1A), and was attributed to the overall rotational diffusion of the enzyme–DNA complex, which varied as expected with increased Mug binding. Comparison with calculated values for rotational correlation times demonstrate that the observed saturation values of 19 ns are in line for what is expected for two molecules of Mug binding to one molecule of DNA (18.7–22.6 ns; Supplementary Table S2) and is significantly higher than the calculated value for a single Mug binding to DNA (7.3–8.8 ns).
Figure 1.

Time-resolved anisotropy measurements of HexAP·G DNA upon binding by Mug. The rotational correlation times were determined from the fluorescence lifetime decay profiles collected with a vertical excitation polariser, and the emission polariser set at vertical, horizontal and magic angle positions. The decay of the fluorescence anisotropy over the lifetime of the fluorophore could then be determined and fitted to a double-exponential to resolve two rotational correlation times θ1 and θ2, which are shown plotted against Mug concentration (A). The variation in the corresponding steady-state anisotropy (B) and Hex average fluorescence lifetime (C) have also been calculated from the same acquired data set. (Supplementary Data).
While this is a useful and robust readout of Mug binding, the data acquisition and analysis is time consuming and steady-state anisotropy measurements would be more convenient. Figure 1B shows how the corresponding steady-state anisotropy calculated from the same data set varied with Mug binding and it clearly reproduces the same trend as the long rotational correlation time (Figure 1A). This suggests that there is not a significant change in fluorescence lifetime of the Hex upon Mug binding and this is confirmed by Figure 1C, which shows the average lifetime variation is relatively small (∼5%) and will thus have only a minor affect on steady-state anisotropy measurements.
DNA binding by Mug
Having validated the steady-state anisotropy measurements, we used a conventional fluorimeter (Fluoromax-3) to measure the binding of the Mug enzyme to labelled oligonucleotides by titrating Mug into both abasic HexAP·G and non-specific HexC·G DNA molecules. When Mug was titrated against abasic product DNA, a sigmoidal response, characteristic of cooperative binding, was observed and the data is shown with the best fit to the Hill equation, which describes cooperative binding of multiple ligands (Figure 2A). The Hill coefficient is a measure of the cooperativity of the system, it gives a measure of the minimum number of interacting ligands, although it is not a direct measure of stoichiometry (33). It should also be noted that the Kd is an average value of all bound protomers and thus does not represent a discrete value for binding to the abasic product site.
Figure 2.

DNA binding. Wild-type and N18A Mug were titrated into Hex labelled DNA and the anisotropy of the fluorophore monitored as described for binding reactions (‘Materials and Methods’ section). Representative data are shown for abasic HexAP·G (A and C), HexC·G (B and D) and substrate HexU·G (E) oligonucleotides, with the enzyme indicated. In each case 100 nM DNA was used and anisotropy was observed on Mug titration. Data are shown with the best fit to either the Hill equation or the tight binding equation with the following values: (A) Hill equation, Kd = 187 ± 3 nM, nH = 3.4 ± 0.2; (B) tight binding, Kd = 7 ± 0.9 nM; (C) Hill equation, Kd = 260 ± 2 nM, nH = 5.5 ± 0.2; (D) Hill equation (solid line), Kd = 126 ± 2 nM, nH = 1.8 ± 0.1; tight binding (dashed line), Kd = 17 ± 4 nM and (E) Hill equation (solid line), Kd = 119 ± 2 nM, nH = 1.6 ± 0.04; tight binding (dashed line), Kd = 60 ± 3 nM.
When Mug was titrated into the non-specific HexC·G DNA an increase in anisotropy was observed that was best fitted to a tight binding equation, with a Kd of 7 nM (Figure 2B). This demonstrates that Mug binds tightly to the non-specific DNA, but that it does so in a non-cooperative manner.
Substrate binding by Mug
The above data clearly indicate a different mode of binding for product and non-specific DNA. It is also valuable to consider how Mug binds its substrate. To this end we made a mutation in the active site of Mug. Based on structural homology to the well-characterized uracil DNA glycosylase enzymes, it has been predicted that the N18 residue of Mug is an essential catalytic residue (3,34). Mutation of the equivalent residue TDG (N140) to alanine effectively abolishes catalytic activity of the enzyme, but remains proficient in binding both substrate and product (35). We have made the N18A Mug mutant and determined that it is deficient in catalytic activity with both U·G and ethenocytosine·G (εC·G) substrates (Supplementary Figure S3).
Initially we examined the binding of N18A Mug to HexAP·G, and a similar response was observed to the wt enzyme (Figure 2C). With the non-specific HexC·G the data fitted better to a cooperative equation than the tight binding equation, although there was clearly a less pronounced sigmoidal response than for either enzyme with HexAP·G DNA (Figure 2D). With the N18A enzyme, it was notable that the sigmoidal binding curve for the abasic DNA was exaggerated and that the non-specific binding was slightly weaker, as compared to wild-type. We cannot exclude the possibility that the N18A preparation contains a proportion of inactive enzyme, which would account for these minor differences from wild-type. However, it is clear from the general trend that DNA binding properties are similar for both the wild-type and mutant enzymes.
When N18A Mug was titrated into HexU·G substrate DNA, a binding isotherm was obtained that was essentially identical to the non-specific HexC·G (Figure 2E). The degree of cooperativity for the substrate DNA was in fact slightly less pronounced than for the non-specific DNA. It is notable that the overall change in anisotropy is comparable for both DNAs, indicating that the overall binding stoichiometry is similar.
There is clearly a different mode of binding for wild-type enzyme between non-specific and product DNAs, while for the N18A mutant the same is true when comparing product to substrate and non-specific DNAs. It cannot be ruled out that the similarity of binding for the N18A mutant with substrate and non-specific DNA is due to perturbation of the Mug enzyme by the mutation. However this seems unlikely given the similarity to the wild-type binding isotherms with product and non-specific DNAs. The implication, therefore, is that cooperative binding of DNA by Mug is a much more significant feature of product binding, rather than substrate or non-specific DNA binding.
Salt dependence of DNA binding by Mug
The interactions of proteins and DNA are typically highly salt dependent, due to the electrostatic interactions with the phosphodiester backbone. We investigated the binding of Mug to abasic and non-specific DNA with increasing NaCl concentrations to determine the effects on cooperativity in binding (Supplementary Figure S4). With non-specific HexC·G DNA, increasing the NaCl progressively decreased binding affinity: at 150 mM Kd is reduced 3-fold; at 300 mM NaCl binding is so weak that saturation cannot be reached. With abasic HexAP·G DNA increasing NaCl reduced the cooperativity: at 150 mM NaCl, nH is reduced to 1.9, suggesting a cooperative interaction between two Mug enzymes, while at 300 mM NaCl cooperativity disappears (nH = 1) and a hyperbolic response is observed with a significantly weaker Kd.
Competition binding
To further investigate the stoichiometry of Mug:DNA binding we performed competition experiments, starting with a pre-bound mixture of Mug and HexAP·G DNA and competing off the enzyme with increasing concentrations of unlabelled AP·G. The initial concentration of HexAP·G was at 500 nM, to be above the Kd for the abasic product and the concentration of Mug in the initial complex was increased in stoichiometric equivalents from a 1:1 ratio with the DNA up to 4:1 (Figure 3). With an initial 1:1 stoichiometry of Mug:HexAP·G, the initial observed anisotropy was very low, and this was readily competed off with unlabelled competitor AP·G DNA. At 2:1 the initial anisotropy was much higher, and this was competed off directly with unlabelled AP·G. At higher stoichiometric equivalents of 3:1 and 4:1, the starting anisotropy was slightly higher than with 2:1, but there was a lag before the unlabelled DNA was able to compete off the labelled Mug:DNA complex.
Figure 3.

Competition binding experiments. 500 nM Hex-AP·G was incubated with 500, 1000, 1500 or 2000 nM Mug in standard Mug binding buffer at 25°C for 15 min to reach equilibrium. Increasing amounts of unlabelled abasic DNA (AP·G) were titrated in and anisotropy was measured. Representative anisotropy data are shown plotted (A) versus concentration of competitor DNA and (B) versus the stoichiometric balance, calculated as the stoichiometry of Mug:HexAP·G [(Mug)/(HexAP·G)], minus the stoichiometric equivalents of unlabeled DNA added [(AP·G)/(HexAP·G)].
At low Mug concentration the initial observed anisotropy was very low, indicating that the majority of the DNA was unbound and that a 1:1 stoichiometry of Mug:DNA was insufficient to fully bind the abasic HexAP·G. At 2:1 the observed anisotropy was much higher, consistent with a near-saturated complex. The relatively small increase in anisotropy observed with higher Mug concentrations was most likely due to additional non-specific binding of Mug. The lag observed with higher enzyme concentrations is consistent with the unlabelled competitor first binding excess free Mug, or Mug bound in a weak non-specific manner. Only once this excess Mug has been bound, does the competitor begin to compete for Mug bound in a tighter, specific complex.
The stoichiometry can be further examined by plotting the anisotropy versus the stoichiometric balance, calculated from the stoichiometry of Mug:DNA minus the stoichiometric equivalents of competitor DNA added (Figure 3B). Plotting the data in this way clearly demonstrates that the specific complex is only competed off once there is a stoichiometry of 2:1 Mug:HexAP·G remaining. The slight shift to the right of the higher concentration curves can be accounted for by additional non-specific binding of Mug to HexAP·G. The observed competition data are thus consistent with cooperative binding of Mug to the abasic DNA product in a specific complex with a 2:1 stoichiometry.
Analysis of Mug:DNA complexes
To further our understanding of the complexes formed by Mug on binding DNA, we performed band-shift assays with both abasic product DNA and non-specific DNA. Band shift assays depend on the change in migration of DNA upon binding by a protein during non-denaturing PAGE. It has the advantage that species of different MW, due to binding of one or more proteins, can be resolved by a change in mobility. Initial experiments indicated that the 25 bp DNA molecules used in the anisotropy assays gave rise to multiple bands that complicated the analysis, further experiments were therefore performed with 17 bp DNA molecules (17-AP·G and 17-C·G; Supplementary Figure S5).
When Mug is titrated into 17-AP·G DNA, a clear shifted band is formed, while at higher concentrations a second higher MW band is formed (Figure 4A). Analysis of this extended titration quantified the bound fraction, but a tight-binding equation was unable to fit the data with a defined DNA concentration of 100 nM, although fitting the same data to a cooperative equation provided a good fit to the data with a Kd of 111 nM, and nH of 1.7 (Figure 4B). The stoichiometry of the complex was determined by replotting this data against (Mug)/DNA, where fitting to the tight binding equation gave a stoichiometry of 2.08 and Kd of 115 nM (Figure 4B, inset).
Figure 4.

Band shift assays. (A) Mug was titrated into 100 nM 17-AP·G at the concentrations indicated, and bound complexes resolved by native PAGE (‘Materials and Methods’ section). (B) The above gel was quantitated to determine the percentage bound DNA (PhoretixTM 1D) this is shown with the best fit to a cooperative equation (solid line) with Kd = 111 ± 2 nM and nH = 1.7 ± 0.06, as well as the best fit to a tight binding equation (dashed line) with the total DNA concentration fixed at 100 nM and a Kd of 68 ± 7 nM: inset is the data replotted against Mug/DNA with the best fit to a tight binding equation with a stoichiometry (Mug/DNA) of 2.09 ± 0.08 and Kd = 115 ± 0.03 nM. (C) Mug was titrated into 100 nM 17-C·G at the concentrations indicated, a control lane with 17-AP·G was included for comparison; arrows indicate the position of the retarded bands for the non-specific DNA (I and III) and double-headed arrows for the abasic DNA (II and IV). (D) Lane profiles were calculated for lanes 6 (solid line, scale offset for clarity); 7 (dots, scale offset for clarity); 8 (dashed line) (PhoretixTM 1D), positions of the bands in (C) are indicated on the profiles.
This analysis concurs with an inspection of the band shift, where it can be seen that, at 1:1 Mug:DNA (100 nM Mug), <50% of the DNA is bound, and the bound complex does not begin to reach saturation until it approaches a 2:1 stoichiometry at 200 nM Mug. Therefore, the best interpretation of this data is that the first bound complex corresponds to two molecules of Mug binding to the abasic DNA product in a cooperative manner. The formation of the higher retarded complex is due to the binding of further Mug molecules, although since this band forms a minor component it cannot be analysed in detail, but most likely arises from additional, non-specific binding.
When band shift assays were performed with the non-specific 17-C·G DNA, it was notable that there was a greatly increased level of smearing (Figure 4C). Despite the tight binding of Mug to non-specific DNA in the anisotropy assays, it is evident that under the conditions of the band shift assay the non-specific complexes are not as stable; this is most likely governed by the off-rate of the complex, which must be higher for non-specific DNA. Although the bands are not easy to resolve, examination of the lane profiles demonstrates the presence of two distinct bands, one migrates faster than the product complex and the other, better defined complex, migrates slower (Figure 4C and D). These most likely correspond to the binding of one or two molecules of Mug to the DNA. Comparison of the abasic and non-specific complexes is revealing, as it is evident that the first shifted band with the abasic DNA is significantly more retarded than the first non-specific complex. This is consistent with the abasic complex being a dimer of Mug bound to DNA, but in a more compact enzyme–DNA complex, which migrates faster than two non-specifically bound Mug molecules.
We also performed band shift experiments with N18A Mug, and with both abasic and non-specific DNA molecules identical band shift patterns to the wt enzyme were observed (Supplementary Figure S6). When band shift experiments were performed with N18A Mug and the same sequence of DNA containing a U·G mismatch (17-U·G) in place of the abasic site, the same banding pattern and affinity as non-specific DNA was observed (Supplementary Figure S6). With both the wild-type and N18A enzymes and the non-specific or substrate DNAs, the higher retarded band is more pronounced suggesting some degree of cooperativity in these interactions, although the poor resolution of these complexes prevented detailed analysis.
Analytical ultracentrifugation
Since we have observed the binding of multiple molecules of Mug to DNA in both anisotropy and band-shift assays, we wished to determine whether Mug exists as a monomer or dimer in free solution. Analytical ultracentrifugation was therefore performed with Mug. The data provided an unequivocal analysis that in solution Mug is in a monomeric form (Supplementary Figure S7). Further analysis of Mug:DNA complexes was not possible since band shift assays clearly demonstrated that it exists in multiple species. Analysis of multiple components by analytical ultracentrifugation is very complex and this prevented further examination of DNA binding by Mug using this technique.
Activity of Mug: DNA complexes
The data presented above clearly demonstrates higher order binding complexes of Mug with its abasic product DNA. However, it does not provide any indication of whether this has an impact on the catalytic function of the enzyme. We therefore performed activity assays with Mug and a Hex labelled oligonucleotide containing a U·G mismatch. Different concentrations of DNA were incubated with increasing concentrations of Mug under standard reaction conditions. All reactions were allowed to proceed for 15 min before being quenched with NaOH. Under saturating conditions, Mug is known to cleave this substrate fully in 100 s (5), so this reaction provides ample time for full cleavage of the substrate. Since we have also established that Mug has very poor turnover kinetics (5) there will be very few multiple reactions of the enzyme within this time phase.
The results of these reactions are plotted as the decrease in substrate against the Mug:DNA ratio (Figure 5). As the concentration of Mug is increased, the concentration of substrate decreases in a linear fashion until complete cleavage is observed. In each case, complete cleavage coincides with an enzyme concentration that is double the DNA concentration (Figure 5). This is consistent with the 2:1 binding stoichiometry observed above (Figure 3).
Figure 5.

Stoichiometric dependence of Mug activity. 200, 400 and 600 nM HexU·G was incubated with increasing concentrations of Mug in reaction buffer at 25°C. The reaction was allowed to proceed for 15 min before quenching with NaOH and analysing by denaturing PAGE. Product formation was analysed (PhoretixTM 1D) and depletion of substrate plotted against (Mug)/(DNA).
Salt dependence of Mug activity
We observed above that the interaction of Mug with DNA was significantly affected by NaCl: as NaCl increased Kd also increased, and with the abasic DNA cooperativity decreased. Reactions were performed with 100 nM Hex U·G and 5 µM Mug, binding analysis has demonstrated that this will provide a saturated enzyme–DNA complex under all salt conditions (Supplementary Figure S4). Each reaction was sampled at increasing time points and analysed by denaturing PAGE as before.
At 50 mM NaCl the rate of reaction was consistent with that previously observed under saturating conditions (5). At 150 mM NaCl, the observed rate drops only 4-fold, whereas at 300 mM NaCl the reaction fails to go to completion after 30 min, and the reaction rate is ∼400-fold lower than at 50 mM NaCl (Figure 6).
Figure 6.

Salt dependence of Mug activity. 100 nM HexU·G was incubated with 5 µM Mug in reaction buffer containing 50 mM (solid circles), 150 mM (open circles) or 300 mM NaCl (solid triangles) at 25°C. The reaction was allowed to proceed for the time shown before quenching, with analysis as before (Figure 5). Data for the product formation is shown with the best fit to a single exponential with rates at 50 mM NaCl of 0.062 ± 0.003 s−1; at 150 mM NaCl of 0.0161 ± 0.002 s−1; at 300 mM NaCl the rate was calculated by fixing the end point of the equation to 95% product, which gave a good fit with a rate of 1.5 x 10⁻⁴ ± 4 × 10⁻⁶ s−1.
CONCLUSIONS
DNA Binding
We have investigated the binding of wild-type and a catalytic mutant of Mug with substrate, product and non-specific DNAs. The sigmoidal response of the DNA binding isotherms with abasic DNA demonstrates a significant degree of cooperativity in product binding by Mug. This cooperativity can only arise through interactions between molecules of Mug once bound to the DNA, and analytical ultracentrifugation demonstrates that Mug is a monomer in solution (Supplementary Figure S7). Multiple binding of non-interacting proteins would produce a hyperbolic response with a Kd equal to the mean value for all bound molecules. The results therefore establish a differential binding mode between abasic product DNA and non-specific DNA.
The N18A catalytic mutant bound to substrate and non-specific DNAs in exactly the same manner. Although we cannot rule out that the mutant had an effect on the mutant’s ability to recognize its substrate, binding of both non-specific and product DNA closely resembled wild-type behaviour, suggesting that DNA binding was not significantly altered by the mutation. Furthermore, structural analysis of the N18 residue predicts that it has a catalytic role, but is not involved in substrate recognition (3), and mutation of the equivalent catalytic residue in the structurally homologous TDG and uracil DNA glycosylase (Udg) does not affect substrate recognition (26,35). While there are some indications of cooperative binding to substrate and non-specific DNAs, this is clearly less pronounced than with the abasic DNA. Both mutant and wild-type data indicate that Mug forms strongly cooperative interactions when binding to abasic product DNA.
Stoichiometry of DNA binding and activity
The stoichiometry of the Mug:abasic DNA complexes were investigated using a number of techniques. Both competition anisotropy binding and gel shift experiments indicate that there is a major 2:1 Mug:DNA complex, with additional non-specific binding (Figures 3 and 4). The band shift assays provide a clear perspective on this, and additionally indicate that the specific product complex has a significantly faster migration than two Mug enzymes bound to non-specific DNA: the faster migration indicating formation of a tight complex. This conclusion is supported by the calculation of the rotational correlation time of the bound enzyme-product complex, which is clearly too long for a monomer complex, but is within the region expected of a dimeric complex (Figure 1, Supplementary Table S2).
While these data indicated the formation of a specific 2:1 complex with product DNA, it was not clear whether this was of importance for the catalytic activity of the enzyme, since binding to non-specific and substrate DNA is either non-cooperative or only relatively weakly cooperative (Figure 2). Activity assays with varying Mug:DNA ratios were performed to address this question, and clearly demonstrated that a 2:1 ratio was required for cleavage of the substrate. However, it is known that the single turnover cleavage rate of Mug is reasonably slow for an enzyme, at 0.04 s−1 for this substrate (5). It is therefore possible that Mug cleaves the substrate as a monomer, but then cooperative binding to the abasic product sequesters Mug out of the reaction, limiting turnover and resulting in the observed 2:1 dependence.
As a further investigation to this we also performed salt dependent reactions with Mug, as the cooperativity with the abasic DNA is still present at 150 mM NaCl, but absent at 300 mM NaCl (Supplementary Figure S4). The data exhibited a 4-fold decrease in rate at 150 mM NaCl, but a 400-fold decrease at 300 mM NaCl (Figure 6). On the basis of these two experiments it may be postulated that the dimeric binding of Mug to DNA facilitates cleavage, although it does not constitute proof. It would be difficult to discriminate between models whereby a second Mug enzyme facilitates cleavage through stabilization of the enzyme-substrate complex, and the above mentioned product sequestration model. Regardless of the fine mechanism, cooperative binding has a functional impact on Mug activity.
Taken together, these results clearly demonstrate the importance of the 2:1 stoichiometry for product binding by Mug. Furthermore, the salt dependence of DNA binding by Mug also indicates a reduction in non-specific binding at physiologically relevant salt concentrations leading to a minimal functional dimer. Although indirect, this implies that the dimerization is of relevance to in vivo conditions. DNA glycosylases have generally been assumed to act as monomers. There has previously been no report of a member of the uracil DNA glycosylase superfamily (36) either acting as a dimer, or binding its product in a cooperative manner. However, there has been a report that MutY acts as a dimer (37). In addition, the O6-alkylguanine-DNA alkyltransferase also binds DNA in a highly cooperative manner and is proposed to form multimers on DNA (22,23).
Enzyme–DNA complexes
In the first reported enzyme–DNA structures of Mug, the DNA formed an unusual structure, whereby it formed an overlapping pseudo-continuous DNA helix with a nick opposite each abasic site (3). Although this resulted in mispaired DNA bases, it enabled every Mug enzyme in the crystal to bind to an abasic DNA site. Intriguingly, there are contacts between neighbouring pairs of Mug enzymes on the same extended DNA molecule (PDB, 2RBA). This was not reported in the original paper since there was no indication that they were anything other than fortuitous crystal contacts. However, given the results that we present here, it is possible that this interaction may be of greater significance.
TDG is a homologue of Mug and recent reports of its crystal structure have demonstrated a very high degree of structural conservation between the two enzymes. Interestingly, a recent structure of the TDG catalytic domain (TDGcat) revealed two TDGcat enzymes simultaneously bound to the same DNA molecule (24): one is bound at an AP site, while the other is bound non-specifically, but forms contacts with the specifically bound enzyme. The relative positions of the two enzymes in the Mug crystal are not the same as in the TDGcat crystal; the relative positionings are also mutually exclusive, so that both complexes could not form simultaneously. However, these structures could provide a starting point to test potential modes of protein–protein interactions on DNA.
Downstream processing of abasic lesions
The work presented here clearly demonstrates a differential binding mode for Mug with its abasic product DNA. The cooperative formation of a specific dimeric complex is a new observation within the Udg and Mug superfamily of DNA glycosylases. It is evident that the slow turnover of Mug, which has been reported earlier (5), must arise from this cooperative binding, rather than specific interactions with the widowed guanine, which may well be involved in substrate recognition (3).
It has been widely argued that binding of abasic DNA lesions by DNA glycosylases could help protect what are unstable intermediates in the BER pathway. This may be of particular importance for Mug, since it is established that Mug is active in the stationary phase of the cell cycle (10). Under such growth conditions enzymes normally associated with DNA replication and repair will be less abundant, so that protection of unstable intermediates may be of greater importance. In contrast, Udg is present during exponential cell growth and is known to remove uracil that arises due to misincorporation, it is notable therefore that Udg is not a product inhibited enzyme (26,38).
There has been much interest in the interaction between DNA glycosylases and their downstream AP endonucleases, which could delineate sub-pathways of BER, mediated by communication between enzymes in the BER pathway. It has been suggested that modulation of DNA glycosylase binding could be achieved through transmission of structural changes at the glycosylase-DNA interface induced by binding of the AP endonuclease (14). Cooperative interactions between DNA glycosylases and their abasic products could provide an alternative mechanism by which downstream repair may be coordinated, since disruption of the protein:protein interface will facilitate dissociation from the abasic DNA product.
SUPPLEMENTARY DATA
Supplementary Data are available at NAR Online.
FUNDING
This work was part-funded by the UK Biotechnology and Biological Sciences Research Council (BBSRC BB/E000495/1); studentships to T.R. and H.M. were funded by the UK Engineering and Physical Sciences Research Council. Funding for open access charge: Imperial College London.
Conflict of interest statement. None declared.
ACKNOWLEDGEMENT
G.S.B. would like to thank Jan Silhan for his insightful discussions on this work. T.R. and H.M. gratefully acknowledge studentships funded by the UK Engineering and Physical Sciences Research Council
REFERENCES
- 1.Seeberg E, Eide L, Bjoras M. The base excision repair pathway. Trends Biochem. Sci. 1995;20:391–397. doi: 10.1016/s0968-0004(00)89086-6. [DOI] [PubMed] [Google Scholar]
- 2.Gallinari P, Jiricny J. A new class of uracil-DNA glycosylases related to human thymine-DNA glycosylase. Nature. 1996;383:735–738. doi: 10.1038/383735a0. [DOI] [PubMed] [Google Scholar]
- 3.Barrett TE, Savva R, Panayotou G, Barlow T, Brown T, Jiricny J, Pearl LH. Crystal structure of a G:T/U mismatch-specific DNA glycosylase: mismatch recognition by complementary-strand interactions. Cell. 1998;92:117–129. doi: 10.1016/s0092-8674(00)80904-6. [DOI] [PubMed] [Google Scholar]
- 4.Saparbaev M, Laval J. 3,N(4)-ethenocytosine, a highly mutagenic adduct, is a primary substrate for Escherichia coli double-stranded uracil-DNA glycosylase and human mismatch-specific thymine-DNA glycosylase. Proc. Natl Acad. Sci. USA. 1998;95:8508–8513. doi: 10.1073/pnas.95.15.8508. [DOI] [PMC free article] [PubMed] [Google Scholar]
- 5.O’Neill RJ, Vorob’eva OV, Shahbakhti H, Zmuda E, Bhagwat AS, Baldwin GS. Mismatch uracil glycosylase from Escherichia coli: a general mismatch or a specific DNA glycosylase? J. Biol. Chem. 2003;278:20526–20532. doi: 10.1074/jbc.M210860200. [DOI] [PubMed] [Google Scholar]
- 6.Baker D, Liu P, Burdzy A, Sowers LC. Characterization of the substrate specificity of a human 5-hydroxymethyluracil glycosylase activity. Chem. Res. Toxicol. 2002;15:33–39. doi: 10.1021/tx010113b. [DOI] [PubMed] [Google Scholar]
- 7.Saparbaev M, Langouet S, Privezentzev CV, Guengerich FP, Cai H, Elder RH, Laval J. 1,N(2)-ethenoguanine, a mutagenic DNA adduct, is a primary substrate of Escherichia coli mismatch-specific uracil-DNA glycosylase and human alkylpurine-DNA-N-glycosylase. J. Biol. Chem. 2002;277:26987–26993. doi: 10.1074/jbc.M111100200. [DOI] [PubMed] [Google Scholar]
- 8.Hang B, Downing G, Guliaev AB, Singer B. Novel activity of Escherichia coli mismatch uracil-DNA glycosylase (Mug) excising 8-(hydroxymethyl)-3,N4-ethenocytosine, a potential product resulting from glycidaldehyde reaction. Biochemistry. 2002;41:2158–2165. doi: 10.1021/bi011542b. [DOI] [PubMed] [Google Scholar]
- 9.Guliaev AB, Singer B, Hang B. Chloroethylnitrosourea-derived ethano cytosine and adenine adducts are substrates for Escherichia coli glycosylases excising analogous etheno adducts. DNA Repair. 2004;3:1311–1321. doi: 10.1016/j.dnarep.2004.04.015. [DOI] [PubMed] [Google Scholar]
- 10.Mokkapati SK, Fernandez de Henestrosa AR, Bhagwat AS. Escherichia coli DNA glycosylase Mug: a growth-regulated enzyme required for mutation avoidance in stationary-phase cells. Mol. Microbiol. 2001;41:1101–1111. doi: 10.1046/j.1365-2958.2001.02559.x. [DOI] [PubMed] [Google Scholar]
- 11.Waters TR, Swann PF. Kinetics of the action of thymine DNA glycosylase. J. Biol. Chem. 1998;273:20007–20014. doi: 10.1074/jbc.273.32.20007. [DOI] [PubMed] [Google Scholar]
- 12.Farez-Vidal ME, Gallego C, Ruiz-Perez LM, Gonzalez-Pacanowska D. Characterization of uracil-DNA glycosylase activity from Trypanosoma cruzi and its stimulation by AP endonuclease. Nucleic Acids Res. 2001;29:1549–1555. doi: 10.1093/nar/29.7.1549. [DOI] [PMC free article] [PubMed] [Google Scholar]
- 13.Hill JW, Hazra TK, Izumi T, Mitra S. Stimulation of human 8-oxoguanine-DNA glycosylase by AP-endonuclease: potential coordination of the initial steps in base excision repair. Nucleic Acids Res. 2001;29:430–438. doi: 10.1093/nar/29.2.430. [DOI] [PMC free article] [PubMed] [Google Scholar]
- 14.Parikh SS, Mol CD, Slupphaug G, Bharati S, Krokan HE, Tainer JA. Base excision repair initiation revealed by crystal structures and binding kinetics of human uracil-DNA glycosylase with DNA. EMBO J. 1998;17:5214–5226. doi: 10.1093/emboj/17.17.5214. [DOI] [PMC free article] [PubMed] [Google Scholar]
- 15.Pope MA, Porello SL, David SS. Escherichia coli apurinic-apyrimidinic endonucleases enhance the turnover of the adenine glycosylase MutY with G: A substrates. J. Biol. Chem. 2002;277:22605–22615. doi: 10.1074/jbc.M203037200. [DOI] [PubMed] [Google Scholar]
- 16.Cortazar D, Kunz C, Saito Y, Steinacher R, Schar P. The enigmatic thymine DNA glycosylase. DNA Repair. 2007;6:489–504. doi: 10.1016/j.dnarep.2006.10.013. [DOI] [PubMed] [Google Scholar]
- 17.Zharkov DO, Rosenquist TA, Gerchman SE, Grollman AP. Substrate specificity and reaction mechanism of murine 8- oxoguanine-DNA glycosylase. J. Biol. Chem. 2000;275:28607–28617. doi: 10.1074/jbc.M002441200. [DOI] [PubMed] [Google Scholar]
- 18.Sung JS, Mosbaugh DW. Escherichia coli double-strand uracil-DNA glycosylase: involvement in uracil-mediated DNA base excision repair and stimulation of activity by endonuclease IV. Biochemistry. 2000;39:10224–10235. doi: 10.1021/bi0007066. [DOI] [PubMed] [Google Scholar]
- 19.Vidal AE, Hickson ID, Boiteux S, Radicella JP. Mechanism of stimulation of the DNA glycosylase activity of hOGG1 by the major human AP endonuclease: bypass of the AP lyase activity step. Nucleic Acids Res. 2001;29:1285–1292. doi: 10.1093/nar/29.6.1285. [DOI] [PMC free article] [PubMed] [Google Scholar]
- 20.Waters TR, Gallinari P, Jiricny J, Swann PF. Human thymine DNA glycosylase binds to apurinic sites in DNA but is displaced by human apurinic endonuclease 1. J. Biol. Chem. 1999;274:67–74. doi: 10.1074/jbc.274.1.67. [DOI] [PubMed] [Google Scholar]
- 21.Fitzgerald ME, Drohat AC. Coordinating the initial steps of base excision repair apurinic/apyrimidinic endonuclease 1 actively stimulates thymine DNA glycosylase by disrupting the product complex. J. Biol. Chem. 2008;283:32680–32690. doi: 10.1074/jbc.M805504200. [DOI] [PMC free article] [PubMed] [Google Scholar]
- 22.Fried MG, Kanugula S, Bromberg JL, Pegg AE. DNA binding mechanism of O6-alkylguanine-DNA alkyltransferase: stoichiometry and effects of DNA base composition and secondary structure on complex stability. Biochemistry. 1996;35:15295–15301. doi: 10.1021/bi960971k. [DOI] [PubMed] [Google Scholar]
- 23.Rasimas JJ, Kar SR, Pegg AE, Fried MG. Interactions of human O6-alkylguanine-DNA alkyltransferase (AGT) with short single-stranded DNAs. J. Biol. Chem. 2007;282:3357–3366. doi: 10.1074/jbc.M608876200. [DOI] [PMC free article] [PubMed] [Google Scholar]
- 24.Maiti A, Morgan MT, Pozharski E, Drohat AC. Crystal structure of human thymine DNA glycosylase bound to DNA elucidates sequence-specific mismatch recognition. Proc. Natl Acad. Sci. USA. 2008;105:8890–8895. doi: 10.1073/pnas.0711061105. [DOI] [PMC free article] [PubMed] [Google Scholar]
- 25.Baldwin GS, Vipond IB, Halford SE. Rapid reaction analysis of the catalytic cycle of the EcoRV restriction endonuclease. Biochemistry. 1995;34:705–714. doi: 10.1021/bi00002a038. [DOI] [PubMed] [Google Scholar]
- 26.Bellamy SR, Baldwin GS. A kinetic analysis of substrate recognition by uracil-DNA glycosylase from herpes simplex virus type 1. Nucleic Acids Res. 2001;29:3857–3863. doi: 10.1093/nar/29.18.3857. [DOI] [PMC free article] [PubMed] [Google Scholar]
- 27.Manning HB, Kennedy GT, Owen DM, Grant DM, Magee AI, Neil MA, Itoh Y, Dunsby C, French PM. A compact, multidimensional spectrofluorometer exploiting supercontinuum generation. J. Biophotonics. 2008;1:494–505. doi: 10.1002/jbio.200810051. [DOI] [PubMed] [Google Scholar]
- 28.Crutzen M, Ameloot M, Boens N, Negri RM, Deschryver FC. Global analysis of unmatched polarized fluorescence decay curves. J. Phys. Chem. 1993;97:8133–8145. [Google Scholar]
- 29.Sidorova NY, Muradymov S, Rau DC. Trapping DNA-protein binding reactions with neutral osmolytes for the analysis by gel mobility shift and self-cleavage assays. Nucleic Acids Res. 2005;33:5145–5155. doi: 10.1093/nar/gki808. [DOI] [PMC free article] [PubMed] [Google Scholar]
- 30.Krusong K, Carpenter EP, Bellamy SR, Savva R, Baldwin GS. A comparative study of uracil-DNA glycosylases from human and herpes simplex virus type 1. J. Biol. Chem. 2006;281:4983–4992. doi: 10.1074/jbc.M509137200. [DOI] [PubMed] [Google Scholar]
- 31.Powell LM, Connolly BA, Dryden DTF. The DNA binding characteristics of the trimeric EcoKI methyltransferase and its partially assembled dimeric form determined by fluorescence polarisation and DNA footprinting. J. Mol. Biol. 1998;283:947–961. doi: 10.1006/jmbi.1998.2142. [DOI] [PubMed] [Google Scholar]
- 32.Lakowicz RJ. Principles of Fluorescence Spectroscopy. 2nd edn. New York: Kluwer Academic/Plenum Publishers; 1999. [Google Scholar]
- 33.Cornish-Bowden A. Fundamentals of Enzyme Kinetics. London: Portland Press; 1995. [Google Scholar]
- 34.Barrett TE, Scharer OD, Savva R, Brown T, Jiricny J, Verdine GL, Pearl LH. Crystal structure of a thwarted mismatch glycosylase DNA repair complex. EMBO J. 1999;18:6599–6609. doi: 10.1093/emboj/18.23.6599. [DOI] [PMC free article] [PubMed] [Google Scholar]
- 35.Hardeland U, Bentele M, Jiricny J, Schar P. Separating substrate recognition from base hydrolysis in human thymine DNA glycosylase by mutational analysis. J. Biol. Chem. 2000;275:33449–33456. doi: 10.1074/jbc.M005095200. [DOI] [PubMed] [Google Scholar]
- 36.Pearl LH. Structure and function in the uracil-DNA glycosylase superfamily. Mutat. Res. 2000;460:165–181. doi: 10.1016/s0921-8777(00)00025-2. [DOI] [PubMed] [Google Scholar]
- 37.Wong I, Bernards AS, Miller JK, Wirz JA. A dimeric mechanism for contextual target recognition by MutY glycosylase. J. Biol. Chem. 2003;278:2411–2418. doi: 10.1074/jbc.M209802200. [DOI] [PubMed] [Google Scholar]
- 38.Stivers JT, Pankiewicz KW, Watanabe KA. Kinetic mechanism of damage site recognition and uracil flipping by Escherichia coli uracil DNA glycosylase. Biochemistry. 1999;38:952–963. doi: 10.1021/bi9818669. [DOI] [PubMed] [Google Scholar]
Associated Data
This section collects any data citations, data availability statements, or supplementary materials included in this article.