Abstract
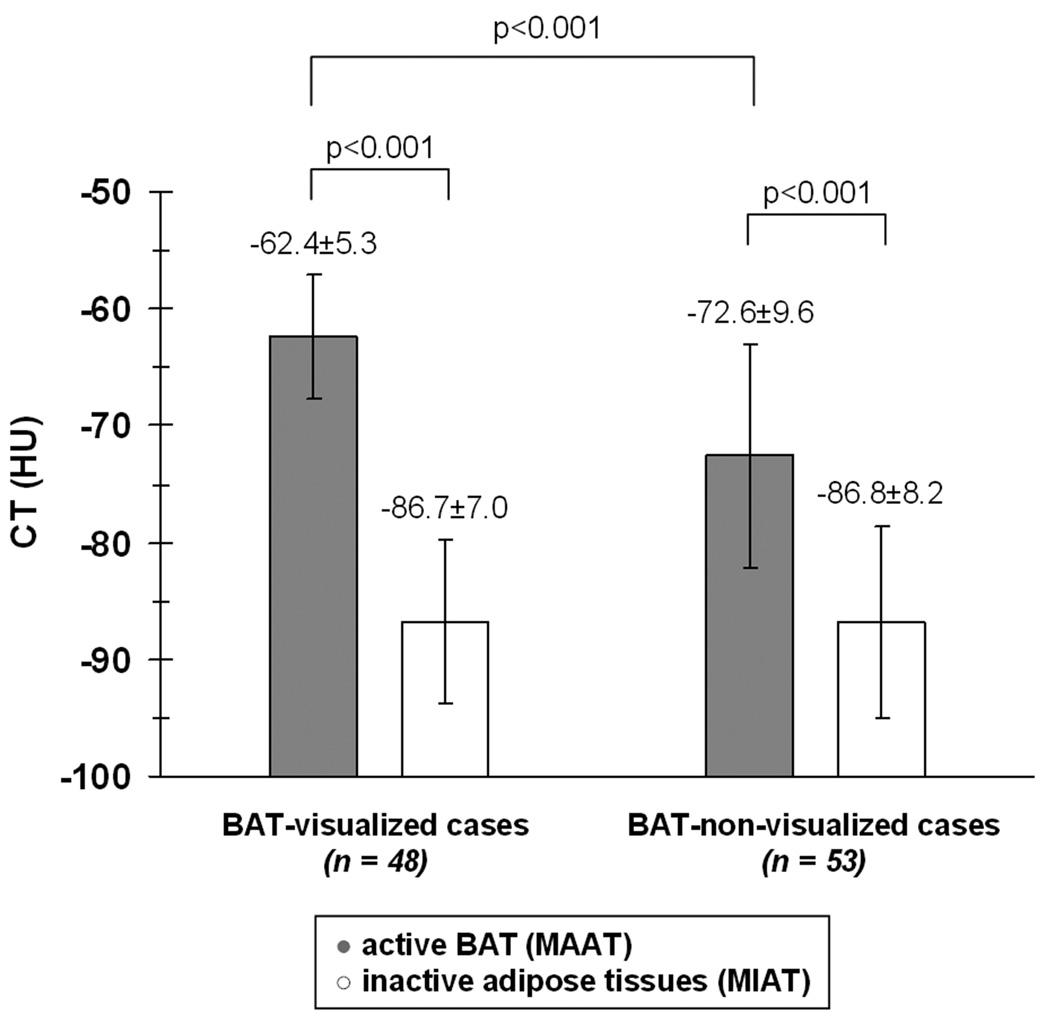
This study investigates differences in CT Hounsfield units (HUs) between metabolically active (brown fat) and inactive adipose tissues (white fat) due to variations in their densities. PET/CT data from 101 pediatric and adolescent patients were analyzed. Regions of metabolically active and inactive adipose tissues were identified and standard uptake values (SUVs) and HUs were measured. HUs of active brown fat were more positive (p<0.001) than inactive fat (−62.4±5.3 versus −86.7±7.0) and the difference was observed in both males and females.
Keywords: Brown adipose tissue, White adipose tissue, PET/CT, Tissue attenuation, Hounsfield units
INTRODUCTION
In conventional radiology, imaging regions with negative Hounsfield Units (HUs) have traditionally been interpreted as fat and no additional stratification of the negative HU scale is further considered. In contrast, all other soft tissues and bone occupy the positive HU range. However, adipose tissue (fat) is composed of both white and brown adipocytes. While white adipose tissue (WAT) is studied in obesity research, brown adipose tissue (BAT) has emerged as a topic of interest in energy balance and metabolism 1–8. Recent reports continue to probe BAT’s physiological function and existence, particularly in humans 9–13. Whereas WAT is a fat reservoir and its cells are composed of large intracellular lipid droplets, BAT in contrast is involved in energy homeostasis and non-shivering-thermogenesis. BAT is highly vascularized, rich in mitochondria, innervated by the sympathetic nervous system, and most importantly, it is metabolically active 6. Brown adipocytes are characterized by multiple smaller intracellular lipid droplets and have lower lipid content than white adipocytes.
Findings of metabolically active adipose tissues (MAAT), presumed to be BAT, with positron emission and computed tomography (PET/CT) in humans have been reported by numerous investigators 14–22. These studies have demonstrated symmetrical foci in the interscauplar and suprclavicular regions that are characterized by both high PET radiotracer uptake and negative “fat-like” CT HUs. Histological analyses have confirmed these foci to be BAT 23. In addition, several studies have also shown WAT to be metabolically inert, as indicated by minimal radiotracer uptake. However, despite these reinvigorating findings, human BAT studies remain limited. First, PET/CT can only be performed in clinically warranted patients and the modality is not broadly applicable to other potential research subjects due to costly radiotracer usage. Second, all imaging studies of BAT to date have been functional-based and confined to the use of an exogenous agent that is selective for the tissue only when it is metabolically active under stimulation 24. Third, PET/CT indications of FDG-avid BAT-foci from the same subject can be highly variable and is influenced by environmental factors and the subject’s state at the time of the examination 25. With PET/CT as the current gold-standard in active BAT studies, the imaging of inactive BAT has not yet been pursued.
While PET Standard Uptake Values (SUVs) have been used to distinguish BAT and WAT based on tracer uptake and tissue activity, the question of whether there is a parallel difference in CT HUs and tissue densities has only recently been explored 26. In this study, we investigate whether stratification of the negative HU scale is feasible in differentiating metabolically active BAT and inert WAT. We retrospectively examined fusion PET/CT data from oncology patients to first identify regions of metabolically active and inactive adipose tissues (MIAT) based on SUVs and negative HUs. With precedence established by previous reports, we assumed in this work that the source of MAAT was only from BAT. Conversely, we made no further distinction and assumed the source of MIAT could be either of un-stimulated BAT or inert WAT, or a mixture of both, as it remains not possible to differentiate these two tissue pools with PET/CT. We hypothesized that MAAT (e.g. BAT), will be characterized by more positive --- but still in the negative range --- HUs and greater tissue density than MIAT, due to its greater intracellular water and lower triglyceride contents.
MATERIALS and METHODS
Study Cohort
The institutional review board and ethics committee approved this retrospective study and waived informed consent. One hundred and one consecutive PET/CT patient cases performed between October 2008 and February 2010 were retrospectively analyzed. Demographics of the pediatric and adolescent cohort are summarized in Table 1. There were no significant differences between males and females in terms of anthropometry. Height was obtained using a digital stadiometer and body-mass-index was calculated as weight (kg) divided by the square of the height (m), in accordance with formulas set forth by the National Institutes of Health. Seventy-five cases were diagnosed with lymphoma (56 Hodgkin’s, 4 Burkitt’s, 5 B-cell, 5 anaplastic large cell, 1 lymphoblastic, 4 unspecified); 12 were diagnosed with neuroblastoma; 4 with Ewing’s sarcoma; 3 with melanoma; and there was one each with thyroid cancer, rhadomyosarcoma, nasopharyngeal carcinoma, hepatocellular carcinoma, hepatoblastoma, cardiac angiosarcoma, and adenosarcoma.
TABLE 1.
Subject characteristics. Data given in mean ± standard deviation with range in parentheses.
| Males (n = 69) | Females (n = 32) | |
|---|---|---|
| Age [years] | 14.9 ± 6.6 (2 – 31) |
13.6 ± 4.6 (4 – 21) |
| Weight [kg] | 51.4 ± 20.6 (13.8 – 92.2) |
46.3 ± 19.6 (12.9 – 95.3) |
| Height [cm] | 154.8 ± 25.2 (91.6 – 189.0) |
148.3 ± 18.7 (93.1 – 172.6) |
| Body-Mass-Index | 20.4 ± 4.3 (13.1 – 29.3) |
20.0 ± 4.5 (13.2 – 32.2) |
PET/CT Imaging
Scans were performed on a Gemini system (Philips Healthcare, GXL 3.3, Cleveland, Ohio). The X-ray tube was operated with a peak voltage of 120 kV, average current of 80 mA (ranging from 60 to 100mA), and a pitch of 0.81. Patients were injected between 2.2 and 12.9 mCuries of 18F-FDG tracer depending on body weight. Since all of the PET/CT exams were clinically warranted, no patients were subjected to cold and warm temperature preparations prior to their scan 17,18. All patients were indoors under temperature controlled conditions (22° Celsius) for at least one hour prior to examination. We also retrospectively gathered the average monthly outside temperature from the local weather station database. All studies were performed following intravenous and oral contrast enhancement as set forth by the PET/CT protocol of our institution’s oncology and imaging departments. Children six years of age or younger underwent sedation via general anesthesia to minimize motion. No additional agents or relaxants were administered. Diet was not controlled prior to examination and blood glucose levels were not measured prior to FDG administration. Total acquisition time for each study was one hour. The axial in-plane spatial resolutions for PET and CT slices were 4 and 1.17 mm, respectively, and the slice thicknesses were 4 and 5 mm, respectively.
Image Analysis
Co-registered and attenuation-corrected PET/CT data were analyzed on a workstation (Philips Extended Brilliance Workspace, V3.5.2.2260) linked to the scanner. We adopted an analysis approach similar to that of Pfannenberg, et al. 22 SUVs were computed by the workstation’s software based on each subject’s total body weight. All images from the base of the skull to the manubrium were reviewed together by two pediatric radiologists with 31 and 15 years of clinical experience, respectively. The two physicians also have a combined experience of more than 25 years in reading CT and PET/CT images. Based on their visual interpretation, the two radiologists first identified cases and regions where metabolically active BAT (e.g. MAAT) was present in the common interscapular, neck, supraclavicular, and para-vertebral areas. All PET/CT studies were reviewed independently by the two radiologists. A patient was considered to have BAT if both radiologists diagnosed its presence. Of the 101 studies, the two radiologists disagreed only on three studies and these discrepant determinations were then reevaluated by the pair together to arrive at a consensus. The positively identified cases will be referred heretofore as BAT-visualized and were determined by assessing both SUVmean and SUVmax metrics within each visualized region of interest (ROI) on the workstation. The radiologists also assured that the underlying CT HUs were negative and indicative of fat-like tissue densities, and that the foci were bilaterally observed in the interscapular, neck, and/or supraclavicular regions. The ROIs were also exclusive of muscles, tissue boundaries, joints, and possible pathology 22. The distributions of HUs and SUVs within these BAT-visualized ROIs were then measured and tabulated.
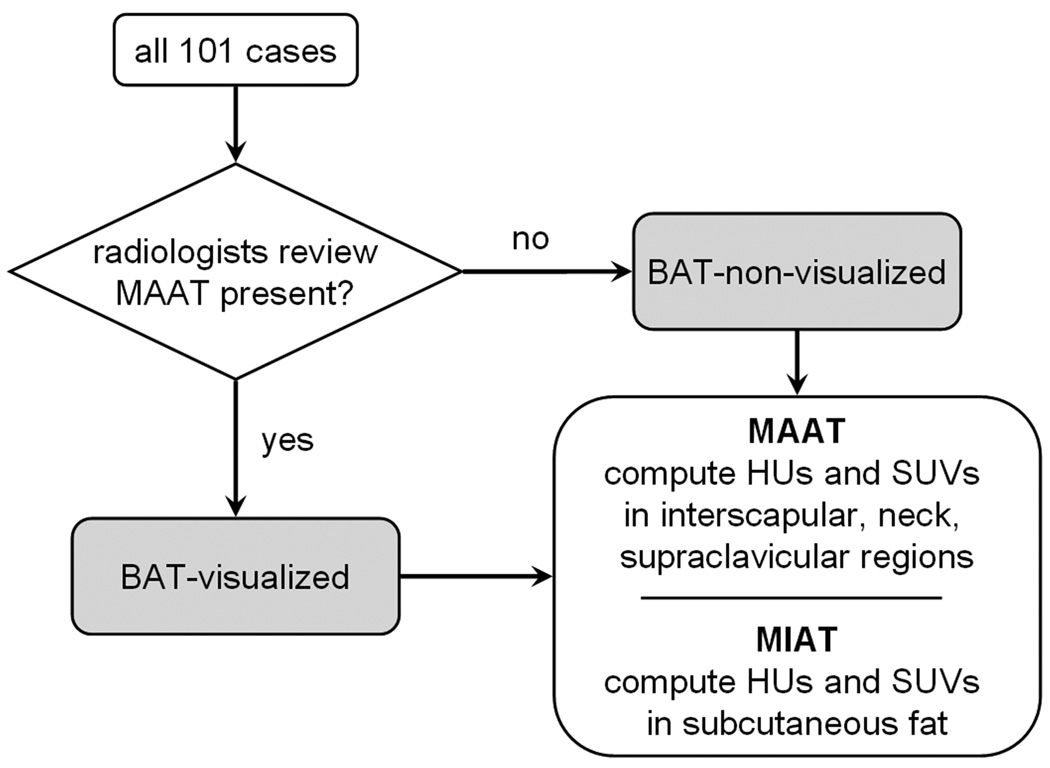
Next, in the remaining cases where BAT was visually absent (e.g. BAT-non-visualized), distributions of HUs and SUVs were also measured in corresponding anatomical areas (ROIs) of interscapular, neck, and supraclavicular fat depots that were similar in location to the previous BAT-visualized cases. No distinctions were made at this pint as to whether these ROIs on the BAT-non-visualized cases contained metabolically active or inactive tissues. The lack of radiologist visual identification does not necessarily imply the absence of active BAT in these cases, but rather that the SUV intensities were not evident or strong enough for visual recognition. Lastly, HUs and SUVs in areas of MIAT, as evidenced by low SUVs (< 1.0 SUV) 22,26 and negative attenuation values and presumed to be subcutaneous WAT, were additionally measured in all cases at the level of the neck, shoulder, and sternum. Throughout this image analysis process, the radiologists utilized schematics of known human BAT depots found in recent literature as an initial guide 7,8. Figure 1 provides a flowchart summary.
Figure 1.
Flowchart of image analysis process. All cases were first reviewed by radiologists to determine the presence or absence of visually evident metabolically active adipose tissue (MAAT). From the BAT-visualized cases, HUs and SUVs of metabolically active bilateral regions at the interscapular, neck, and supraclavicular levels are computed first. Corresponding regions in the BAT-non-visualized cases were then computed next. Finally, distributions in metabolically inactive adipose tissue (MIAT), selected to be subcutaneous fat, were computed from all cases.
Statistical Analysis
Statistical tests were performed using Statview (v5.0.1; SAS Institute Inc., Cary, North Carolina). Unpaired t-tests and Pearson correlation coefficients were used for comparisons and to examine associations between variables, namely HUs and SUVs and anthropometry. All distribution results were expressed as mean and standard deviations. A p-value of less than 0.05 was considered statistically significant.
RESULTS
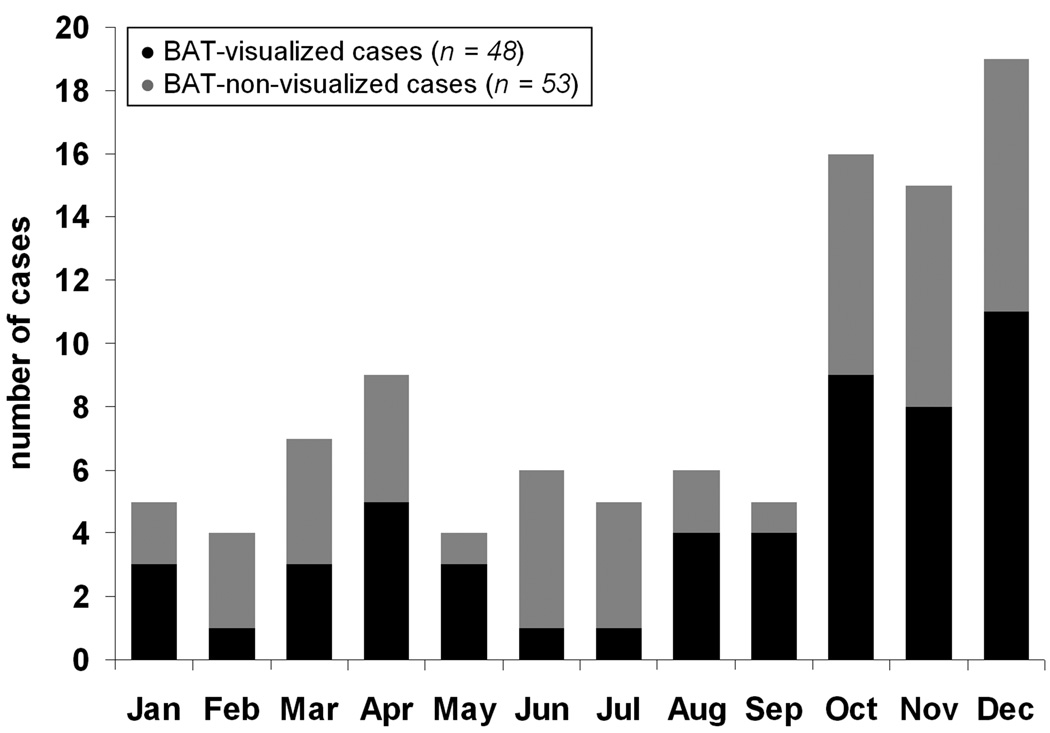
Of the 101 cases, 48 (31 males, 17 females) were identified as BAT-visualized. Thus the incidence of BAT-visualized cases was higher, though not significant (p = 0.74), in females (53%, 17/32) versus males (45%, 31/69). The bilateral interscapular, neck, and supraclavicular BAT depots (e.g. at least six ROIs) were observed and measured in all 48 BAT-visualized cases. Figure 2 plots the total number of PET/CT cases per month and the black portion highlights the BAT-visualized cases. The gray portion represents the 53 BAT-non-visualized cases. Table 2 tabulates the incidence of BAT-visualized cases versus monthly outside temperature. Note that although BAT-visualized cases were observed in all months, there were more occurrences during the cooler months (e.g. November – January) than the warmer months (June, July) 17,21.
Figure 2.
Histogram of the distribution of cases analyzed across the months during which PET/CT examination was performed. Black portions denote the BAT-visualized cases and gray portions represent the BAT-non-visualized cases.
TABLE 2.
Incidence of BAT-visualized cases per month and the average outside temperature.
| % BAT-visualized | Outside Temperature (Celsius) |
|
|---|---|---|
| January | 60% | 21.4 |
| February | 25% | 20.8 |
| March | 43% | 21.1 |
| April | 56% | 28.3 |
| May | 75% | 24.4 |
| June | 17% | 22.2 |
| July | 20% | 26.7 |
| August | 67% | 29.4 |
| September | 80% | 29.4 |
| October | 56% | 28.9 |
| November | 53% | 23.1 |
| December | 58% | 19.2 |
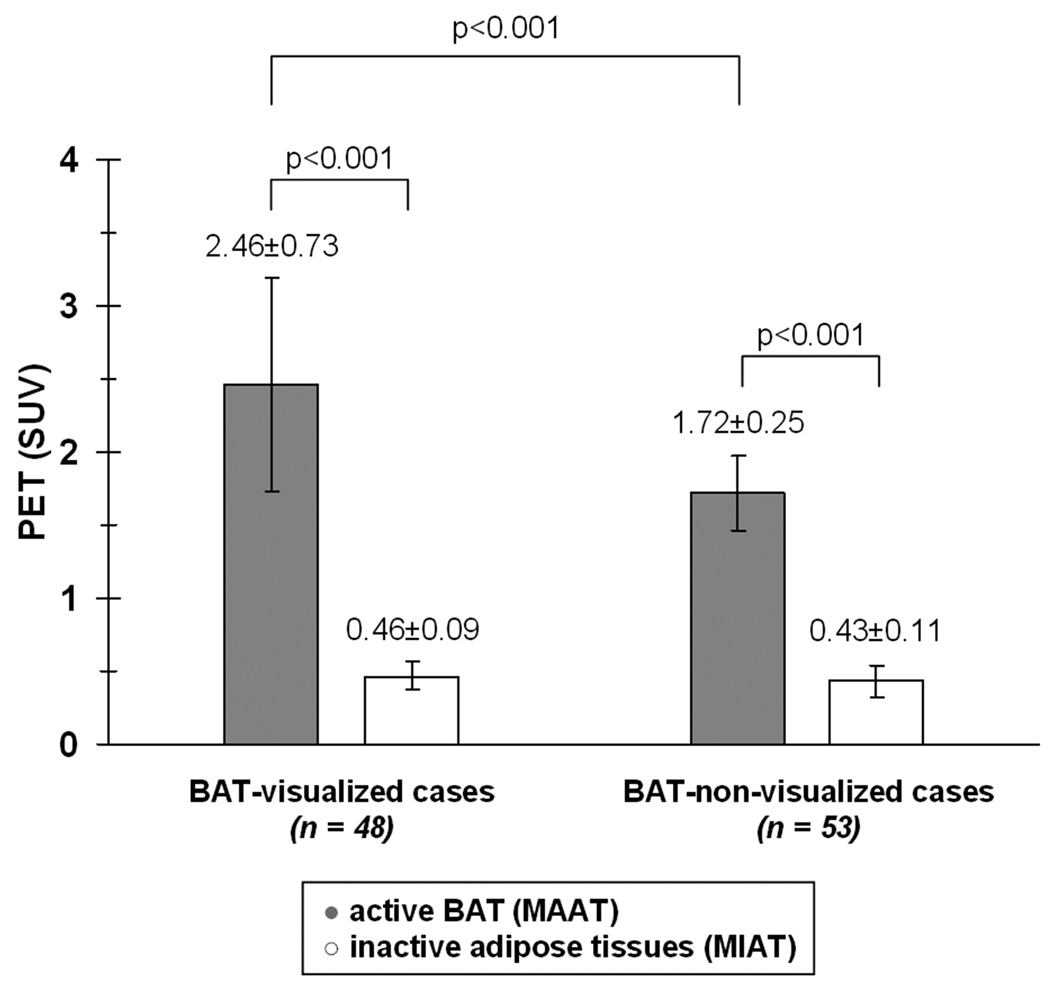
Figure 3 illustrates the differences in SUVs between active and inactive adipose tissues separately for the 48 BAT-visualized and 53 BAT-non-visualized cases. For the BAT-visualized cases, the MAAT SUV range was 1.4 to 4.3. The SUV range was 1.3 to 2.5 for the corresponding interscapular, neck, and supraclavicular ROIs in the BAT-non-visualized cases (gray bars). Based on this measured SUV range and previous cutoffs used in literature 22,26, these ROIs were subsequently labeled as MAAT. The MAAT SUV ranges between BAT-visualized and BAT-non-visualized groups were significantly different (p < 0.001). In contrast, the SUV distribution of MIAT between the BAT-visualized (range: 0.25 to 0.65) and BAT-non-visualized (range: 0.22 to 0.73) groups were not statistically different (p = 0.14, white bars). As anticipated, SUVs of MAAT were four to five-fold significantly greater than that of MIAT (p < 0.001) in both groups.
Figure 3.
Bar plot illustrating the differences in PET SUVs between MAAT and MIAT.
Parallel trends were observed in the HUs (Figure 4). Again in each of the two groups, the HUs of active BAT were significantly more positive than that of MIAT (p < 0.001). Likewise, for the BAT-visualized cases, the MAAT HU range was −53.0 to −73.6, which was also more positive overall (p < 0.001) than the HU range of −55.3 to −90.7 for MAAT in the BAT-non-visualized cases. The HU distributions of MIAT between the two groups (−75.3 to −100.0 versus −72.8 to −106.4) were not statistically different. These observations collectively corroborate our hypothesis.
Figure 4.
Bar plot illustrating the differences in CT HUs between MAAT and MIAT.
The distributions of SUVs and HUs between genders, along with age and body-mass-index, are summarized in Table 3. While differences in SUVs and HUs were observed in both males and females, there were no significant differences in any of the variables between the genders.
TABLE 3.
Distributions of Standard Uptake Value (SUVs) and Hounsefield Units (HUs) between males and females for metabolically active and inactive adipose tissues (MAAT, MIAT) in BAT-visualized and BAT-non-visualized groups. Data given in mean ± standard deviation with range in parentheses.
| Males | Females | |||
|---|---|---|---|---|
| BAT- visualized |
BAT- non-visualized |
BAT- visualized |
BAT- non-visualized |
|
| Age [years] | 18.4 ± 6.7 (8.5 – 30.6) |
11.9 ± 4.9 (2.7 – 24.8) |
13.6 ± 4.1 (5.7 – 18.8) |
13.6 ± 5.2 (4.3 – 20.2) |
| Body-Mass-Index | 20.8 ± 4.0 (15.2 – 29.3) |
20.1 ± 4.6 (13.1 – 29.3) |
21 ± 5.2 (14.1 – 32.2) |
19.1 ± 3.5 (13.1 – 25.2) |
| MAAT PET [SUV] | 2.4 ± 0.8 (1.4 – 4.3) |
1.7 ± 0.2 (1.3 – 2.3) |
2.5 ± 0.6 (1.8 – 3.8) |
1.7 ± 0.3 (1.3 – 2.5) |
| MAAT CT [HU] | −62.8 ± 5.4 (−73.2 – −53.0) |
−72.7 ± 9.8 (−90.7 – −55.3) |
−61.7 ± 5.3 (−73.5 – −56.2) |
−72.3 ± 9.3 (−89.0 – −56.9) |
| MIAT PET [SUV] | 0.48 ± 0.1 (0.25 – 0.65) |
0.45 ± 0.1 (0.22 – 0.73) |
0.43 ± 0.07 (0.32 – 0.56) |
0.41 ± 0.1 (0.23 – 0.59) |
| MIAT CT [HU] | −86.0 ± 7.4 (−100.0 – −75.3) |
−86.1 ± 9.6 (−106.4 – −69.7) |
−88.3 ± 6.1 (−99.4 – −75.9) |
−87.3 ± 5.3 (−96.1 – −80.1) |
MAAT – metabolically active adipose tissue
MIAT – metabolically inactive adipose tissue
CT – computed tomography
PET – positron emission tomography
SUV – Standard Uptake Valuet
HU – Hounsefield Unit
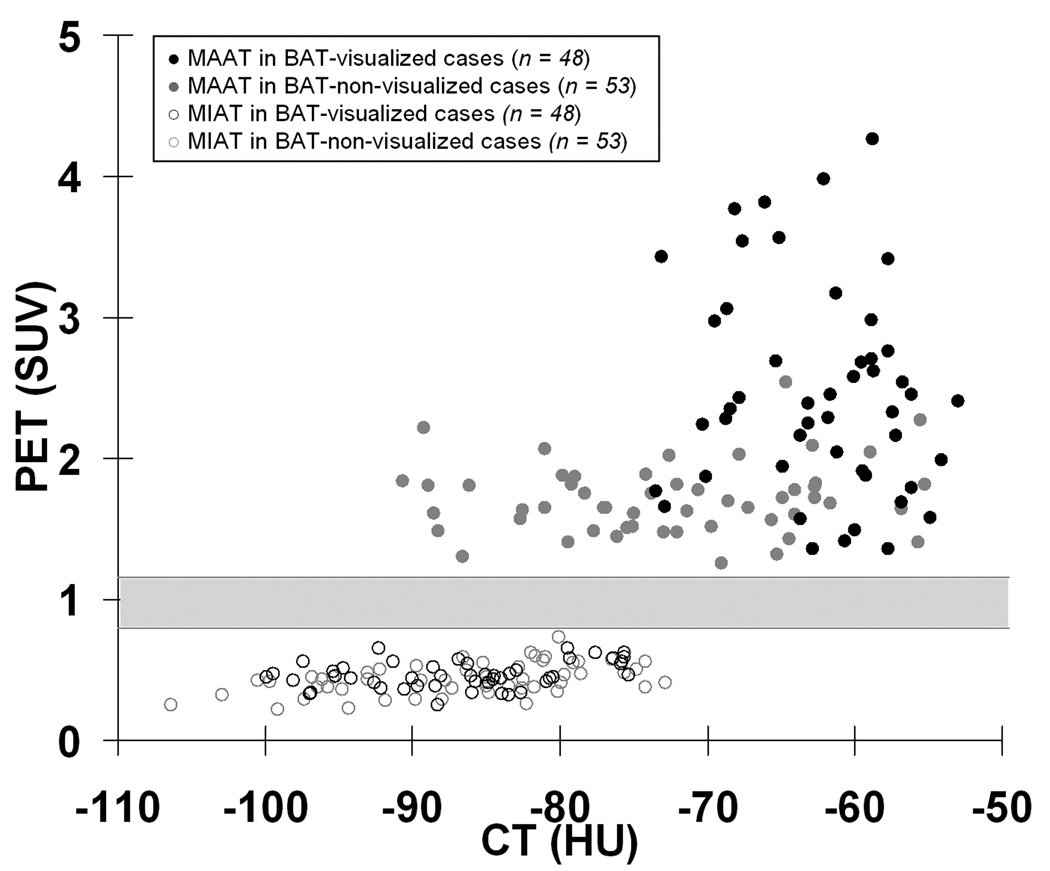
Figure 5 shows a scatter plot of the HUs and SUVs. Several key observations are evident and supportive of our hypothesis. First, SUVs for MAAT (solid circles) are significantly higher than those of MIAT (open circles) in all cases. Second, there is no overlap between the SUVs of MAAT and MIAT (gray region). Third, HUs of highly metabolically active BAT from the 48 BAT-visualized cases (black circles) are significantly more positive than all MIAT data points (open circles), with very little overlap along the HU scale. Lastly, though statistically significant, there remain HU overlaps between slight to moderately active BAT from the 53 BAT-non-visualized cases and all MIAT data points. There was a significant correlation (r = 0.29, p < 0.01) between HUs and SUVs for MAAT when all 101 cases were considered. However, the correlation was not significant when the BAT-visualized and BAT-non-visualized cases were considered separately.
Figure 5.
Scatter plot of HUs and SUVs for MAAT (solid circles) and MIAT (open circles). The gray region denotes a range of SUVs (0.8 to 1.2) where no data points reside.
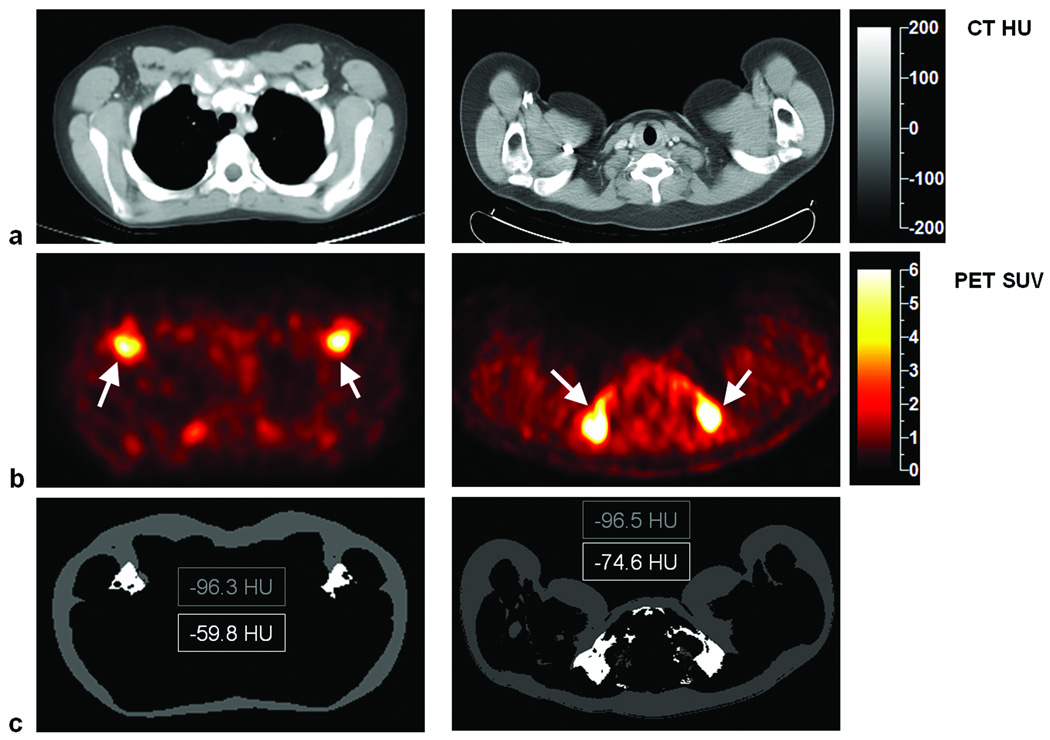
Figure 6 contains image examples from a 12-year-old male (left column) and a 19-year-old male (right column), both of whom were diagnosed with Hodgkin’s lymphoma. Slices from CT and PET are shown in the first and second rows, respectively. There is evident bilateral uptake of tracer in the PET images from both subjects, which correspond to areas of negative HU voxels and fat-like tissue densities on the associated CT images. The third row illustrates segmented MIAT (mostly subcutaneous WAT) and interscapular MAAT (active BAT) and the evident differences in average HUs within each of these regions.
Figure 6.
Co-registered (a) CT and (b) PET images from two subjects. Arrows point to symmetrical uptake of radiotracers by BAT in foci with high SUVs, which correspond to negative HU voxels in the associated CT images. The third row illustrates segmented MIAT (mostly subcutaneous WAT) and interscapular BAT, with a difference of more than 20 HUs in both subjects. Note that the BAT foci are located bilaterally and ventrally.
DISCUSSION
In radiology, CT regions with negative HUs have historically been considered as fat. Past investigators have used SUVs from PET to differentiate metabolically active and inactive adipose tissues. In a recent study, the range of −250 to −50 HU was used to classify all fat voxels with no further categorization 22. This study, along with others 26, have provided evidence of a parallel difference in HUs between metabolically active BAT and inactive fat. The results suggest that highly active BAT is characterized by more positive HUs, and hence greater tissue densities, than MIAT. As supported by Figure 5, the range of MAAT HUs in the 48 BAT-visualized cases overlapped minimally with MIAT HUs and the two distributions were separated by more than three standard deviations. Similarly along the vertical axis, there was no overlap between in SUVs between the two tissue groups. Thus, adipose tissues with significantly more positive HUs than typical subcutaneous WAT, may alone be a possible morphological imaging signature of metabolically active BAT, independent of additional functional PET markers. This is the key finding and contribution of the present work.
This study has indicated that BAT is quite common in children and adolescents, regardless of the time of the PET/CT exam or season 17,21. Newborns and young children are known to have greater amounts of BAT than adult humans 10 and several recent studies have corroborated this observation trend 18,20,22. Whereas only a small proportion of adults undergoing PET/CT have been found to display metabolically active BAT in past literature reports 15–21, the radiologists in this study visualized BAT in nearly half (48/101) of the cases, with a greater incidence in females than males 22. We believe the findings in HU differences between MAAT and MIAT in this study can also be observed and translated in an older adult cohort 26.
Several reasons could explain the greater X-ray attenuation property of MAAT, which we presumed to be BAT. BAT has unique cytological characteristics comprised of multiple lipid droplets surrounded by significant amounts of intracellular water. Brown adipocytes are also densely packed with mitochondria and are heavily vascularized and innervated. The greater proportion of non-lipid components in metabolically active BAT versus any other inactive adipose tissues (e.g. WAT) is the cause for its more positive HUs and greater tissue density.
Furthermore, BAT metabolizes fat and dissipates the released energy as heat rather than channeling the energy through the classical adenotriphosphate (ATP) production pathway. Thus as the tissue becomes more active, its intracellular fat stores are expected to decrease due to expenditure, consequently leading to higher HUs. This notion was supported by positive trends observed between HUs and SUVs in Figure 5, with higher tissue densities reflecting a greater degree of metabolic activity. It is also supported by our finding that the mean HU for MAAT in the 48 BAT-visualized cases was 10 units greater than those from the 53 BAT-non-visualized cases. The current study bears some resemblance to the report by Baba, et al. 26 which showed HUs of metabolically active BAT to be significantly more positive than WAT in mice and adults. Histology data from that report also indicated that a decrease in lipid density in BAT was responsible for the increased HUs of the tissue.
From Figure 5, we retrospectively noted that no resultant PET data points for any adipose tissues were located between 0.8 and 1.2 SUV. This suggests that a SUV cutoff within this range may be useful for stratifying metabolic activity. In a recent report by Baba, et al., the mean SUV of WAT was reported to be 0.9±0.5 26. In another report by Pfannenberg, et al., the authors used a relatively high SUVmax threshold of 2.0 to categorize metabolically active BAT 22. This 2.0 threshold seems in agreement with our findings in Figure 4, where the MAAT in BAT-visualized cases had a mean SUV of 2.46 while those from the BAT-non-visualized cases had a mean SUV of 1.72. Thus, the 2.0 cutoff also appears to reasonably reflect a visual threshold for radiologist interpretation. We believe the MAAT in our BAT-non-visualized cases were not visually evident to the radiologists due to their lower SUVs and hence darker appearance on the PET workstation images.
We observed no statistically significant differences in HUs and SUVs across genders (Table 3). However, we did find positive correlations between HUs of metabolically active BAT versus anthropometry when considering all 101 cases. The trend suggested that with adolescent growth and age, the cytology of BAT evolved to become leaner and denser (more positive HUs), with a progressive decrease in intracellular lipid content. This observation is in agreement with recent studies 22 and supports the notion that BAT is involved in muscle development 27–29.
We recognize several limitations in this work. First, it involved oncology patients and it is unknown whether our findings can be extrapolated to healthy populations 30. Second, the results can vary based on equipment and technique used in PET/CT scanning and image reconstruction. However, any bias would likely apply to both adipose tissues equally. Additional validations that incorporate phantoms will be useful to account for measurements drifts, particularly HUs. Third, all patients received contrast enhancement as part of routine clinical PET/CT protocol. This may have been a confounder in the resulting HU measurements of this retrospective study. A prospective cross-sectional comparison consisting of a control patient group that does not receive contrast is further needed to rule out its effects. A recent study in adolescents and adults has reported similar HU findings without the use of contrast agents 26. Fourth, the sensitivity and specificity of CT for identifying metabolically active BAT need additional corroboration. We were not able to perform histology and pathology in our study cohort for validation due to the retrospective nature of the work. Lastly, our retrospective study cohort had more males than females, which may have affected gender-based comparison results.
It currently remains not possible to identify metabolically inactive BAT alone with fusion PET/CT. In the current study, aside from logical anatomical locations, we were also not able to differentiate between inactive BAT and inert WAT based on HUs alone as both were presumed to be possible sources of MIAT. Furthermore, as shown in Figure 5, only the data distributions of highly MAAT from the 48 BAT-visualized cases (black circles) were uniquely separated from the MIAT data points (open circles) along both HUs and SUVs axes. This is the key finding of our study. Though statistically different, there remained significant data overlaps between the HUs of MAAT in the 53 BAT-non-visualized cases (gray circles) versus the MIAT data points (open circles). Likewise, there’s also overlap between the HUs and SUVs of MAAT from the visualized and non-visualized cases (black circles versus gray circles). Thus, the identity of adipose tissues with slight to moderate metabolic activity levels remains ambiguous in terms of BAT or WAT if interpretation was based on HUs alone.
Recent work has shown that inactive BAT has similar HUs to white fat 26. This supports the notion that if unused, metabolically inactive BAT will accumulate its intracellular lipid stores, thereby becoming more WAT-like (more negative HUs). Past literature has also shown that brown adipocytes can contain varying sizes of lipid droplets, depending on the tissue’s level of stimulation and activity state amongst subjects 31,32. Furthermore, recent findings have also suggested that certain BAT cells can differentiate from WAT progenitors and exhibit an intermediate phenotype that satisfies both classical definitions of BAT and WAT 33–35. In contrast, the cytology of white adipocytes has been more consistent across subjects and studies. It thus remains plausible that the range of HUs occupied inactive BAT extends broadly across the negative HU range, partly overlapping both WAT and active BAT HU values (Figures 4 and 5). The capability of CT to differentiate active and inactive BAT will thus require further exploration, perhaps with the use of a standardized calibration phantom. Lastly, due to the size of PET/CT voxels in comparison to the size of BAT depots, volume averaging can be expected and should be considered since brown and white adipocytes are likely clustered together in vivo 31,32.
In conclusion, this work has suggested that there exist detectable differences between the HUs of highly metabolically active BAT and MIAT, particularly subcutaneous WAT. Study results promote the possibility that CT, or even more sensitive and novel magnetic resonance imaging approaches 36,37, can identify highly metabolically active BAT morphologically, without requiring a concomitant exogenous functional biomarker. The ability of HUs to locate metabolically active BAT alone should facilitate studies in broader populations in the future.
Acknowledgements
The authors (HH Hu and KS Nayak) acknowledge the National Institutes of Health for research grant support (R21DK081173, K25DK087931). The first author thanks Dr. Daniel L. Smith, Jr. from the University of Alabama at Birmingham for helpful discussions. All authors thank Ms. Ashley O. Mo and Ms. Audrey S. Kohar for research assistance.
Footnotes
Publisher's Disclaimer: This is a PDF file of an unedited manuscript that has been accepted for publication. As a service to our customers we are providing this early version of the manuscript. The manuscript will undergo copyediting, typesetting, and review of the resulting proof before it is published in its final citable form. Please note that during the production process errors may be discovered which could affect the content, and all legal disclaimers that apply to the journal pertain.
REFERENCES
- 1.Trayhurn P, Jones PM, McGuckin MM, Goodbody AE. Effects of overfeeding on energy balance and brown fat thermogenesis in obese (ob/ob) mice. Nature. 1982;295:323–325. doi: 10.1038/295323a0. [DOI] [PubMed] [Google Scholar]
- 2.Himms-Hagen J. Brown adipose tissue metabolism and thermogenesis. Annu Rev Nutr. 1985;5:69–94. doi: 10.1146/annurev.nu.05.070185.000441. [DOI] [PubMed] [Google Scholar]
- 3.Himms-Hagen J. Brown adipose tissue thermogenesis and obesity. Prog Lipid Res. 1989;28:67–115. doi: 10.1016/0163-7827(89)90009-x. [DOI] [PubMed] [Google Scholar]
- 4.Himms-Hagen J. Does thermoregulatory feeding occur in newborn infants? A novel view of the role of brown adipose tissue thermogenesis in control of food intake. Obes Res. 1995;3:361–369. doi: 10.1002/j.1550-8528.1995.tb00162.x. [DOI] [PubMed] [Google Scholar]
- 5.Klaus S. Adipose tissue as a regulator of energy balance. Curr Drug Targets. 2004;5:241–250. doi: 10.2174/1389450043490523. [DOI] [PubMed] [Google Scholar]
- 6.Cinti S. The role of brown adipose tissue in human obesity. Nutr Metab Cardiovasc Dis. 2006;16:569–574. doi: 10.1016/j.numecd.2006.07.009. [DOI] [PubMed] [Google Scholar]
- 7.Nedergaard J, Bengtsson T, Cannon B. Unexpected evidence for active brown adipose tissue in adult humans. Am J Physiol Endocrinol Metab. 2007;293:E444–E452. doi: 10.1152/ajpendo.00691.2006. [DOI] [PubMed] [Google Scholar]
- 8.Cannon B, Nedergaard J. Brown adipose tissue: function and physiological significance. Physiol Rev. 2004;84:277–359. doi: 10.1152/physrev.00015.2003. [DOI] [PubMed] [Google Scholar]
- 9.Lee P, Ho KK, Fulham MJ. The importance of brown adipose tissue. N Engl J Med. 2009;361:418. author reply 419–420. [PubMed] [Google Scholar]
- 10.Enerback S. Human brown adipose tissue. Cell Metab. 2010;11:248–252. doi: 10.1016/j.cmet.2010.03.008. [DOI] [PubMed] [Google Scholar]
- 11.Kozak LP. Brown fat and the myth of diet-induced thermogenesis. Cell Metab. 2010;11:263–267. doi: 10.1016/j.cmet.2010.03.009. [DOI] [PMC free article] [PubMed] [Google Scholar]
- 12.Nedergaard J, Cannon B. The changed metabolic world with human brown adipose tissue: therapeutic visions. Cell Metab. 2010;11:268–272. doi: 10.1016/j.cmet.2010.03.007. [DOI] [PubMed] [Google Scholar]
- 13.Lidell ME, Enerback S. Brown adipose tissue--a new role in humans? Nat Rev Endocrinol. 2010;6:319–325. doi: 10.1038/nrendo.2010.64. [DOI] [PubMed] [Google Scholar]
- 14.Hany TF, Gharehpapagh E, Kamel EM, Buck A, Himms-Hagen J, von Schulthess GK. Brown adipose tissue: a factor to consider in symmetrical tracer uptake in the neck and upper chest region. Eur J Nucl Med Mol Imaging. 2002;29:1393–1398. doi: 10.1007/s00259-002-0902-6. [DOI] [PubMed] [Google Scholar]
- 15.Cohade C, Osman M, Pannu HK, Wahl RL. Uptake in supraclavicular area fat ("USA-Fat"): description on 18F-FDG PET/CT. J Nucl Med. 2003;44:170–176. [PubMed] [Google Scholar]
- 16.Yeung HW, Grewal RK, Gonen M, Schoder H, Larson SM. Patterns of (18)F-FDG uptake in adipose tissue and muscle: a potential source of false-positives for PET. J Nucl Med. 2003;44:1789–1796. [PubMed] [Google Scholar]
- 17.Saito M, Okamatsu-Ogura Y, Matsushita M, et al. High incidence of metabolically active brown adipose tissue in healthy adult humans: effects of cold exposure and adiposity. Diabetes. 2009;58:1526–1531. doi: 10.2337/db09-0530. [DOI] [PMC free article] [PubMed] [Google Scholar]
- 18.van Marken Lichtenbelt WD, Vanhommerig JW, Smulders NM, et al. Cold-activated brown adipose tissue in healthy men. N Engl J Med. 2009;360:1500–1508. doi: 10.1056/NEJMoa0808718. [DOI] [PubMed] [Google Scholar]
- 19.Virtanen KA, Lidell ME, Orava J, et al. Functional brown adipose tissue in healthy adults. N Engl J Med. 2009;360:1518–1525. doi: 10.1056/NEJMoa0808949. [DOI] [PubMed] [Google Scholar]
- 20.Cypess AM, Lehman S, Williams G, et al. Identification and importance of brown adipose tissue in adult humans. N Engl J Med. 2009;360:1509–1517. doi: 10.1056/NEJMoa0810780. [DOI] [PMC free article] [PubMed] [Google Scholar]
- 21.Au-Yong IT, Thorn N, Ganatra R, Perkins AC, Symonds ME. Brown adipose tissue and seasonal variation in humans. Diabetes. 2009;58:2583–2587. doi: 10.2337/db09-0833. [DOI] [PMC free article] [PubMed] [Google Scholar]
- 22.Pfannenberg C, Werner MK, Ripkens S, et al. Impact of age on the relationships of brown adipose tissue with sex and adiposity in humans. Diabetes. 2010;59:1789–1793. doi: 10.2337/db10-0004. [DOI] [PMC free article] [PubMed] [Google Scholar]
- 23.Zingaretti MC, Crosta F, Vitali A, et al. The presence of UCP1 demonstrates that metabolically active adipose tissue in the neck of adult humans truly represents brown adipose tissue. Faseb J. 2009;23:3113–3120. doi: 10.1096/fj.09-133546. [DOI] [PubMed] [Google Scholar]
- 24.Astrup A, Bulow J, Madsen J, Christensen NJ. Contribution of BAT and skeletal muscle to thermogenesis induced by ephedrine in man. Am J Physiol. 1985;248:E507–E515. doi: 10.1152/ajpendo.1985.248.5.E507. [DOI] [PubMed] [Google Scholar]
- 25.Lee P, Greenfield JR, Ho KK, Fulham MJ. A critical appraisal of prevalence and metabolic significance of brown adipose tissue in adult humans. Am J Physiol Endocrinol Metab. 2010 doi: 10.1152/ajpendo.00298.2010. doi:10.1152/ajpendo.00298.2010 (advanced e-publication) [DOI] [PubMed] [Google Scholar]
- 26.Baba S, Jacene HA, Engles JM, Honda H, Wahl RL. CT Hounsefield units of brown adipose tissue increase with activation: preclinical and clinical studies. J Nucl Med. 2010;51:246–250. doi: 10.2967/jnumed.109.068775. [DOI] [PubMed] [Google Scholar]
- 27.Crisan M, Casteilla L, Lehr L, et al. A reservoir of brown adipocyte progenitors in human skeletal muscle. Stem Cells. 2008;26:2425–2433. doi: 10.1634/stemcells.2008-0325. [DOI] [PubMed] [Google Scholar]
- 28.Seale P, Bjork B, Yang W, et al. PRDM16 controls a brown fat/skeletal muscle switch. Nature. 2008;454:961–967. doi: 10.1038/nature07182. [DOI] [PMC free article] [PubMed] [Google Scholar]
- 29.Farmer SR. Brown fat and skeletal muscle: unlikely cousins? Cell. 2008;134:726–727. doi: 10.1016/j.cell.2008.08.018. [DOI] [PubMed] [Google Scholar]
- 30.Shammas A, Lim R, Charron M. Pediatric FDG PET/CT: physiologic uptake, normal variants, and benign conditions. Radiographics. 2009;29:1467–1486. doi: 10.1148/rg.295085247. [DOI] [PubMed] [Google Scholar]
- 31.Heaton JM. The distribution of brown adipose tissue in the human. J Anat. 1972;112:35–39. [PMC free article] [PubMed] [Google Scholar]
- 32.Tanuma Y, Tamamoto M, Ito T, Yokochi C. The occurrence of brown adipose tissue in perirenal fat in Japanese. Arch Histol Jpn. 1975;38:43–70. doi: 10.1679/aohc1950.38.43. [DOI] [PubMed] [Google Scholar]
- 33.Petrovic N, Shabalina IG, Timmons JA, Cannon B, Nedergaard J. Thermogenically competent nonadrenergic recruitment in brown preadipocytes by a PPARgamma agonist. Am J Physiol Endocrinol Metab. 2008;295:E287–E296. doi: 10.1152/ajpendo.00035.2008. [DOI] [PubMed] [Google Scholar]
- 34.Petrovic N, Walden TB, Shabalina IG, Timmons JA, Cannon B, Nedergaard J. Chronic peroxisome proliferator-activated receptor gamma (PPARgamma) activation of epididymally derived white adipocyte cultures reveals a population of thermogenically competent, UCP1-containing adipocytes molecularly distinct from classic brown adipocytes. J Biol Chem. 2010;285:7153–7164. doi: 10.1074/jbc.M109.053942. [DOI] [PMC free article] [PubMed] [Google Scholar]
- 35.Barbatelli G, Murano I, Madsen L, et al. The emergence of cold-induced brown adipocytes in mouse white fat depots is determined predominantly by white to brown adipocyte transdifferentiation. Am J Physiol Endocrinol Metab. 2000;298:E1244–E1253. doi: 10.1152/ajpendo.00600.2009. [DOI] [PubMed] [Google Scholar]
- 36.Hu HH, Smith DL, Jr, Nayak KS, Goran MI, Nagy TR. Identification of brown adipose tissue in mice with fat-water IDEAL-MRI. J Magn Reson Imaging. 2010;31:1195–1202. doi: 10.1002/jmri.22162. [DOI] [PMC free article] [PubMed] [Google Scholar]
- 37.Branca RT, Warren WS. In vivoidentification of a molecular marker for brown dipose tissue in NMR spectra of large volumes. Proceedings of the International Society for Magnetic Resonance in Medicine. 2010:748. [Google Scholar]


