Abstract
Laser induced temperature jump relaxation spectroscopy was used to probe the effect of osmolytes on the microscopic rate constants of the LDH-catalyzed reaction. NADH fluorescence and absorption relaxation kinetics were measured for the LDH reaction system in presence of varying amounts of trimethylamine-N-oxide (TMAO), a protein stabilizing osmolyte, or urea, a protein destabilizing osmolyte. TMAO in 1 M concentration strongly increases the rate of hydride transfer, nearly nullifies its activation energy, and also slightly increases the enthalpy of hydride transfer. In 1 M urea the hydride transfer enthalpy is almost nullified, but activation energy of the step is not affected significantly. TMAO increases preference of closed conformation of the active site loop in LDH•NAD+•lactate complex; urea decreases it. The loop-opening rate in LDH•NADH•pyruvate complex changes its temperature dependence to inverse-Arrhenius with TMAO. In this complex, urea speeds up the loop motion, without changing the loop opening enthalpy. A strong, non-Arrhenius drop in pyruvate binding rate in presence of TMAO offers a decrease in the fraction of the open-loop, pyruvate-binding competent form at higher temperatures. Pyruvate off-rate is not affected by urea, but decreases with TMAO. Thus, the osmolytes strongly affect the rates and thermodynamics of specific events along the LDH-catalyzed reaction: binding of substrates, loop closure, and the chemical event. Qualitatively, these results can be understood as an osmolyte-induced change in the energy landscape of the protein complexes, shifting the conformational nature of functional sub-states within the protein ensemble.
Some osmolytes, such as trimethylamine-N-oxide (TMAO), are known to protect proteins against harsh environments (1, 2). In particular, TMAO counteracts the destabilizing effect of urea on protein structure (3–5). Addition of TMAO to a protein solution usually results in increased protein stability against denaturation (6, 7), and higher rigidity of the protein backbone (8, 9). Mechanistically, TMAO compacts a protein globule, while urea does the opposite (8, 10, 11).
TMAO and urea affect enzymatic activity: urea has been reported to increase Km and decrease kcat values for many enzymes, while TMAO produced the opposite effect (see (1, 10, 12, 13) and references therein). However, these parameters are composed of multiple rate constants, and it is difficult to determine what elementary events are being affected by the osmolytes and how. Hence, our knowledge about dynamic aspects of enzyme function in the presence of osmolytes is quite limited. Previously, we studied the influence of osmolytes on binding of substrate mimics to triosephosphate isomerase (14) and lactate dehydrogenase (15), to learn how TMAO and urea affected the elementary rate constants along the binding pathway. Here we report on the effects of these two osmolytes on the rate constants for a full, functional enzyme reaction system, the lactate dehydrogenase (LDH) system. The goals were to obtain specific information about the details and mechanism of TMAO and urea action on the enzyme functional dynamics and a better understanding of the dynamical nature of LDH-catalyzed reaction.
Pig heart L-lactate dehydrogenase, EC 1.1.1.27, (LDH) catalyzes oxidation of lactate by NAD+ to produce pyruvate and NADH. The binding of the two substrates is ordered. The substrate binding pocket lies deep within the protein, buried about 10 Å from the protein's surface. The reaction proceeds in several sequential steps. From the lactate side of the reaction, NAD+ cofactor binding is followed by lactate substrate binding. The rate limiting step in the turnover of LDH is not the chemical hydride transfer step but rather loop motion involving closure of the so-called 'mobile loop' (surface residues 98–110), occurring in a time of ca. 1–10 ms. After that, structural and chemical rearrangements proceed, including in particular a direct stereo specific transfer of a hydride ion from the C2 atom of lactate to C4 atom of NAD+, and proton transfer from the lactate hydroxyl to N3 nitrogen of His-195 (16–18). This is followed by pyruvate release, and final NADH dissociation. A determination of the rate constants associated with these reaction steps (15, 19–22) and the whole reaction system (23) were investigated in our previous studies using laser-induced temperature-jump spectroscopy with nanosecond time resolution. In this study, we continue this series of work, investigating the effect of TMAO and urea on the individual steps of the LDH-catalyzed reaction: hydride transfer, active site mobile loop dynamics, and pyruvate binding/unbinding.
MATERIALS AND METHODS
Laser-induced T-Jump
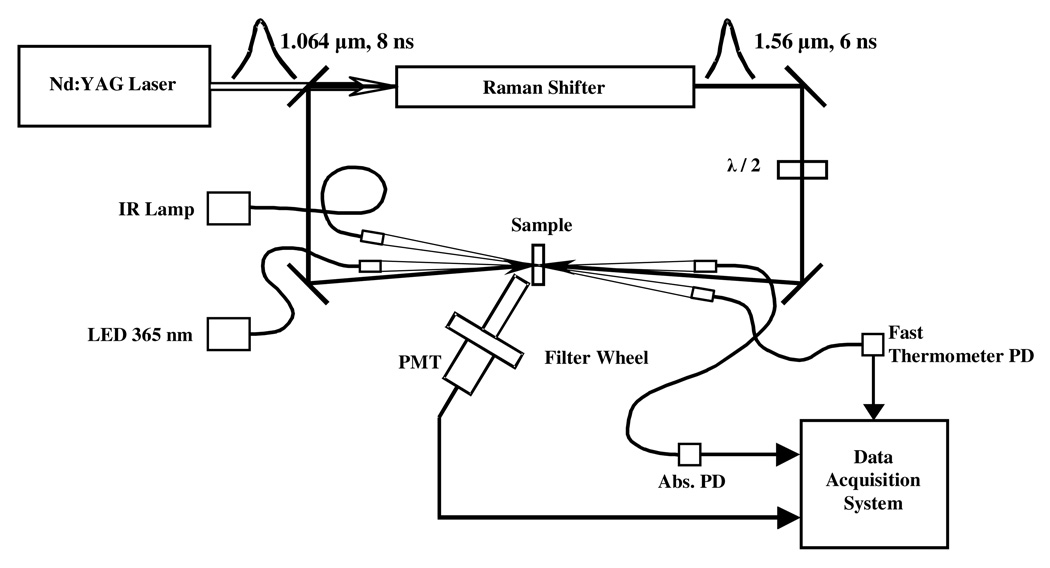
Laser-induced temperature-jump relaxation spectroscopy (system schematic shown in Fig. 1) is employed in the present studies. Sample temperature is rapidly increased with an intense laser pulse absorbed by water-based buffer. Following this nanosecond change in the sample temperature, the system relaxes to a new equilibrium. The relaxation kinetics are followed here by the resulting changes in optical absorption and/or fluorescence emission. To produce the IR pulse necessary for heating, the fundamental (1064 nm) of YG981C10 Q-switched Nd:YAG laser (Quantel USA, Bozeman, MT) is Raman-shifted to 1561 nm wavelength, to a weak absorption band of water. The lab-made Raman shifter cell, of 1 m pathlength, is filled with deuterium gas at 650 psi. Both forward and back-scattered beams from the Raman shifter are directed towards the sample from two sides to obtain a more uniform longitudinal heating pattern. Polarization of one of these beams is rotated by 90 degrees to avoid standing wave and Bragg grating formation inside the sample. The sample temperature after the jump is monitored over time by probing changes in water IR absorption at 1460 nm. The sample was heated in the irradiated spot of 1.5 mm diameter by 5–10 K.
Figure 1.
Laser-induced temperature-jump spectrometer. Collimators in the absorption and fast thermometer channels are coupled to the light sources and photodiodes (PD) by optical fibers. Both output beams from the Raman shifter are directed to the sample from the opposite sides. Polarization of one beam is 90° rotated to avoid a standing wave and Bragg grating formation in the sample.
The excitation light, with 2 mW incident power in a 10 nm FWHM band centered at 365 nm wavelength, is produced by the Black-LED-365 light source (Prizmatix USA, Southfield, MI), collimated and sharply (~0.7 mm diameter) focused in the center of the heated spot of the sample. The transmitted light is directed to a Silicon PIN photodiode (Thorlabs, Newton, NJ) that measures the absorption kinetics. The fluorescence emission is collected at about a 50 degrees angle with a three-lens telescope with a narrow band interference filter in the parallel part of the beam, and detected by a R4220P photomultiplier tube (Hamamatsu, Bridgewater, NJ). NADH fluorescence is selected by a 458 nm narrow-band filter (bandwidth of 40 nm FWHM; Andover, Salem, NH). The signals from the photomultiplier tube and the absorption channel photodiode, amplified with lab-made transimpedance preamplifiers with 3 ns response time, are digitized by a PCI-5152 data acquisition board (National Instruments, Austin, TX). The incident intensity of the excitation beam and the transmitted intensity of the fast IR thermometer beam are measured with photodiodes (Thorlabs, Newton, NJ), and the signals are digitized with PCIe-6251 data acquisition board (National Instruments, Austin, TX). The LED source is triggered to open the excitation beam a few milliseconds before the heating pulse and close one millisecond after the end of data acquisition. Timing of all events is determined by a DG535 delay generator (Stanford Research Systems, Sunnyvale, CA) triggered from Q-switch. The setup is computer controlled using a lab-made program written in LabVIEW (National Instruments, Austin, TX). The T-jump kinetic response from the corresponding osmolyte solution, measured in a special series of experiments, was subtracted from the absorption kinetics.
Materials
Pig heart LDH (Roche Diagnostics, Indianapolis, IN) was dialyzed at 4 C in 8,000 MWCO SpectraPor 7 tube (Fisher Scientific, Pittsburgh, PA) against pH 7.5 0.1 M TEA buffer (≥99.0% purity, SIGMA Chemical, St. Lewis, MO) 3 times for 20–25 hours each run, then concentrated using Microcon YM-10, 10,000 MWCO regenerated cellulose filters (Millipore, Bedford, MA). NAD+ free acid, and NADH sodium salt, both Grad 1, 100% purity (Roche Diagnostics, Indianapolis, IN), L-lactate sodium salt, 98% purity (SIGMA Chemical), pyruvate monosodium salt (Boehringer, Mannheim, Germany), trimethylamine N-oxide dihydrate, ≥99% purity (Fluka), and urea, ≥99% purity (SIGMA Chemical), were used as received. Fresh solutions of all reagents were prepared for each experiment.
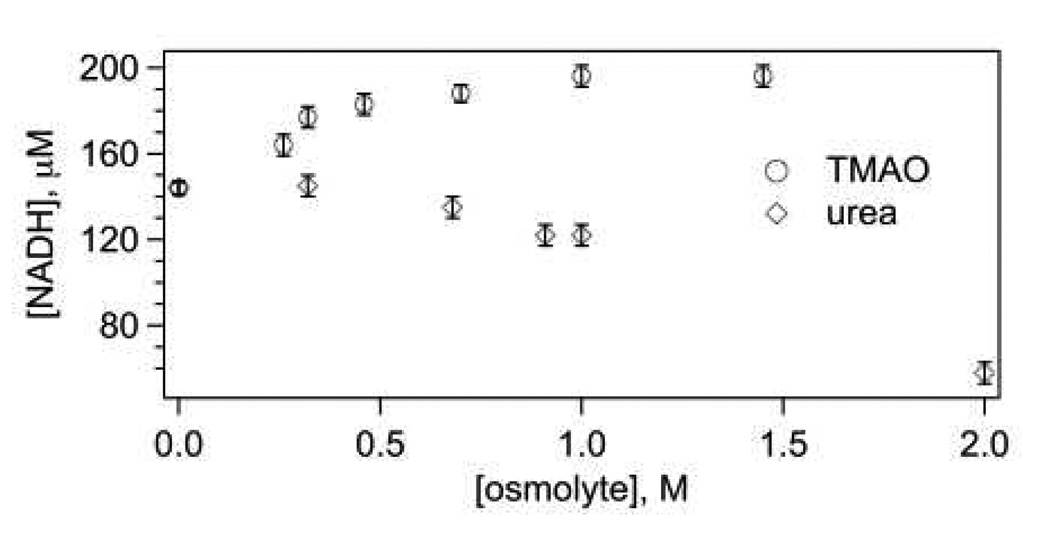
As determined previously (23), significant changes in NADH are only observed when the reaction conditions have excess lactate and NAD+. In this study, lactate concentration was 5 mM, which is well below self-inhibition level of 26 mM (24), and NAD+ concentration was 0.4 mM, stoichiometric with LDH active sites. Within the time period of our studies, we did not see any traces of the NAD-pyruvate adduct which can be produced slowly at high concentrations of pyruvate (20). The resulting total concentration of NADH (Fig. 2) increased from 140 µM to about 200 µM with addition of TMAO, saturating at 1 M of TMAO, but dropped with addition of urea instead of TMAO, reaching 58 µM at 2 M urea. The system with 2 M urea did not show any reaction related kinetic response, due to expected LDH unfolding.
Figure 2.
Total equilibrium concentration of produced NADH as a function of osmolyte concentration. Initial concentrations are 0.4 mN LDH (this refers to the molar concentration expressed subunits of the tetrameric protein), 0.4 mM NAD+, and 5 mM lactate.
RESULTS AND DISCUSSION
Laser-Induced T-Jump Kinetics
For the problem at hand, we are interested in how the dynamics of the binding and on-enzyme chemistry of the pyruvate-lactate interconversion catalyzed by LDH, as given in the simplified scheme, are affected by the addition of osmolytes:
| (1) |
The rate constant numbering and labeling pattern is in conformity with our previous study (23). The terms ‘open’ and ‘closed’ refer to the putative geometries of the surface mobile loop of the protein (residues 98–110). It is known that, in addition to the steps shown, NADH and NAD+ both dissociate from LDH, lactate is known to inhibit LDH•NADH at high concentrations, and pyruvate reacts slowly with LDH•NAD+ to form the protein bound NAD-pyruvate adduct. The chemical conditions here were chosen to minimize these side reactions while maximizing observation of the chemical step.
T-jump relaxation spectroscopy is quite a useful approach to study the kinetics of fast chemical reactions like the hydride transfer step of the LDH on-enzyme interconversion of lactate to pyruvate or fast structural rearrangements of the enzyme•ligand system. In relaxation spectroscopy, fast steps can occur independently of slow steps under favorable conditions, and they are not necessarily masked by the slow steps. Moreover, the resolution available to our studies, ca. 20 ns, is quite sufficient to resolve even the fastest events. We have previously worked out the equilibrium conditions of the reacting system as a function of the concentration of LDH, NAD+, and lactate (23). At high concentrations of the three species, excess lactate yields approximately equal amounts of species on the pyruvate and lactate sides of the reaction (Fig. 2).
We report here T-jump induced changes of NADH fluorescence and absorption in the reaction system above with initial concentrations of 0.4 mN LDH (this refers to the molar concentration of subunits of the tetrameric protein), 0.4 mM NAD+, 5 mM lactate, and varying amounts of an osmolyte: TMAO or urea. The absorption kinetics reflects changes in the total amount of NADH (protein-bound and not-bound), because the absorption spectrum of the nicotinamide moiety of NADH (maximum near 340 nm) is practically unaffected by binding. On the other hand, fluorescence emission of NADH is very sensitive to enzyme and substrate binding. The NADH emission quantum yield strongly increases when NADH binds LDH, and strongly drops when pyruvate binds LDH•NADH complex (22).
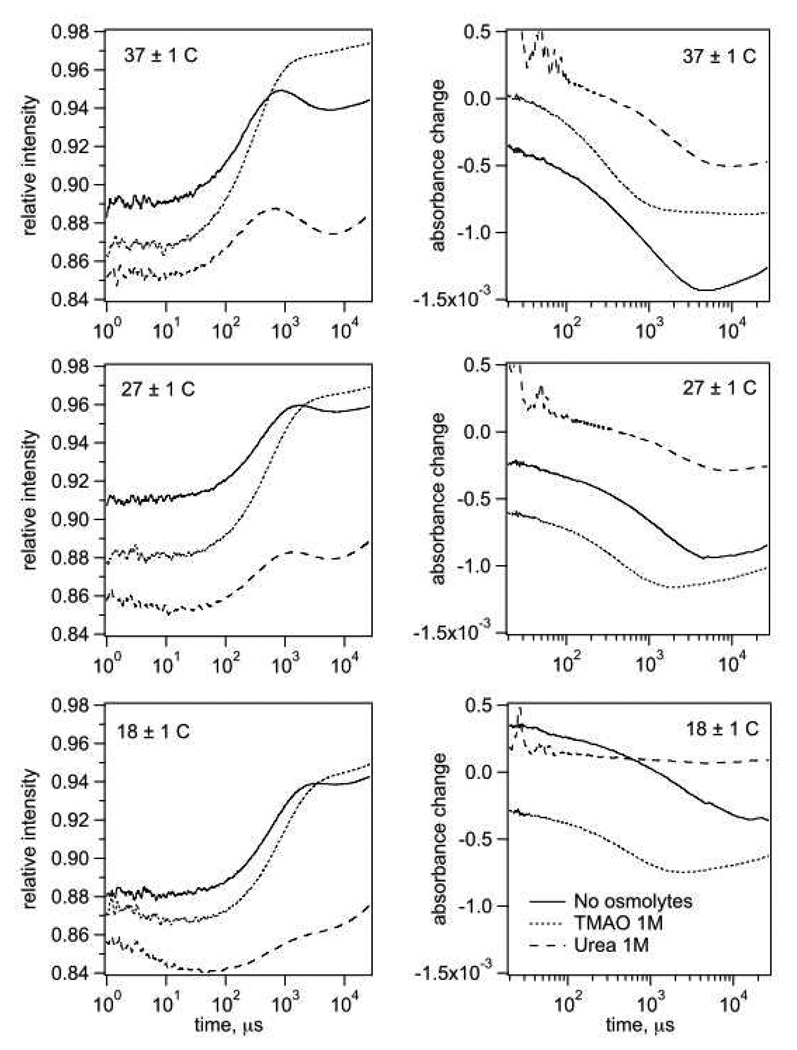
T-jump fluorescence kinetics without osmolytes (Fig. 3) exhibit a strong rise of intensity in the time range of few hundred microseconds that originates mainly from pyruvate unbinding from LDH•NADH complex (22, 23). This rise is followed by a small intensity drop in the range of few milliseconds that is mainly determined by relaxations of chemical step and loop opening/closing (23). In the absorption kinetics, the dominating feature is a drop of absorption due to a shift in the reaction equilibrium from NADH to NAD+ side.
Figure 3.
Fluorescence (left graphs) and absorption (right graphs) T-jump kinetics of the reaction system: LDH 0.4 mN, NAD+ 0.4 mM, lactate 5 mM (total initial concentrations) without osmolytes (solid lines), with 1 M TMAO (dotted lines), and with 1 M urea (dash lines). Spurious pulses below 100 µs arise from an artifact.
In presence of TMAO up to 1.4 M, the fluorescence kinetics significantly changes its profile: the sub-millisecond intensity rise becomes stronger, but the millisecond intensity drop gets weaker. The shape and amplitude of the absorption kinetics do not change much, but a shift to shorter times is observed. Urea in up to 1.0 M concentrations produces roughly the opposite effect on the shape of the fluorescence kinetics: the sub-millisecond rise becomes much weaker, while the millisecond drop becomes relatively stronger. In presence of urea, the amplitude of the absorption kinetic response becomes substantially smaller.
The kinetic measurements were done for a series of concentrations of TMAO or urea, and all data were preliminarily analyzed using multi-exponential fits. A preliminary analysis showed that the urea studies were not affected by protein unfolding as is found for urea concentrations higher than used here. Detailed processing using computer simulations was performed for three systems: (a) without osmolytes, (b) with 1 M TMAO, and (c) with 1 M urea. The data processing was based on the kinetic model given by Eq. 1. In addition to the reaction steps shown, the binding of NAD+ and NADH to LDH was included in the fits (given by rate constants k1, k−1, k7, k−7, respectively, as in our previous study). We omitted here the surface mobile loop opening and closing steps without the substrate or product bound. Therefore, the on-rate constants k2 and k−6 incorporate the binding competence factor that is the fraction of loop-open enzyme conformation. This minimal model for the analysis of protein dynamics contains 14 reaction rates. Some of them (k1, k−1, k2, k−2, k7, k−7) affect the kinetics in a minor degree. Therefore, their values are based on literature data for similar experimental conditions, with slight adjustments to obtain in our simulations the observed amounts of total NADH. The remaining eight kinetic rate constants are the unknowns. We used computer simulations, fitting the experimental data as described below to determine the microscopic rate constants of the individual reaction steps, basically in accord with our previous study (23).
Computer simulations procedure
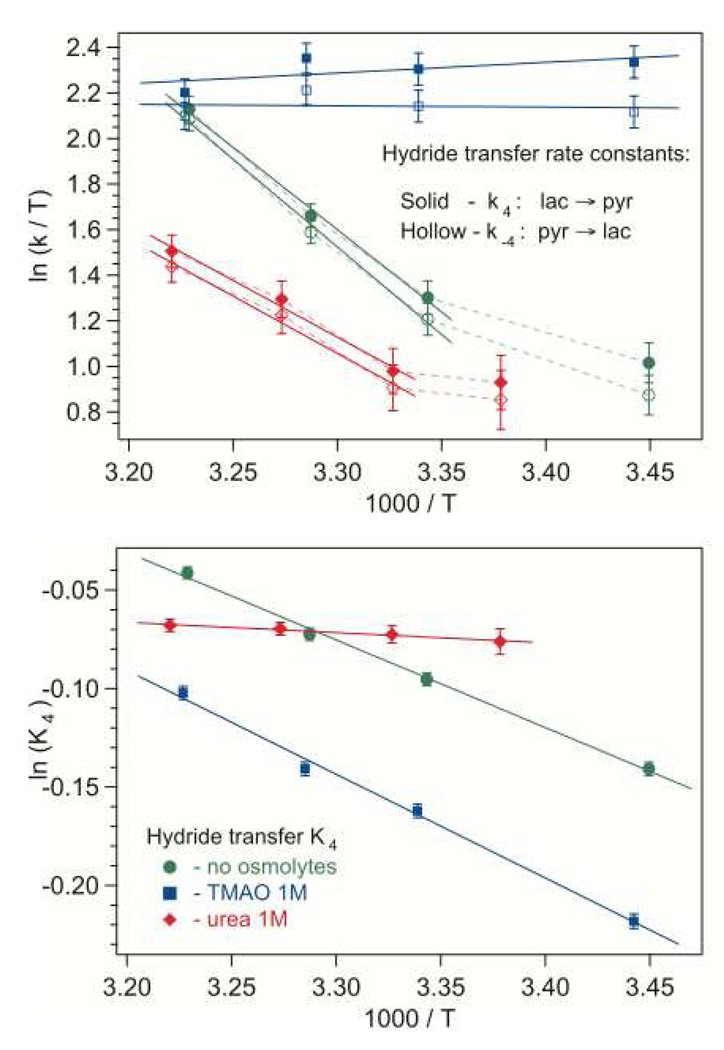
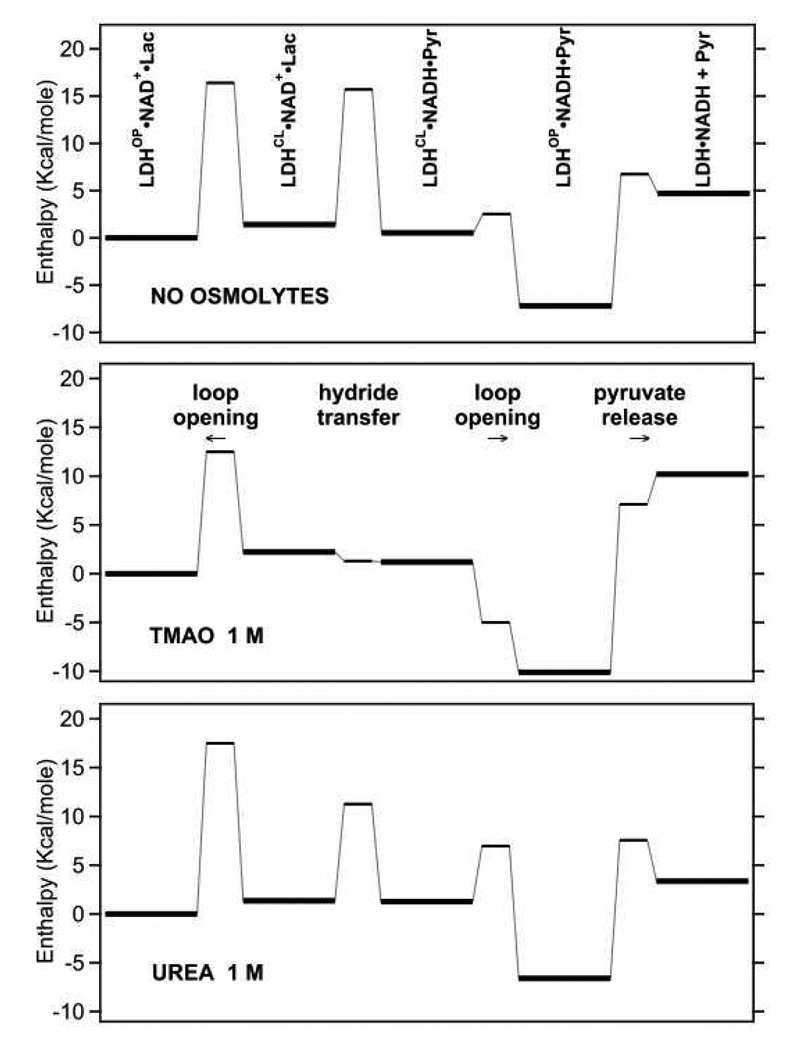
Gepasi, biochemical reaction simulation program, ver. 3.30 (25, 26) allows reconstruction, from known individual rate constants, of the kinetic response of a reaction system as it comes to equilibrium from a given initial state. The details of our simulation method were described previously (23). In short, the following procedure was used. To simulate each pair of fluorescence and absorption kinetics, we used a two-step process. First, the equilibrium concentrations of all reagents were found for the initial pre-jump temperature. Then, these results were used as starting parameters to find the time dependences of all concentrations on their approach to a new equilibrium at the new temperature after T-jump; the simulated absorption and fluorescence kinetics were calculated from them, using NADH relative quantum yields taken from our previous studies (22, 23). In every simulation step, some guess for the rate constants was used. The results from our previous study were taken as the initial guess for the very first simulation of no-osmolyte kinetics. The rate constants for the loop dynamics, chemical step, and pyruvate binding/unbinding, were adjusted to obtain the best fit to the experimental kinetics, within the noise. From the resulting rate constants, the starting guess values for simulation of a T-jump from the next temperature were determined by extrapolation or interpolation, and so on. For the experiments with osmolytes, the initial parameters were also slightly adjusted to obtain the observed total concentrations of NADH produced in the reaction. These simulations were performed at four after-jump temperatures for the reaction system without osmolytes, for the system with 1 M of TMAO, and for the system with 1 M of urea. As we demonstrated previously (23), each of the addressed reaction steps determines some specific part of the fluorescence and/or absorption relaxation kinetics, and unequivocal evaluation of hydride transfer and pyruvate binding/unbinding rate constants is possible. Some overlap between the kinetic features for the loop dynamics on two sides of the reaction makes the corresponding rate constants (k3, k−3, k5, and k−5) slightly interdependent. Nonetheless, all these rate constants affect the reconstructed absorption and fluorescence relaxation kinetics with their own, well distinguishable patterns. Moreover, compared with our previous results (23), much lower noise in the absorption kinetics, due to two orders of magnitude higher light intensity used in this study, allowed much better evaluation of all rate constants. The simulation results are presented in Figures 4–7 as Eyring plots of the rate constants and Arrheniun plots of the equilibrium constants for the hydride transfer step, for loop dynamics with substrate/product•cofactor bound, and for pyruvate binding/unbinding. The error bars were determined from average parameter variances in near-successful iterations resulting in simulated kinetics with their difference close to the noise level. The activation energies and enthalpy differences for the addressed reaction steps without and in presence of the osmolytes were determined from the slopes of the plots. The resulting values are presented in Tables 1–4, and summarized in Figure 8 as enthalpy profiles.
Figure 4.
Hydride transfer rate constants in Eyring coordinates (upper graph) and equilibrium constant in Arrhenius coordinates (lower graph): without osmolytes, with 1 M TMAO, and with 1 M urea. On the upper graph, solid symbols correspond to the forward reaction (from lactate to pyruvate), and hollow symbols represent the back reaction. Solid lines are linear fits. The error bars represent average parameter variances in near-successful iterations resulting in simulated kinetics with their difference close to the noise level.
Figure 7.
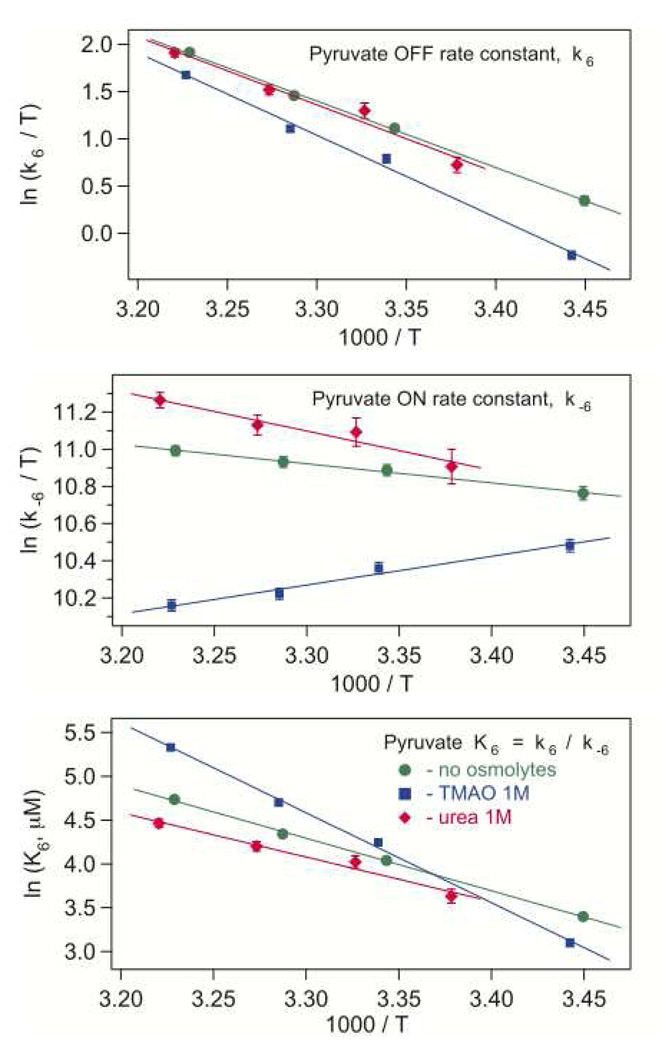
The effect of osmolytes on the pyruvate un/binding rate constants (Eyring coordinates, top and middle graphs) and the dissociation constant (Arrhenius coordinates, lower graph). The error bars represent average parameter variances in near-successful iterations resulting in simulated kinetics with their difference close to the noise level.
Table 1.
The hydride transfer barriers and enthalpy difference obtained from computer simulations of experimental T-jump kinetics.
| ΔH‡L, kcal/mole | ΔH‡P, kcal/mole | ΔH, kcal/mole | |
|---|---|---|---|
| No osmolyte | 14.5±1.6 | 15.5±1.5 | 0.89±0.04 |
| TMAO, 1 M | −1.0±0.9 | 0.0±0.9 | 1.05±0.05 |
| Urea, 1 M | 9.6±2.3 | 9.7±2.3 | 0.10±0.08 |
ΔH‡L is the enthalpy barrier height on the ‘lactate’ side derived from the slope of k4 Eyring plot. ΔH‡P is the enthalpy barrier height on the ‘pyruvate’ side derived from k−4 Eyring plot. Barrier heights for no-osmolyte and urea systems were calculated for the temperature range 26–38 C. ΔH is the enthalpy difference derived from the Arrhenius behavior of K4 = k−4 / k4.
Table 4.
Apparent barrier heights and enthalpy difference for pyruvate binding to LDH•NADH complex.
| ΔH‡OFF, kcal/mole | ΔH‡ON, kcal/mole | ΔH, kcal/mole | |
|---|---|---|---|
| No osmolyte | 14.0±0.5 | 2.0±0.4 | 12.0±0.4 |
| TMAO, 1 M | 17.3±0.5 | −3.1±0.4 | 20.3±0.5 |
| Urea, 1 M | 14.1±1.1 | 4.1±1.1 | 9.8±1.1 |
ΔH‡OFF is the enthalpy barrier derived from k6. ΔH‡ON is the enthalpy barrier derived from k−6. ΔH is the enthalpy difference derived from the Arrhenius behavior of K6 = k6 / k−6.
Figure 8.
Enthalpy profiles for the hydride transfer, loop opening/closing, and pyruvate un/binding reaction steps without osmolytes, with 1 M TMAO, and with 1 M urea. The terms ‘OP’ and ‘CL’ refer to the loop open and closed geometries. Zero energy level is arbitrarily assigned to the lactate-side encounter complex (actually, this level must slightly differ for the three systems).
Hydride transfer
Our previous work associated the kinetic events given by k4 and k−4 with the hydride transfer chemical step based on a derived primary kinetic H-D isotope effect KIE of about 1.7 (23). The temperature behavior of the rate constants for the chemical step obtained from the simulations for the on-enzyme lactate to pyruvate (k4) and pyruvate to lactate (k−4) reactions in the system without osmolytes is shown in Eyring coordinates in Fig. 4, upper graph. A similar pattern, but with lower slope, is observed with 1 M of urea. The barrier height corresponding to the nearly linear higher-temperature part is about 1/3 lower with urea (Table 1). This certainly shows that in 1 M urea, the active site domain is distorted but not unfolded. The key interacting groups involved in the hydride transfer are still in their proper positions and in a close enough proximity to the substrate to catalyze chemistry. The system with 1 M of TMAO shows a quite different pattern of behavior: the hydride transfer rate constants are close to the maximum, high-temperature values observed for the no-osmolyte system, and nearly independent of temperature in the whole range addressed. In general, hydride transfer rates are higher in TMAO and lower in urea than in the no-osmolyte system. Qualitatively, this is in accord with the presumed affect of these osmolytes: TMAO promotes compaction and protein stability while urea works in the opposite direction. Strong enhancement of enzymatic hydride transfer from NADH due to high-pressure barrier compression, either promoting tunneling through the transition state barrier or classical barrier traversal, has been observed experimentally (27, 28).
The microscopic ‘equilibrium constant’, K4 = k−4 / k4, of the hydride transfer step (Fig. 4, lower graph) is close to unity in all cases, and the on-enzyme hydride transfer is almost isoenergetic: the enthalpy of on-enzyme conversion of lactate/NAD+ into pyruvate/NADH is much lower than that in solution (NADH is a high-energy compound). Moreover, the energy levels of lactate/NAD+ and pyruvate/NADH are inverted on enzyme with the on-enzyme pyruvate/NADH energy slightly lower. A nearly linear Arrhenius dependence of K4 is observed for all three systems: no-osmolyte, TMAO, and urea. The corresponding enthalpy values are shown in Table 1. TMAO in 1 M concentration increases the hydride transfer enthalpy of K4 by 18%. In 1 M of urea, the enthalpy drops substantially. It seems likely that the decrease and inversion of the enthalpy is the result of active-site electrostatic interactions. These interactions presumably become stronger in TMAO due to compaction of the globule, yielding a stronger inversion of the hydride transfer enthalpy. Urea apparently produces the effect opposite to TMAO, expanding the protein globule and weakening the active site electrostatic interactions. This results in the decrease of the inverted hydride transfer enthalpy, almost to the crossover point.
Active site loop dynamics
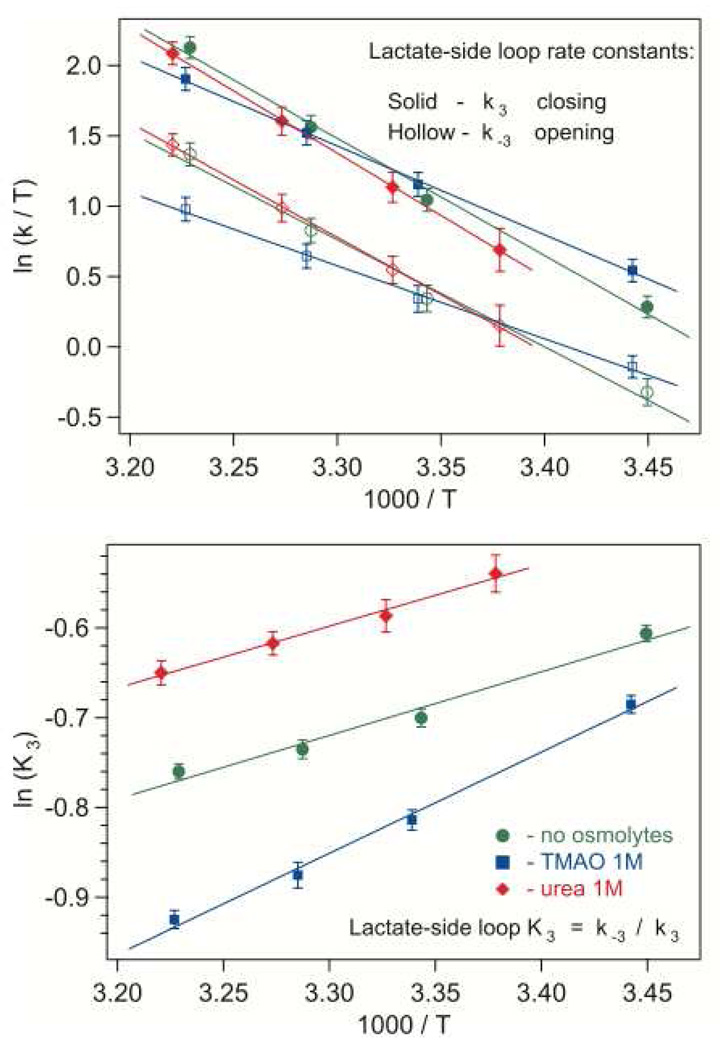
As shown in our previous studies (22, 23), the tails of the absorption and fluorescence kinetics after 0.5 ms depend significantly on the active site mobile loop dynamics (k3, k−3, k5, and k−5), and variation of each rate constant affects the kinetics in its own specific way. The simulation results show that for all three systems studied, in the temperature range 15–37 C, the mobile loop closing rate is 1.5–3 times higher than the opening rate for both LDH•NAD+•lactate (Fig. 5) and LDH•NADH•pyruvate (Fig. 6) species. The loop is mainly in the closed conformation. It might be natural to expect that opening the loop requires additional energy, and the open/closed ratio would increase with temperature, becoming closer to unity. However, as in our previous study of this system (23), this ratio always decreases with temperature. This anti-Arrhenius temperature dependence, as proposed in our previous reports on substrate binding dynamics (15, 22), appears to originate from partial unfolding required for the loop motions, which results in substantial entropy changes.
Figure 5.
The effect of osmolytes on loop opening and closing rate constants with bound lactate/NAD+, shown in Eyring coordinates (upper graph). The lower graph shows the loop equilibrium constant in Arrhenius coordinates. The error bars represent average parameter variances in near-successful iterations resulting in simulated kinetics with their difference close to the noise level.
Figure 6.
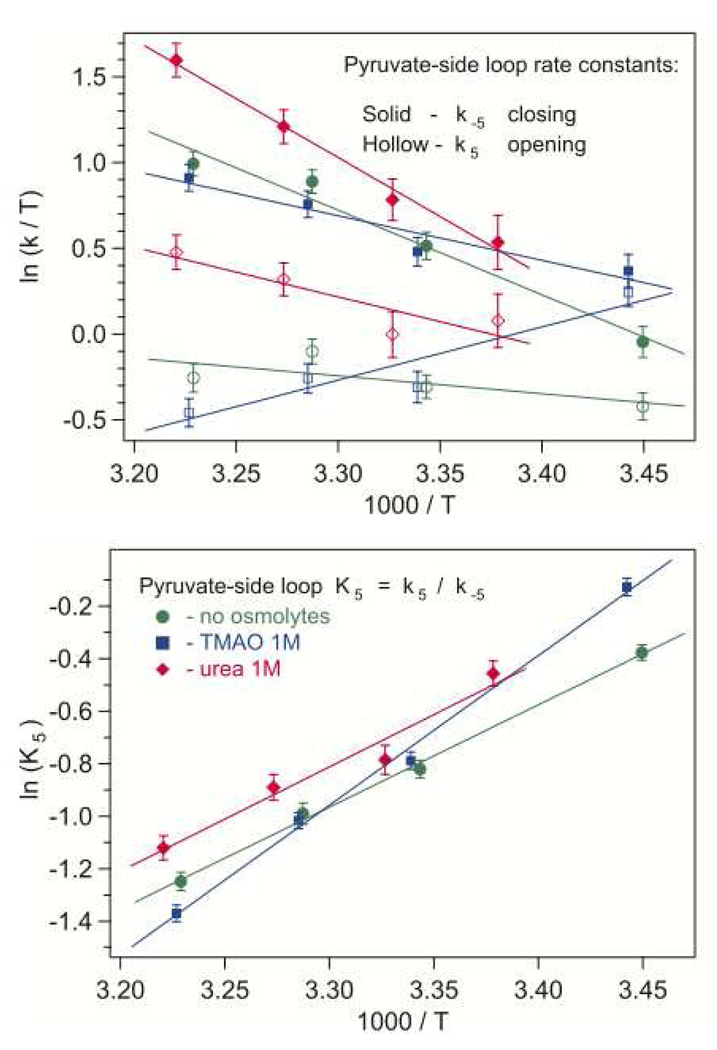
The effect of osmolytes on loop opening and closing rate constants with bound pyruvate/NADH, shown in Eyring coordinates (upper graph). On the lower graph, the loop equilibrium constant is plotted in Arrhenius coordinates. The error bars represent average parameter variances in near-successful iterations resulting in simulated kinetics with their difference close to the noise level.
Addition of an osmolyte differently affects the loop behavior on two sides of the reaction. If lactate is bound to the LDH•NAD+ complex, TMAO increases, and urea slightly decreases the closed state preference (Fig. 5). With 1 M TMAO, loop closing and opening rates increase 24% and 50% correspondingly while the closing and opening enthalpy barriers drop correspondingly by 24% and 32% (Table 2). In urea, the loop rate constants do not change much, but both barriers increase by about 7%. The loop closing enthalpy is not affected by 1 M urea, and rises by about 60% with TMAO.
Table 2.
The active site loop closing and opening barrier heights and enthalpy difference, ΔH = Hclosed – Hopen, with bound lactate•NAD+.
| ΔH‡C, kcal/mole | ΔH‡O, kcal/mole | ΔH, kcal/mole | |
|---|---|---|---|
| No osmolyte | 16.5±1.0 | 15.2±1.1 | 1.40±0.11 |
| TMAO, 1 M | 12.5±1.0 | 10.3±1.0 | 2.23±0.13 |
| Urea, 1 M | 17.7±1.9 | 16.4±1.8 | 1.34±0.28 |
ΔH‡C is the loop-closing enthalpy barrier derived from the slope of k3 Eyring plot. ΔH‡O is the loop-opening enthalpy barrier derived from k−3 Eyring plot. ΔH is the enthalpy difference derived from the Arrhenius behavior of K3 = k−3 / k3.
On the pyruvate side, 1 M urea speeds up the loop motions (Fig. 6), especially the closing rate at higher temperatures. The rate constants increase by 20–75% for closing, and by about 50% for opening. The enthalpy barrier heights (Table 3) increase in urea: the opening barrier is 2.8 times higher than without osmolytes, and the closing barrier is higher by about 40%. The open/closed ratio for LDH•NADH•pyruvate complex increases in urea by about 20% uniformly, without change in the loop closing enthalpy. The effect of TMAO is even more complicated. At lower temperatures (15–20 C), the loop opening and closing rates are faster than without osmolytes, but at higher temperatures (above 25–27 C), they become slower. The loop-closing barrier height drops by 45% in 1 M TMAO, and the loop-opening rate constant exhibits strongly non-Arrhenius behavior with negative apparent activation enthalpy. The loop-closing enthalpy increases by 45%. Qualitatively, this all suggests that the loop opening in LDH•NADH•pyruvate complex requires stronger rearrangements around the active site, and more significant entropy changes than without osmolytes, most probably due to increased rigidity of the LDH backbone in TMAO.
Table 3.
The active site loop closing and opening barrier heights and enthalpy difference, ΔH = Hclosed – Hopen, with bound pyruvate•NADH.
| ΔH‡C, kcal/mole | ΔH‡O, kcal/mole | ΔH, kcal/mole | |
|---|---|---|---|
| No osmolyte | 9.7±1.0 | 2.2±1.0 | 7.8±0.4 |
| TMAO, 1 M | 5.3±1.1 | −6.2±1.1 | 11.3±0.5 |
| Urea, 1 M | 14.0±2.0 | 6.2±2.1 | 8.0±0.8 |
ΔH‡C is the loop-closing enthalpy barrier derived from k−5 Eyring plot. ΔH‡O is the loop-opening enthalpy barrier derived from k5 Eyring plot. ΔH is the enthalpy difference derived from the Arrhenius behavior of K5 = k5 / k−5.
Comparing the loop dynamics on the two sides of the reaction, we can also see that the loop opens and closes faster on the lactate side; the difference is greater at higher temperatures, and it increases even more on the addition of TMAO. This may be explained by additional steric hindrance in LDH•NADH•pyruvate complex for the loop motion resulting from the hydrogen bond between Arg-109 located in the loop and the carbonyl group of pyruvate. There is no such hydrogen bond in LDH•NAD+•lactate because lactate is not structurally poised for it. At the same time, the barrier for loop opening is lower on the pyruvate side than on the lactate side: 2.2 kcal/mole against 15.2 kcal/mole. Moreover, on both sides, TMAO decreases this barrier, and on the pyruvate side, TMAO even inverts the barrier. Apparently, the structural rearrangements required for loop motion in LDH•NADH•pyruvate complex are more severe than in LDH•NAD+•lactate.
Pyruvate release and binding
The upper graph in Fig. 7 shows temperature dependence of the rate constant (k6) for pyruvate release from the LDH•NADH complex. With and without osmolyte, this rate constant demonstrates a good linear dependence in the Eyring coordinates. The resulting enthalpy barrier of about 14 kcal/mole is practically unchanged in 1 M urea (Table 4). For 1 M TMAO, the off-rate is about 30% lower than without osmolyte, and the barrier is 24% higher. This is consistent with the assumed higher rigidity of the protein with added TMAO.
Compared to the no-osmolyte system, the apparent on-rate constant (k−6; middle graph in Fig. 7) increases with 1 M urea by 15–25%, but the apparent binding barrier becomes twice as high. TMAO effect is quite different: the pyruvate on-rate drops 1.5–2.3 times, and its temperature dependence becomes inverse-Arrhenius. Similar anti-Arrhenius behavior was observed for the binding of a pyruvate substrate analog, oxamate, to the LDH•NADH complex (15, 22).
Previous binding studies (15) of LDH•NADH with oxamate in the presence of osmolytes showed that the protein binary complex exists in two conformational ensembles: one that is competent (denoted ‘C’) to bind the substrate analog and one that is not (denoted ‘NC’). In the reaction kinetic scheme used here to analyze the data, we did not include the interconversion step between the ‘competent’ and ‘not binding competent’ forms. Therefore, assuming the same binding pathway for pyruvate as for oxamate, the observed rate constant is apparent, and the behavior shown in Fig 7, can be in fact represented as a product: kON App = kON • KC/NC, where kON is the actual on-rate constant, and the binding competence factor KC/NC = cC / (cC + cNC) is the fraction of LDH•NADH complex competent for pyruvate binding. The effect of temperature and osmolyte composition can modulate either factor. In the studies of that work, it was found that the observed on-rate followed both Arrhenius and inverse-Arrhenius behavior depending on the temperature range. The effects observed here for the on-rate of pyruvate are qualitatively similar in that both normal Arrhenius as well as inverse-Arrhenius behavior are observed. This reinforces our previous interpretation that the binding competent and incompetent LDH•NADH species differ in the rearrangement of low energy hydrogen bonds as would arise from changes in internal hydrogen bonding and/or increases in the solvation of the protein structure (15, 29).
CONCLUSIONS
It is a deep puzzle of how solutes affect protein structure and function. In general, numerous measurements have shown that the organic osmolyte, urea, increases Km values of enzymes while the counteracting osmolyte, TMAO, decreases them (5, 10, 30). That proteins populate a number and range of conformational sub-states, inter-converting on virtually all time scales from femtoseconds to minutes and longer, which may differ in their biological function is well established (although perhaps not so well appreciated given that static crystal structures of proteins, for example, tend to focus undue attention on average atomic positions). Mashino and Fridovich (10) hypothesized that TMAO affects protein function by shifting the conformational ensemble of the enzyme's native state so as to populate more compact conformers, while urea is shifting the native state ensemble in the opposite direction. Our recent studies on the effects of osmolytes on binding of substrate mimics to triosephosphate isomerase (14) and lactate dehydrogenase (15), showed that, not only was this true, but also osmolytes affected the thermodynamics and interconversion kinetics of protein-ligand complexes.
Osmolytes, TMAO and urea, strongly affect the rates of specific events along the LDH-catalyzed reaction: binding of substrates, loop closure, and the chemical event. The core process of this reaction, hydride transfer between the C2 atom of substrate (lactate or pyruvate) and C4 of the co-factor (NAD+/NADH respectively), is strongly enhanced by TMAO. Urea, on the other hand, decreases the rates substantially, and shifts the hydride transfer enthalpy, normally inverted with respect to that in solution, almost to zero. The chemical rate increase brought about by LDH is pretty well approximated by two, largely independent, molecular factors: (1) bringing the two interacting substrates close together in a reacting conformation and (2) strong electrostatic interactions between the lactate/pyruvate substrate and key active site residues, chiefly His-195, which stabilize the polar transition state of the reaction. Both factors would manifest in the ground state of the reaction complex by bringing about distance shortening between key interacting groups. We have shown that the LDH•NADH•oxamate (substrate analogue) Michaelis complex of LDH consists of an ensemble of interconverting (on time scales faster than the chemical rate) conformations, some much more reactive than others, as judged by the variation within the ensemble of the distances between the key groups (31).
Osmolyte-induced shifts in the conformational nature of the protein ensemble have been understood by studies (8, 11) showing that TMAO has an unfavorable and urea a favorable interaction with the peptide backbone of proteins. TMAO suppresses the native state structural fluctuations while urea increases them. These effects occur with all proteins, resulting in TMAO-induced shifts in the native state to a more compact ensemble, and urea-induced shifts result in a more flexible and dynamic native ensemble. Provided that reaction competent species are associated with more compact and reaction incompetent with less compact conformations, as seems reasonable given the molecular mechanism of the chemical step in LDH, their effects on the catalytic step would be as measured. On the other hand, the observed effect of TMAO and urea on the apparent pyruvate-binding rate constant suggests that more compact conformations are more likely to be substrate-binding incompetent, while a moderate shift to less compact conformations increases population of binding competent species. This shows that the effect of the osmolytes on the overall enzyme activity is dependent on counteracting factors, and not straightforward.
ABBREVIATIONS
- LDH
lactate dehydrogenase
- TMAO
trimethylamine-N-oxide
- TEA
triethanolamine
- FWHM
full width at half maximum
Footnotes
This work was supported by the Institute of General Medicine of the National Institutes of Health, program project grant No. 5P01GM068036; and Institute of Biomedical Imaging and Bioengineering, EB01958.
Contributor Information
Nickolay Zhadin, Email: nick.zhadin@einstein.yu.edu.
Robert Callender, Email: robert.callender@einstein.yu.edu.
REFERENCES
- 1.Yancey PH, Clark ME, Hand SC, Bowlus RD, Somero GN. Living with water stress: evolution of osmolyte systems. Science. 1982;217:1214–1222. doi: 10.1126/science.7112124. [DOI] [PubMed] [Google Scholar]
- 2.Yancey PH, Siebenaller JF. Trimethylamine oxide stabilizes teleost and mammalian lactate dehydrogenases against inactivation by hydrostatic pressure and trypsinolysis. J Exp Biol. 1999;202:3597–3603. doi: 10.1242/jeb.202.24.3597. [DOI] [PubMed] [Google Scholar]
- 3.Lin TY, Timasheff SN. Why do some organisms use a urea-methylamine mixture as osmolyte? Thermodynamic compensation of urea and trimethylamine N-oxide interactions with protein. Biochemistry. 1994;33:12695–12701. doi: 10.1021/bi00208a021. [DOI] [PubMed] [Google Scholar]
- 4.Wang A, Bolen DW. A naturally occurring protective system in urea-rich cells: mechanism of osmolyte protection of proteins against urea denaturation. Biochemistry. 1997;36:9101–9108. doi: 10.1021/bi970247h. [DOI] [PubMed] [Google Scholar]
- 5.Yancey PH, Somero GN. Counteraction of urea destabilization of protein structure by methylamine osmoregulatory compounds of elasmobranch fishes. Biochem J. 1979;183:317–323. doi: 10.1042/bj1830317. [DOI] [PMC free article] [PubMed] [Google Scholar]
- 6.Arakawa T, Timasheff SN. The stabilization of proteins by osmolytes. Biophys J. 1985;47:411–414. doi: 10.1016/S0006-3495(85)83932-1. [DOI] [PMC free article] [PubMed] [Google Scholar]
- 7.Bolen DW. Protein stabilization by naturally occurring osmolytes. Methods Mol Biol. 2001;168:17–36. doi: 10.1385/1-59259-193-0:017. [DOI] [PubMed] [Google Scholar]
- 8.Qu Y, Bolen DW. Hydrogen exchange kinetics of RNase A and the urea:TMAO paradigm. Biochemistry. 2003;42:5837–5849. doi: 10.1021/bi0206457. [DOI] [PubMed] [Google Scholar]
- 9.Doan-Nguyen V, Loria JP. The effects of cosolutes on protein dynamics: the reversal of denaturant-induced protein fluctuations by trimethylamine N-oxide. Protein Sci. 2007;16:20–29. doi: 10.1110/ps.062393707. [DOI] [PMC free article] [PubMed] [Google Scholar]
- 10.Mashino T, Fridovich I. Effects of urea and trimethylamine-N-oxide on enzyme activity and stability. Arch Biochem Biophys. 1987;258:356–360. doi: 10.1016/0003-9861(87)90355-9. [DOI] [PubMed] [Google Scholar]
- 11.Qu Y, Bolen CL, Bolen DW. Osmolyte-driven contraction of a random coil protein. Proc Natl Acad Sci U S A. 1998;95:9268–9273. doi: 10.1073/pnas.95.16.9268. [DOI] [PMC free article] [PubMed] [Google Scholar]
- 12.Baskakov I, Wang A, Bolen DW. Trimethylamine-N-oxide counteracts urea effects on rabbit muscle lactate dehydrogenase function: a test of the counteraction hypothesis. Biophys J. 1998;74:2666–2673. doi: 10.1016/S0006-3495(98)77972-X. [DOI] [PMC free article] [PubMed] [Google Scholar]
- 13.Yancey PH, Siebenaller JF. Coenzyme binding ability of homologs of M4-lactate dehydrogenase in temperature adaptation. Biochim Biophys Acta. 1987;924:483–491. doi: 10.1016/0304-4165(87)90164-4. [DOI] [PubMed] [Google Scholar]
- 14.Gulotta M, Qiu L, Desamero R, Rosgen J, Bolen DW, Callender R. Effects of cell volume regulating osmolytes on glycerol 3-phosphate binding to triosephosphate isomerase. Biochemistry. 2007;46:10055–10062. doi: 10.1021/bi700990d. [DOI] [PMC free article] [PubMed] [Google Scholar]
- 15.Qiu L, Gulotta M, Callender R. Lactate dehydrogenase undergoes a substantial structural change to bind its substrate. Biophys J. 2007;93:1677–1686. doi: 10.1529/biophysj.107.109397. [DOI] [PMC free article] [PubMed] [Google Scholar]
- 16.Burgner JW, 2nd, Ray WJ., Jr On the origin of the lactate dehydrogenase induced rate effect. Biochemistry. 1984;23:3636–3648. doi: 10.1021/bi00311a010. [DOI] [PubMed] [Google Scholar]
- 17.Burgner JW, 2nd, Ray WJ., Jr The lactate dehydrogenase catalyzed pyruvate adduct reaction: simultaneous general acid-base catalysis involving an enzyme and an external catalyst. Biochemistry. 1984;23:3626–3635. doi: 10.1021/bi00311a009. [DOI] [PubMed] [Google Scholar]
- 18.Burgner JW, 2nd, Ray WJ., Jr Acceleration of the NAD cyanide adduct reaction by lactate dehydrogenase: the equilibrium binding effect as a measure of the activation of bound NAD. Biochemistry. 1984;23:3620–3626. doi: 10.1021/bi00311a008. [DOI] [PubMed] [Google Scholar]
- 19.Deng H, Zhadin N, Callender R. Dynamics of protein ligand binding on multiple time scales: NADH binding to lactate dehydrogenase. Biochemistry. 2001;40:3767–3773. doi: 10.1021/bi0026268. [DOI] [PubMed] [Google Scholar]
- 20.Gulotta M, Deng H, Deng H, Dyer RB, Callender RH. Toward an understanding of the role of dynamics on enzymatic catalysis in lactate dehydrogenase. Biochemistry. 2002;41:3353–3363. doi: 10.1021/bi016009a. [DOI] [PubMed] [Google Scholar]
- 21.McClendon S, Vu DM, Clinch K, Callender R, Dyer RB. Structural transformations in the dynamics of Michaelis complex formation in lactate dehydrogenase. Biophys J. 2005;89:L07–L09. doi: 10.1529/biophysj.105.064675. [DOI] [PMC free article] [PubMed] [Google Scholar]
- 22.McClendon S, Zhadin N, Callender R. The approach to the Michaelis complex in lactate dehydrogenase: the substrate binding pathway. Biophys J. 2005;89:2024–2032. doi: 10.1529/biophysj.105.062604. [DOI] [PMC free article] [PubMed] [Google Scholar]
- 23.Zhadin N, Gulotta M, Callender R. Probing the role of dynamics in hydride transfer catalyzed by lactate dehydrogenase. Biophys J. 2008;95:1974–1984. doi: 10.1529/biophysj.108.132464. [DOI] [PMC free article] [PubMed] [Google Scholar]
- 24.Holbrook JJ, Liljas A, Steindel SJ, Rossmann MG. The Enzymes. Academic Press: New York; 1975. Lactate Dehydrogenase; pp. 191–293. [Google Scholar]
- 25.Mendes P. GEPASI: a software package for modelling the dynamics, steady states and control of biochemical and other systems. Comput. Appl. Biosci. 1993;9:563–571. doi: 10.1093/bioinformatics/9.5.563. [DOI] [PubMed] [Google Scholar]
- 26.Mendes P. Biochemistry by numbers: simulation of biochemical pathways with Gepasi 3. Trends Biochem. Sci. 1997;22:361–363. doi: 10.1016/s0968-0004(97)01103-1. [DOI] [PubMed] [Google Scholar]
- 27.Hay S, Scrutton NS. Incorporation of hydrostatic pressure into models of hydrogen tunneling highlights a role for pressure-modulated promoting vibrations. Biochemistry. 2008;47:9880–9887. doi: 10.1021/bi8005972. [DOI] [PubMed] [Google Scholar]
- 28.Hay S, Sutcliffe MJ, Scrutton NS. Promoting motions in enzyme catalysis probed by pressure studies of kinetic isotope effects. Proc Natl Acad Sci U S A. 2007;104:507–512. doi: 10.1073/pnas.0608408104. [DOI] [PMC free article] [PubMed] [Google Scholar]
- 29.Pineda JRET, Callender R, Schwartz SD. Ligand Binding and Protein Dynamics in Lactate Dehydrogenase. Biophysical J. 2007;93:1474–1483. doi: 10.1529/biophysj.107.106146. [DOI] [PMC free article] [PubMed] [Google Scholar]
- 30.Hochachka PW, Somero GN. Biochemical Adaptation. Oxford: Oxford University Press; 2002. Water-Solute Adaptions (Chapter 6) p. 466. [Google Scholar]
- 31.Deng H, Brewer S, Vu DM, Clinch K, Callender R, Dyer RB. On the pathway of forming enzymatically productive ligand-protein complexes in lactate dehydrogenase. Biophys J. 2008;95:804–813. doi: 10.1529/biophysj.108.128884. [DOI] [PMC free article] [PubMed] [Google Scholar]


