Abstract
Interleukin-13 (IL-13) has been linked to the pathogenesis of inflammatory diseases of the gastrointestinal tract. It is postulated that IL-13 drives inflammatory lesions through the modulation of both hematopoietic and nonhematopoietic cell function in the intestine. To delineate the relevant contribution of elevated levels of intestinal IL-13 to intestinal structure and function, we generated an intestinal IL-13 transgenic mouse (iIL-13Tg). We show that constitutive overexpression of IL-13 in the small bowel induces modification of intestinal epithelial architecture (villus blunting, goblet cell hyperplasia, and increased epithelial proliferation) and epithelial function (altered basolateral → apical Cl− ion conductance). Pharmacological analyses in vitro and in vivo determined that elevated Cl− conductance is mediated by altered cystic fibrosis transmembrane conductance regulator expression and activity. Generation of iIL-13Tg/Il13rα1−/−, iIL-13Tg/Il13rα2−/−, and iIL-13Tg/Stat6−/− mice revealed that IL-13-mediated dysregulation of epithelial architecture and Cl− conductance is dependent on IL-13Rα1 and STAT-6. These observations demonstrate a central role for the IL-13/IL-13Rα1 pathway in the regulation of intestinal epithelial cell Cl− secretion via up-regulation of cystic fibrosis transmembrane conductance regulator, suggesting an important role for this pathway in secretory diarrhea.
Keywords: Chloride Channels, Chloride Transport, Cytokine Action, Interleukin, Intestine, Chloride Ion, Interleukin-13
Introduction
Interleukin (IL)-13 is a pleiotropic Th2 cytokine that has been implicated in intestinal inflammatory diseases, including enteric helminth infection, food allergy, and inflammatory bowel diseases (1, 2). Expulsion of Nippostrongylus brasiliensis, a rodent gastrointestinal nematode parasite, and induction of oral antigen-induced diarrhea are delayed in Il13−/− mice (3, 4). Furthermore, neutralization of IL-13 by the IL-13 receptor α chain (IL-13Rα) 2 fusion protein (IL-13Rα2-Fc) abolished oxazolone-induced colitis (5).
Experimental analysis suggests that IL-13 regulates intestinal inflammatory responses via effects on hematopoietic and nonhematopoietic cells, including macrophages, epithelial cells, smooth muscle cells, and enteric neurons (1). IL-13 modulates intestinal epithelial differentiation and apoptosis (6, 7) and promotes alternatively activated macrophage (M2) gene expression, including arginase-I, mannose receptor (CD206), chitinase, and found in inflammatory zone (FIZZ) family members. Finally, IL-13 induces cholinergic and noncholinergic nerve-mediated smooth muscle contraction (8–11).
The biological activity of IL-13 is regulated via the IL-13R type I and type II (12). The type I receptor is a heterodimer of the IL-4R α chain (IL-4Rα) and IL-13Rα1, and ligand-receptor interactions induce phosphorylation of the IL-4Rα and subsequent activation of the signal transducers and activators of transcription (STAT)-6 signaling pathway (13). This pathway appears to be the primary pathway for IL-13-induced signaling in nonhematopoietic cells (14). The type II receptor is composed of IL-13Rα1 and IL-13Rα2 (15). IL-13Rα2 binds IL-13 with high affinity and is proposed to act as a decoy receptor that limits the activity of IL-13. Consistent with this, mice deficient in IL-13Rα2 demonstrate exaggerated IL-13-induced pathologies (16–18). IL-13Rα2 possesses a short cytoplasmic tail and is without signal motifs (15); however, there have been a number of reports to suggest IL-13 signals through this chain, possibly via a STAT6-independent, AP-1-dependent manner to induce activation of the Tgfβ1 promoter via the IL-13 type II receptor (19).
The reported role of IL-13 in the regulation of multiple aspects of intestinal function and evidence that dysregulation of this cytokine is important for the development of intestinal inflammatory responses prompted us to assess the consequence of elevated IL-13 on intestinal immunity and intestinal epithelial function in vivo. To address this, we generated IL-13 transgenic mice that constitutively overexpress IL-13 in small bowel intestinal epithelial cells. We show that constitutive expression of IL-13 in the small bowel did not alter intestinal immunity but rather had a significant effect on intestinal epithelial architecture and function. Our results indicate that IL-13 is an important regulatory factor of intestinal epithelial architecture and CFTR2-mediated Cl− ion conductance.
EXPERIMENTAL PROCEDURES
Mice
6–8-Week-old BALB/c wild type (WT) mice were obtained from the NCI, National Institutes of Health (Bethesda). STAT6−/−, Il13ra1−/−, and Il13ra2−/− mice (N10 BALB/c) were bred at Cincinnati Children's Hospital Medical Center as described previously (20). All mice were maintained in a barrier facility, and animals were handled under Cincinnati Children's Hospital Medical Center and IACUC-approved protocols.
Generation of Transgenic Mice
The Il13 cDNA was amplified by PCR employing oligonucleotides containing BamHI sites (5′-ggatccatgttggtgacatacatccttgc and 3′-ggatcctcatggtcggcttttctgcc), and the 446-bp fragment containing the entire coding region of the murine Il13 cDNA was ligated into pCR2.1 TOPO TA cloning vector. The Il13 cDNA was digested with BamHI, and the Il13 DNA was ligated into the BamHI site of the PBSIF1178-hGHpgkNeo plasmid, which contained a 3.5-kb EcoRI fragment consisting of nucleotides −1178 to +28 of rat fatty acid-binding protein intestinal (FABPi) promoter linked to nucleotides +3 to +2150 of human growth hormone gene (minus the 5′-regulatory sequences). The transgene plasmid was propagated in Escherichia coli DH5α cells. The transgene fragment was liberated from the vector sequences by EcoRI endonuclease digestion and gel electrophoresis and then purified using the QIAEX DNA extraction kit (Qiagen Inc., Chatsworth, CA). After extensive dialysis, 5 μg of the linearized fragment was co-electroporated with 5 μg of circular neomycin resistance plasmid (pMC1Neo, Stratagene, La Jolla, CA) into BALB/c embryonic stem (ES) cells, a generous gift of Dr. Birgit Ledermann (University of Zurich). Positive selection was performed with G418 for 10 days, and the seven surviving clones were screened by PCR for integration of the transgene. Of the three transgene-positive ES colonies, one was injected into 3.5-day-old blastocysts from C57BL/6 mice and implanted into pseudopregnant females. Chimeric mice were bred with WT BALB/c females, and germ line (white) mice were genotyped to identify transgene-positive mice. Heterozygous transgene-positive mice were crossed to WT BALB/c mice for two generations to remove any random modifications because of tissue culture. Employing the human growth hormone genomic fragment to ensure specificity, IL-13 transgenic (iIL-13Tg) mice were identified by Southern blot analyses. iIL-13Tg mice were also identified by PCR using a forward primer specific for the IL-13 cDNA in the transgenic construct (P1) (5′-ggatccatgttggtgacatacatccttgc-3′) and a reverse primer specific for the human growth hormone (P2) (5′-gtgagctgtccacaggacc-3′); the transgenic band was ∼484 bp. Il13Rα1−/− and Il13Rα2−/− mice expressing the iFABPp-IL-13 transgene were generated by backcrossing iIL-13Tg mice onto the Il13Rα1−/− and Il13Rα2−/− BALB/c background (20). Control mice for these experiments were littermate Il13Rα1−/− and Il13Rα2−/− mice negative for the IL-13 transgene.
Solutions and Drugs
Krebs buffer contained 4.70 mm KCl, 2.52 mm CaCl2, 118.5 mm NaCl, 1.18 mm NaH2PO4, 1.64 mm MgSO4, and 24.88 mm NaHCO3. The drugs used are as follows: acetylcholine, bumetanide, 4,4-diisothiocyanatostilbene-2,2′-disulfonic acid (DIDS), and chloride channel inhibitor 172 (CFTRInh172). All reagents were obtained from Sigma unless stated otherwise. Forskolin was obtained from BD Biosciences.
Ussing Chambers
1 cm of freshly isolated, serosal-stripped segments of jejunum was mounted between the hemi-chambers of an Ussing apparatus (U2500 dual Ussing chamber, Warner Instruments, Hamden, CT), and 0.112 cm2 of tissue was exposed to 10 ml of Krebs buffer at 37 °C. The transepithelial potential difference was detected with two paired electrodes that contain 4% agar in 3 m KCl. The electrodes were connected to a voltage clamp amplifier (EC-800, epithelial voltage clamp, Warner Instruments). The electrode potential difference and fluid resistance were compensated before mounting tissue segments into the chamber. To establish equilibrium, potential difference was continuously monitored under open circuit conditions for 15 min. Thereafter, the tissues were voltage-clamped at 0 mV while continuously measuring the short circuit current (Isc). Voltage pulses (3-mV square waves sustained for 5 s) were delivered every 50 s to yield a current response for calculation of resistance across a mucosa (resistance) from Ohm's law. Conductance (G, mS/cm2) was calculated from ΔIsc in response to periodic voltage pulses (5 mV). For ion conductance experiments, changes in Isc were determined for the cumulative addition of forskolin, acetylcholine, or carbachol to the serosal reservoir. After the peak response to the final concentration of each agonist was recorded, the Krebs buffer on each side of the chamber was replaced, and the tissue was allowed to equilibrate for 30 min. Upon re-equilibration, tissue was preincubated with ion channel blockers (DIDS 100 μm or CFTRInh172 to mucosal reservoir), and changes in Isc were measured in response to the addition of forskolin to the mucosal side.
In Vitro Permeability
Caco2bbe human intestinal adenocarcinoma cells (ATCC) were maintained in DMEM supplemented with 10% FCS, 0.1 mm nonessential amino acids, 1 mm sodium pyruvate, 10 mm HEPES, and 1× penicillin/streptomycin (all Invitrogen) in a humidified incubator (5% CO2, 37 °C). 5 × 10⁵ cells were seeded on snap wells (12 mm diameter, 0.4-μm pore; Corning Glass) and cultured for 18–21 days. Transepithelial resistance (TER) was monitored with an EVOM/Endohm (WPI Inc, Sarasota, FL), and intestinal epithelial monolayers with TER >250 ohms·cm2 were used for all experiments. IL-13- and control-stimulated intestinal epithelial monolayers were placed in Ussing chambers and allowed to equilibrate for 15 min; basal Isc and TER were measured as described previously (21). In some experiments following equilibration, tissue was preincubated with ion channel blockers (bumetanide 60 μm or DIDS 100 μm or CFTRInh172 20 μm to mucosal reservoir) for 30 min, and changes in Isc were measured in response to the addition of forskolin to the mucosal side. For the Cl− gradient experiments, CaCo2bbe cells were stimulated with IL-13 and exposed basolaterally to amphotericin B (20 μm) and ouabain (1 mm) for 30 min. The buffers in the apical and basolateral reservoirs were replaced with unmodified Krebs buffer and with modified Krebs buffer containing 2× NaCl, respectively. The tissue was allowed to equilibrate for 15 min, and basal Isc and TER were measured. For the Cl− substitution experiments, Krebs buffer in the serosal reservoir was replaced with a modified buffer consisting of 118.5 mm sodium gluconate, 4.70 mm potassium gluconate, 2.52 mm CaCl2, 1.18 mm NaH2PO4, 1.64 mm MgSO4, 24.88 mm NaHCO3, and 5.5 mm glucose; changes in Isc were measured in response to the addition of forskolin as described.
ELISA Measurements
Total specific IgE, IgG1, and IgG2a were determined as described previously (22).
LightCycler® PCR
RNA was isolated from tissue samples from WT and iIL-13Tg mice, and cDNA was generated by standard procedures. The RNA samples (500 ng) were subjected to reverse transcription analysis using Iscript reverse transcriptase (Bio-Rad) according to the manufacturer's instructions. Hypoxanthine phosphoribosyltransferase, occludin, claudin 2–5, and IL-4Rα, IL-13Rα1, and IL-BRα-2 were quantified by real time PCR using the LightCycler instrument and LightCycler FastStart DNA Master SYBR Green I as a ready-to-use reaction mix (Roche Diagnostics). Results were normalized to hypoxanthine phosphoribosyltransferase amplified from the same cDNA mix and expressed as fold induction compared with controls. cDNAs were amplified using the following primers: hypoxanthine phosphoribosyltransferase forward 5′-gtaatgatcagtcaacggggac-3′ and reverse 5′-ccagcaagcttgcaaccttaacca-3′; mOccludin forward 5′-tccgtgaaccttttgaa-3′ and reverse 5′-ggtgcataatgattgggtttg-3′; mClaudin 2 forward 5′-tgaacacggaccactgaag-3′ and reverse 5′-ttagcaggaagctgggtacag-3′; mClaudin 3 forward 5′-tgggagctgggttgtacg-3′ and reverse 5′-caggagcaacacagcaagg-3′; mClaudin 4 forward 5′-gagggctggggaccta-3′ and reverse 5′-gcaagacagtgcggaaag-3; CFTR forward 5′-acgttcacacccaactcaggctcc-3′ and reverse 5′-gaagcagccacctcaaccagaaaaa-3′; mIL-13Rα1 forward 5-catggagggtacaagttgtttcc-3′ and reverse 5′-gttttgactcttactctgactgtgtagaca-3′; and mIL-13 Rα2 forward 5′-tgtcttttctttatattccttttgttacttct-3′ and reverse 5′-acacacttcttttgttcagatccacat-3′.
Fluorescent-activated Cell Sorter (FACS) Analysis
Flow cytometry analyses were performed as described previously (22). All the following antibodies were from Pharmingen unless indicated otherwise: PerCP anti-mouse CD4 (l3T4) (RM4-5), PE anti-mouse CD8a (53-6.7); allophycocyanin anti-mouse CD62L (MEL-14); FITC anti-mouse CD44 (IM7); allophycocyanin anti-mouse CD25 (PC61); PE anti-mouse CD45RB (16A); FITC anti-mouse FoxP3 (FJK-16S); PE anti-mouse B220 (RA3-6B2); FITC anti-mouse CD23 (B3B4), and PE-Cy7 anti-mouse IgM (R6-60.2); allophycocyanin anti-mouse CD11c (HL3); APC-Cy7 anti-mouse Gr-1 (RB6–8C5); PE-Cy7 anti-mouse CD11b (M1/70); and PE anti-mouse CD4 (L3T4). The following antibodies were used as appropriate isotype controls: PerCP rat IgG2a (R35-95); PE rat IgG2a (53-6.7); allophycocyanin rat IgG2a (R35-95); FITC rat IgG2a (R35-95). 7-Aminoactinomycin D was used to identify nonviable cells (Pharmingen). Cells were analyzed on FACScalibur (Immunocytometry Systems), and analysis was performed using FlowJo software.
Histopathological Examination and Morphometric Analysis
Jejunum 8–18 cm distal to the pyloric sphincter was fixed in 10% formalin and stained using standard histological techniques. At least four random sections per mouse were analyzed. PAS staining for goblet cells was performed with a PAS staining kit (Poly Scientific R&D Corp., Bay Shore, NY). Quantification of PAS-positive cells was performed as described previously (22). Villous height and crypt depth were measured in at least 25 well oriented villus-crypt units per mouse using ImageProPlus as described previously (21).
Quantification of BRDU+ Intestinal Epithelial Cells
Bromo-2′-deoxyuridine (BrdU) in PBS was injected intraperitoneally (0.2 mg/g body weight), and mice were sacrificed 24 h later. BrdU-labeled cells in the jejunum were detected using a BrdU staining kit (Zymed Laboratories Inc.) per manufacturer's instructions. A minimum of 25 well oriented villus-crypt units per jejunum per mouse were counted for BRDU+ cells to quantify proliferation. To quantitate intestinal epithelial migration, the distance from the crypt base to the farthest BRDU+ epithelial cell was measured using ImageProPlus software (Media Cybernetics, Inc., Bethesda) as we have described previously (21). Apoptotic cells were detected by cleaved caspase-3 immunohistochemistry as described by the manufacturer (Cell Signaling Technology, Inc., Danvers, MA).
Protein and RNA Analysis
About 5-cm segments of jejunum were excised and flushed with calcium- and magnesium-free HBSS (CMF-HBSS). The jejunum was cut open longitudinally, incubated in 5 ml of CMF-HBSS containing 10 mm dithiothreitol (DTT) for 30 min at 4 °C, washed once with CMF-HBSS to remove DTT, and incubated with CMF-HBSS containing 5 mm EDTA for 1 h at 4 °C. Next, it was vortexed vigorously to separate the epithelial cells, filtered through a filter (pore size 70 μm) to remove large pieces, and centrifuged three times at 1600 rpm for 10 min. Finally, the cells were suspended in TRIzol® (Invitrogen) for RNA analysis or M-PER for protein analysis. Jejunum protein (30 μg) was separated under reducing and denaturing conditions on 4–12% BisTris gels (Invitrogen) and blotted onto nitrocellulose membranes (Invitrogen). Rabbit primary antibodies against actin (1:2000, Sigma), claudins 1–3 (1 μg/ml, Zymed Laboratories Inc.), and E-cadherin (1:1000 Zymed Laboratories Inc.) were used and detected by goat anti-rabbit peroxidase-conjugated secondary antibody (1:10,000). Densitometric analysis was performed using Image J (National Institutes of Health). RNA analysis by quantitative real time PCR was performed as described previously (22).
Western Blotting
Jejunum (30 μg) lysates were loaded in 4–12% BisTris gels and transferred to a nitrocellulose membrane (Invitrogen). CFTR were detected by using rabbit anti-CFTR (clone 3G11; gift from Professor William Balch, Scripps Research Institute, La Jolla, CA, as part of the CFTR folding Consortium) antibodies followed by anti-rabbit peroxidase-conjugated antibody (Cell Signaling) and ECL-plus detection reagents (GE Healthcare). Rabbit anti-actin (Santa Cruz Biotechnology, Santa Cruz, CA) was used as loading control. Semi-quantification analyses of pSTAT-6 levels were performed using Image version 1.6 software (National Institutes of Health). X-ray film was scanned and analyzed with Image software to quantitate band densities. The mean density of the total and phosphorylated STAT-6 was normalized with the band intensity obtained for the actin. Results are expressed as the ratio of pSTAT-6/STAT-6/actin.
Lentiviral Transduction
For lentiviral shRNA transduction, CaCo2bbe cells at 70–90% confluence were transduced with lentiviral particles containing shRNAs targeting STAT-6 (Mission® STAT-6 shRNA TRC 0000019409; Sigma) or a nontarget control shRNA (Mission® nontarget shRNA control; Sigma). STAT-6 shRNA and nontarget control shRNA lentivirus was generated by the Cincinnati Children's Hospital Medical Center Viral Core using a 4-plasmid packaging system. Lentiviral particles were incubated with CaCo2bbe cells (multiplicity of infection ∼10) in the presence of Polybrene (4 μg/ml; Sigma) for 24 h followed by selection in puromycin at a concentration (2 μg/ml) that killed uninfected cells within 3 days. Puromycin-resistant cells were passaged for 14 days and demonstrated stable GFP gene expression (results not shown). The lentiviral-transduced CaCo2bbe cells (passage 1–5) were grown to confluency under puromycin selection pressure until they reached >250 ohms·cm2; electrophysiological and biochemical analyses were then performed as described. STAT-6 knockdown was assessed by Western blot analyses using the anti-STAT-6 (Santa Cruz Biotechnology) and anti-pSTAT-6 (Y641; Cell Signaling, Danvers, MA) mAb.
Statistical Analysis
Data are expressed as means ± S.E., unless otherwise stated. Statistical significance comparing different sets of mice was determined by Student's t test. In experiments comparing multiple experimental groups, statistical differences between groups were analyzed using the one-way analysis of variance nonparametric and a Bonferroni post-test. p < 0.05 was considered significant. All analyses were performed using Prism 4.0 software (Prism Software Corp., Irvine, CA).
RESULTS
Effects of Intestinal Epithelial IL-13 on Intestinal Immunity
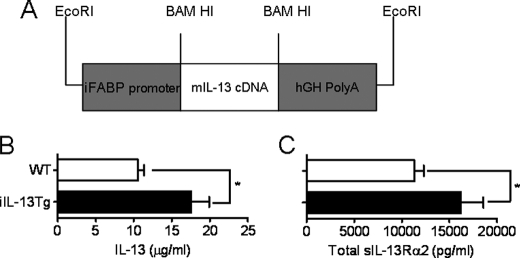
To assess the effect of elevated intestinal IL-13 on gastrointestinal function, we generated a transgenic mouse whereby murine IL-13 was under the transcriptional regulation of the intestine-specific promoter of the rat fatty acid-binding protein (iFABPp) gene, resulting in constitutive expression of IL-13 in the small bowel (iIL-13Tg) (Fig. 1A). Lightcycler PCR analysis revealed increased jejunal IL-13 mRNA expression in the iIL-13Tg mice compared with littermate WT mice (supplemental Table 1). IL-13 mRNA levels in lung, liver, and colon in iIL-13Tg were comparable with that of WT mice, confirming tissue-specific expression of IL-13 (supplemental Table 1). Consistent with increased jejunal IL-13 mRNA expression, IL-13 protein in the intestine was significantly elevated in iIL-13Tg mice compared with WT mice (Fig. 1B). Previous studies have demonstrated that IL-13 activities are counter-regulated by the sIL-13Rα2 (2, 18, 23–25). In turn, IL-13 up-regulates sIL-13Rα2 mRNA and serum protein levels (18, 25, 26). Consistent with this, the serum levels of total sIL-13Rα2 were significantly elevated in iIL-13Tg mice compared with WT mice (Fig. 1C). Serum levels of sIL-13Rα2-IL-13 complex were comparable between iIL-13Tg and WT mice (serum sIL-13Rα2-IL-13 complex, 2375 ± 421.3 versus 2433 ± 405.9 pg/ml WT versus iIL-13Tg mice, respectively, n = 6–8 mice per group)). Importantly, the levels of IL-13 and sIL-13Rα2 in the iIL-13Tg mice were comparable with those observed in WT mice during Th2-inflammatory responses (25). To assess the effect of intestinal IL-13 on immune parameters, we examined B and T cell phenotypes and activation status. Flow cytometry analyses of CD4+, CD8+ T cells, and B (B220) cells in the mesenteric lymph node and spleen of iIL-13Tg and WT mice revealed no difference in the number or percentages of B or T cells or in T cell activation status (CD44+, CD62L+, and CD69+) between groups (supplemental Table 2). Collectively, these studies indicate that elevated IL-13 in the small intestine has relatively little effect on both intestinal and systemic B and T cell immunity.
FIGURE 1.
Assessment of base-line serum IL-13, IL-13Rα2, and serum Ig in iIL-13Tg mice. A, diagrammatic representation of the rat intestinal fatty acid-binding protein (FABP) promoter (iFABPp)-mouse IL-13 (mIL-13) transgenic construct. B, intestinal IL-13. C, serum sIL-13Rα complexed to IL-13 (sIL-13Rα2-IL-13 complex) in wild type (WT) and iIL-13Tg mice. Values represent mean ± S.E.; n = 5–7 mice per group. Statistical significance is as follows: *, p < 0.05.
Overexpression of IL-13 in the Small Intestine Alters Intestinal Epithelium Morphology
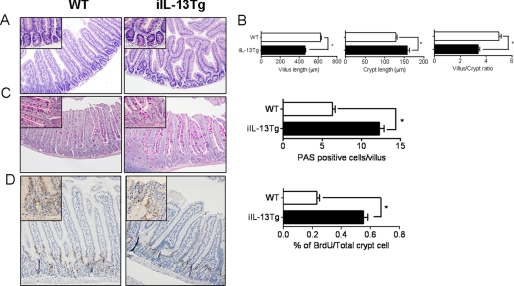
To assess the consequence of IL-13 expression on intestinal epithelia architecture, we performed histological analysis on the small intestine from WT and iIL-13Tg mice (Fig. 2A). Notably, we observed gross morphological changes to the intestinal epithelium of iIL-13Tg mice compared with WT mice, including bifurcation of the villus, shortening and blunting of the villus, and decreased villus/crypt ratio (Fig. 2, A and B). Analysis of intestinal epithelial cell populations revealed increased PAS+ goblet cells in iIL-13Tg mice compared with WT (Fig. 2C). To assess if modification of the intestinal epithelium was associated with increased proliferation, we performed BrdU proliferation analysis and revealed increased epithelial proliferation in iIL-13Tg mice compared with WT mice (Fig. 2D). Additionally, we quantitated epithelial cell migration in the jejunum along the villus crypt-axis in iIL-13Tg and WT mice. Morphometric analysis revealed no significant difference in the rate of epithelial cell migration up the villus-crypt axis of jejunum from iIL-13Tg mice compared with WT (Fig. 2D and results not shown). Furthermore, we assessed intestinal epithelial cell apoptosis and demonstrated no differences in the level of anti-caspase-3+ epithelial cells in the jejunum of iIL-13Tg mice compared with WT mice (supplemental Fig. S1). These data indicate that elevated small bowel IL-13 promotes intestinal epithelial proliferation and altered epithelia architecture.
FIGURE 2.
Altered intestinal architecture and epithelial proliferation in iIL-13Tg mice. A, representative photomicrograph of H&E-stained jejunum from strain- and aged-matched WT and iIL-13Tg mice. B, villus length, crypt length, and villus/crypt ratio of jejunum of WT and iIL-13Tg mice. C, representative photomicrographs of PAS-stained jejunum and quantification of total PAS+ cells in the jejunum of WT and iIL-13Tg mice. D, representative photomicrographs of BrdU-stained jejunum and quantification of total number of BrdU+ cells in the jejunum of WT and iIL-13Tg mice. Values represent mean ± S.E.; n = 5–7 mice per group. Statistical significance is as follows: B–D, *, p < 0.01 versus WT.
Overexpression of IL-13 in the Small Intestine Up-regulates Cl− Secretion
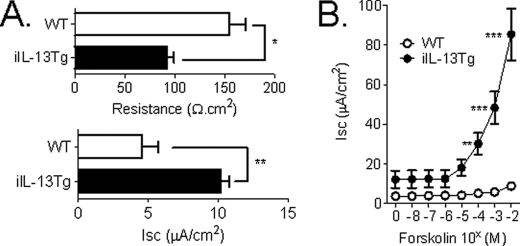
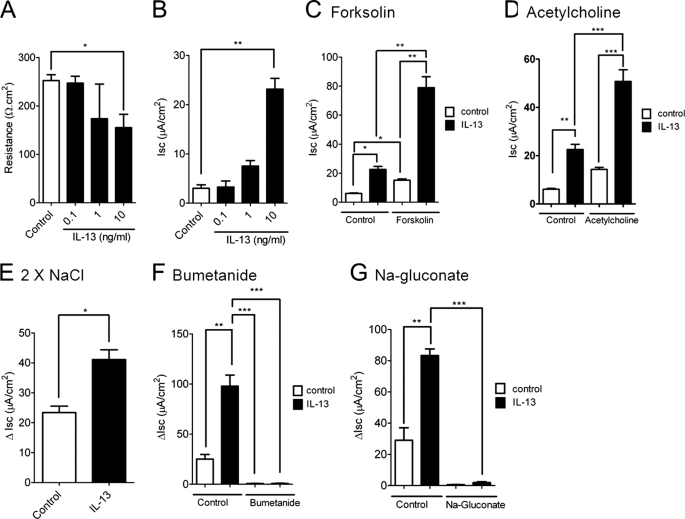
IL-13 is a key Th2 cytokine that has been implicated in aspects of intestinal function (7, 27). To delineate the effect of increased intestinal IL-13 on small intestinal barrier function, we examined the resistance across the mucosa (resistance) and ion conductance through ex vivo measurements of Isc across the jejunum of iIL-13Tg and littermate WT mice. Resistance was significantly decreased in the jejunum from iIL-13Tg mice compared with WT (Fig. 3A). Decreased resistance was associated with increased basal (Fig. 3A) and forskolin-induced transepithelial Isc (Fig. 3B) and conductance (forskolin (20 μm); ΔG WT 2.20 ± 0.38 versus iIL-13Tg 6.28 ± 0.32 mS·cm2; mean ± S.D.; p < 0.0005). To dissect out the molecular basis of IL-13-induced ion secretion, we assessed the ability of IL-13 to influence intestinal epithelial Isc in vitro in the colonic epithelial adenocarcinoma cell line CaCo2bbe. Twenty four-hour basolateral stimulation of the intestinal epithelial monolayer with recombinant murine IL-13 induced a concentration-dependent reduction in TER (Fig. 4A). Similar to our in vivo analyses, the reduction in TER was associated with a concentration-dependent increase in Isc (Fig. 4B). Ion conductance of intestinal epithelial cells is primarily regulated by Na+ absorption or Cl− secretion (28, 29). To determine whether epithelial exposure of IL-13 modulated Cl− secretion, we examined cAMP (forskolin)-induced and Ca2+-mediated (cholinergic stimulation; acetylcholine) electrogenic Cl− secretion. IL-13 potentiated both forskolin- and cholinergic Ca2+-mediated Isc (Fig. 4, C and D). Cl− secretion in human and murine intestinal epithelia is primarily driven by apically expressed Cl− channels (30, 31). To assess whether IL-13 modulated apical Cl− channel activity, CaCo2bbe cells were stimulated with IL-13 and exposed basolaterally to amphotericin B (20 μm) and ouabain (500 μm) in the presence of a basolateral to apical Cl− concentration gradient (Baso → Ap [Cl−]) (Fig. 4E). The Baso → Ap [Cl−] gradient elicited a significant increase in luminally directed Isc across IL-13-stimulated and nonstimulated CaCo2bbe cells (Fig. 4E). Notably, the ΔIsc of the IL-13-stimulated CaCo2bbe cells was significantly greater than that of control-treated cells (Fig. 4E). These studies indicate that apical Cl− channel activity is up-regulated by IL-13. To confirm that the IL-13-elicited increase in Isc represents Cl− secretion, Isc was assessed in IL-13-stimulated epithelial monolayers following basolateral addition of 20 μm bumetanide, an inhibitor of the Na+-K+Cl− cotransporter that regulates basolateral cellular Cl− uptake (32), or following basolateral substitution of Cl− with sodium gluconate, a membrane-impermeable ion (Fig. 4, E and F) (33). Basolateral treatment with bumetanide or Cl− substitution by sodium gluconate diminished Isc response by >90%, indicating that IL-13-elicited increases in Isc were primarily due to electrogenic Cl− secretion.
FIGURE 3.
Altered transepithelial resistance and intestinal ion conductance in iIL-13Tg mice. Base-line TER and Isc (A) and forskolin-induced Isc (B) of isolated segments of jejunum from WT and iIL-13Tg. Values represent mean ± S.E.; A, n = 12–18 mice per group and B, n = 4–6 mice per group. Statistical significance is as follows: A, *, p < 0.01 versus WT; B, **, p < 0.01 versus WT; ***, p < 0.005 versus WT.
FIGURE 4.
IL-13-induced apical intestinal epithelial cell Cl− conductance. TER (A) and Isc (B) of a confluent CaCo2bbe cell monolayer 24 h following 0.1–10 units/ml IL-13 stimulation. Forskolin-induced (C) and acetylcholine-induced (D) Isc of CaCo2bbe cells following 24 h of stimulation with 10 ng/ml IL-13. E, change in Isc (ΔIsc) of control- and IL-13-stimulated CaCo2bbe cells exposed basolaterally to amphotericin B (20 μm) and ouabain (1 mm) in the presence of basolateral to apical Cl− concentration gradient (Baso → Ap [Cl−]). ΔIsc of control- and IL-13-stimulated CaCo2bbe cells following basolateral addition of bumetanide (60 μm) (F) or following basolateral substitution of Cl− with sodium gluconate (G). Values represent mean ± S.E.; n = 6–9 mice per group. Statistical significance is as follows: *, p < 0.05; **, p < 0.01; and ***, p < 0.005.
IL-13-induced Cl− Secretion in Intestinal Epithelial Cells Is CFTR-dependent
Cl− secretion across intestinal epithelia can be mediated via different Cl− channels, including Ca2+-activated, CFTR, or volume-regulated Cl− channels (30, 34). To identify the Cl− channel dysregulated by IL-13, we employed pharmacological inhibitors of Cl− channel activity (DIDS and CFTRInh172). The Ca2+-activated Cl− channel is DIDS-sensitive, whereas the CFTR is DIDS-insensitive (30, 35). IL-13 stimulation of CaCo2bbe cells induced an increase in forskolin-induced ΔIsc (Fig. 5) that was not sensitive to apical administration of DIDS (Fig. 5), suggesting that IL-13 stimulated a DIDS-insensitive Cl− channel, possibly the CFTR. This was confirmed as the CFTR inhibitor completely abrogated the IL-13-induced Cl− ion conductance (Fig. 5). Collectively, these studies indicate that IL-13 regulates Baso → Ap Cl− ion secretion via the CFTR Cl− channel. To assess whether IL-13 may signal through the IL-13R type I (IL-4Rα/IL-13Rα1) or type II (IL-13Rα1/IL-13Rα2) pathways, we examined the expression of IL-13 receptors in CaCo2bbe cells. PCR analyses revealed that CaCo2bbe cells express IL-4Rα, IL-13Rα1, and IL-13Rα2 subunit mRNA (results not shown). Levels of IL-4Rα, IL-13Rα1, and IL-13Rα2 subunit mRNA expression was not effected by IL-13 stimulation (results not shown). These data indicate that IL-13 induced CFTR-dependent Cl− secretion and that this could occur via the type I (IL-4Rα/IL-13Rα1) and/or type II (IL-13Rα1/IL-13Rα2) IL-13 receptor pathways.
FIGURE 5.
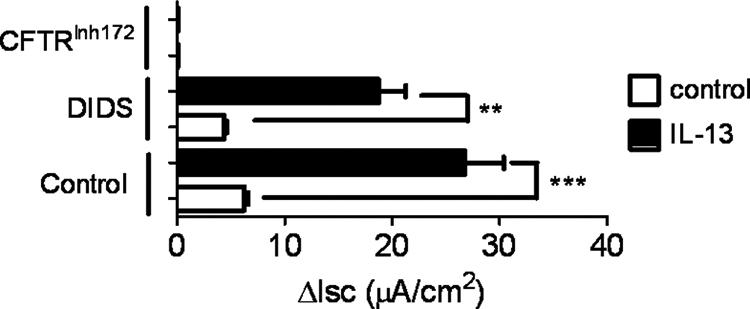
IL-13-induced Cl− conductance in intestinal epithelial cells is CFTR-dependent. ΔIsc of control- and IL-13-stimulated CaCo2bbe cells following basolateral addition of DIDS (20 μm) or the CFTR inhibitor (CFTRInh172). The figure is representative of n = 3 cultures per group from three separate experiments. Values represent mean ± S.E. Statistical significance is as follows: **, p < 0.05, and ***, p < 0.01.
IL-13 Regulation of Intestinal Epithelial Cl− Secretion in iIL-13Tg Mice
To assess ex vivo whether the significant increase in the jejunal Isc in iIL-13Tg was mediated via CFTR Cl− channel activity, we performed ex vivo analyses on small bowel intestinal segments from WT and iIL-13Tg mice (Fig. 6). The forskolin-induced ΔIsc response in jejunal segments from iIL-13Tg mice was elevated compared with WT mice. Luminal administration of DIDS reduced the forskolin-induced ΔIsc response of jejunal segments from iIL-13Tg mice compared with forskolin alone; however, the forskolin-induced ΔIsc response in the iIL-13Tg jejunal segment was significantly elevated compared with WT (Fig. 6). In contrast, exposure of the apical membrane to the CFTR Cl− channel antagonist CFTRinh172 nearly abrogated the IL-13-enhanced, forskolin-induced ΔIsc response (Fig. 6), making it nearly comparable with that of WT mice, suggesting that IL-13 increases Cl− secretion primarily via CFTR-dependent mechanism.
FIGURE 6.
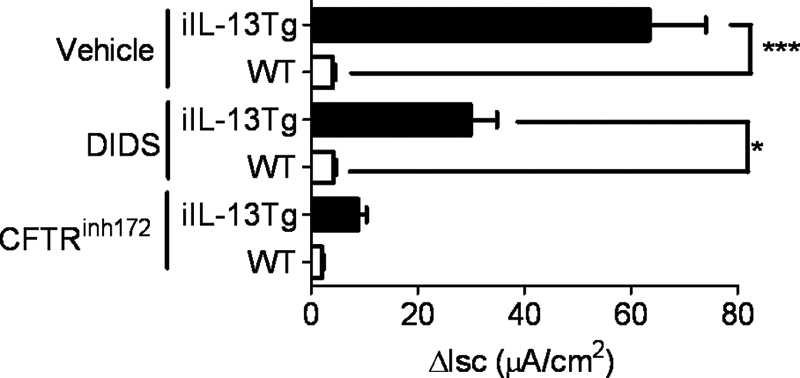
Increased Cl− conductance in iIL-13Tg mice is CFTR-dependent. Forskolin-induced ΔIsc of isolated segments of jejunum from WT and iIL-13Tg following basolateral exposure to DIDS (100 μm) or the CFTR inhibitor (CFTRInh172) (20 μm). The figure is representative of n = 3 isolated jejunal segments per group from two separate experiments. Values represent mean ± S.E. Statistical significance is as follows: *, p < 0.01 and ***, p < 0.005.
IL-13-induced Increase in CFTR Expression
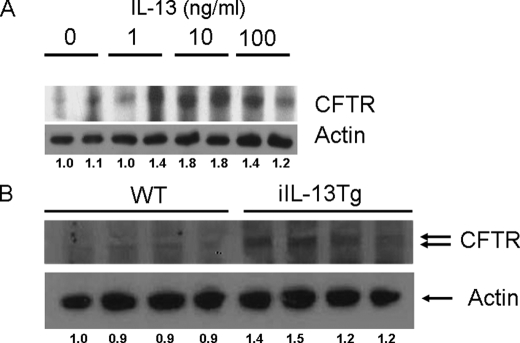
To assess if the IL-13-mediated up-regulation of Cl− secretion was associated with increased CFTR expression, we examined CFTR expression in CaCo2bbe cells by Western blot analyses. We show that 24-h stimulation of CaCo2bbe cells with IL-13 induced an increase in CFTR expression (Fig. 7A). Notably, IL-13-induced expression of CFTR was concentration-dependent (Fig. 7A). Consistent with this observation, CFTR expression in purified intestinal epithelial cells from iIL-13Tg mice was elevated compared with WT mice (Fig. 7B). These analyses suggest that IL-13-induced Cl− secretion was associated with increased CFTR expression in intestinal epithelial cells.
FIGURE 7.
IL-13-up-regulated CFTR expression in the CaCo2bbe intestinal epithelial cell line and jejunum of iIL-13Tg mice. Western blot analysis of protein lysates probing for CFTR and actin from control- and IL-13-stimulated intestinal epithelial cell CaCo2bbe cells (A) and jejunum segments from WT and iIL-13Tg mice (B). B, each lane represents an individual mouse. The figure is representative of duplicate experiments.
IL-13-induced Paracellular Intestinal Epithelial Permeability
We demonstrated that basolateral treatment with bumetanide or Cl− substitution by sodium gluconate diminished the IL-13-induced Isc response in CaCo2bbe cells (Fig. 4, F and G), however, this treatment had no effect on Cl− conductance, suggesting a paracellular contribution to the altered barrier response (bumetanide; ΔG control 0.2 ± 0.2 versus iIL-13-stimulated 5.6 ± 1.9 mS·cm2; mean ± S.D.; p < 0.01; sodium gluconate; ΔG control 0.05 ± 0.1 versus iIL-13-stimulated 7.8 ± 4.4 mS·cm2; mean ± S.D.; p < 0.05). To test whether IL-13 induced an increase in paracellular permeability, we assessed the Baso → Ap flux of the macromolecule FITC-dextran (4 kDa) across IL-13-stimulated CaCo2bbe cells and the jejunum of WT and iIL-13Tg mice. FITC-dextran flux was significantly higher in the IL-13-stimulated CaCo2bbe cells compared with control-treated cells (results not shown). Furthermore, Baso → Ap flux of FITC-dextran across intestinal segments was increased in iIL-13Tg mice compared with the WT mice (supplemental Fig. S2A), indicating that IL-13 induced an increase in paracellular intestinal epithelial permeability.
Contribution of IL-13Rα1- and IL-13Rα2- to IL-13-induced Intestinal Epithelial Architecture and Barrier Function
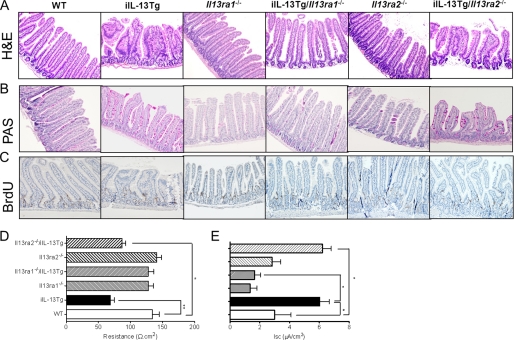
To decipher the involvement of IL-13Rα1 and IL-13Rα2 in the IL-13-induced effects on intestinal epithelial function, we backcrossed the iIL-13Tg mice onto the Il13ra1−/− and Il13ra2−/− backgrounds. Notably, IL-13Rα2 deficiency had no effect on IL-13-mediated intestinal epithelial architecture (villus blunting and reduced villus/crypt ratio), proliferation, and migration (Fig. 8, A–C). Furthermore, we observed no reduction in IL-13-mediated Cl− secretion and paracellular FITC-dextran flux in the absence of IL-13Rα2 (Fig. 8, D and E, and supplemental Fig. S2B). In contrast, deletion of IL-13Rα1 abrogated IL-13-mediated effects. Moreover, altered intestinal epithelial architecture and proliferation (Fig. 8, A–C) and epithelial Cl− secretion and paracellular FITC-dextran flux in the iIL-13Tg/Il13ra1−/− mice (Fig. 8, D and E, and supplemental Fig. S2B) were equivalent to those in the Il13ra1−/− and WT mice. Collectively, these studies indicate that IL-13 effects on the intestinal epithelium are primarily mediated through the type I IL-13 receptor (IL-4Rα/IL-13Rα1).
FIGURE 8.
IL-13-induced effects on intestinal epithelial morphology and epithelial barrier function are dependent on IL-13Rα1. Representative photomicrographs of H&E stained (A), PAS-stained (B), and BrdU-stained (C) jejunum from WT (BALB/c), iIL-13Tg, IL13ra1−/−, IL13ra2−/−, iIL-13Tg/IL13ra1−/−, and iIL-13Tg/IL-13ra2−/− mice. Endoplasmic reticulum (D) and forskolin-induced (E) ΔIsc of jejunum WT, iIL-13, IL13ra1−/−, IL13ra2−/−, iIL-13Tg/IL13ra1−/−, and iIL-13Tg/IL-13ra2−/− mice are shown. Values represent mean ± S.E.; n = 5 mice per group from duplicate experiments. Statistical significance is as follows: D and E, *, p < 0.01 versus WT. **, p < 0.01 versus WT.
Contribution of STAT-6 to IL-13-induced Intestinal Epithelial Architecture and Barrier Function
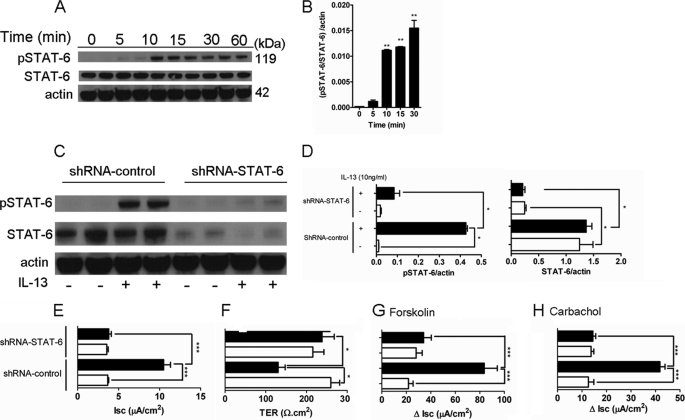
Previous studies have demonstrated both STAT-6 and phosphoinositide 3-kinase (PI3K) activation in intestinal epithelial cells following IL-13 stimulation (6, 36, 37). To assess the relative contribution of STAT-6 to the observed IL-13-mediated effects on Cl− secretion, we initially assessed STAT-6 activation in CaCo2bbe cells following IL-13 stimulation. We demonstrate significantly increased STAT-6 activation in CaCo2bbe cells within 10 min of IL-13 stimulation before reaching maximal levels by 30 min (Fig. 9, A and B). To assess the importance of STAT-6 activation in IL-13-induced effects on intestinal epithelial function, we examined TER and Isc in CaCo2bbe cells transduced with either control shRNA or STAT-6-shRNA lentiviral particles. We show that STAT-6-shRNA transduction of CaCo2bbe cells significantly reduced total and IL-13-induced STAT-6 activation (Fig. 9, C and D). Notably, knockdown of STAT-6 activity abrogated the IL-13-induced decrease in TER and increased basal Isc and also forskolin- and carbachol-induced ΔIsc (Fig. 9, E–H).
FIGURE 9.
IL-13-induced intestinal epithelial barrier dysfunction and CFTR expression are dependent on STAT-6. A, representative Western blot analyses probing for phosphorylated (pSTAT-6) and total STAT-6 (STAT-6) and actin in protein lysates from intestinal epithelial CaCo2bbe cells 0–30 min following 10 units/ml IL-13 stimulation. B, quantification of pSTAT-6/STAT-6/actin ratios in lysates from intestinal epithelial CaCo2bbe cells 0–30 min following 10 units/ml IL-13 stimulation. C, representative Western blot analyses probing for phosphorylated (pSTAT-6) and total STAT-6 (STAT-6) and actin in protein lysates from shRNA control- or shRNA-STAT-6-transduced CaCo2bbe cells following 15 min of stimulation with 10 ng/ml IL-13 (+) or control treatment (−). D, quantification of pSTAT6/actin and STAT6/actin ratios in protein lysates from shRNA-control- or shRNA-STAT-6-transduced CaCo2bbe cells following 15 min of stimulation with 10 ng/ml IL-13. Isc (E), TER (F), forskolin-induced (G), and acetylcholine-induced (H) ΔIsc of shRNA control- or shRNA-STAT-6-transduced CaCo2bbe cells following 24 h of stimulation with 10 ng/ml IL-13 is shown. Statistical significance is as follows: B, **, p < 0.01 versus control (0 min). D, *, p < 0.05. B and D, values represent mean ± S.E.; n = 3 separate experiments. E–H, values represent mean ± S.E.; n = 3–6 mice per group. Statistical significance is as follows: *, p < 0.05, and ***, p < 0.005.
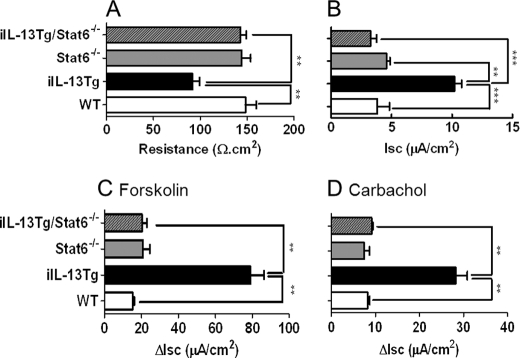
To determine whether the in vivo effects of IL-13 on epithelial barrier function were dependent on STAT-6, we backcrossed iIL-13Tg mice onto the Stat6−/− background. We show that the IL-13-mediated decrease in resistance and increase in basal Isc and also forskolin- and carbachol-induced ΔIsc were abrogated in iIL-13Tg/Stat6−/− mice compared with iIL-13Tg/Stat6+/+ mice (Fig. 10). These studies indicate that in vitro and in vivo effects of IL-13 on intestinal epithelial function are STAT-6-dependent.
FIGURE 10.
IL-13-induced effects on intestinal epithelial barrier function are dependent on STAT-6. TER (A), and Isc (B), and , forskolin-induced (C) and carbachol-induced (D) ΔIsc of jejunum WT, iIL-13Tg, Stat6−/−, and iIL-13Tg/Stat6−/− mice. Values represent mean ± S.E.; n = 4 mice per group from duplicate experiments. Statistical significance is as follows: A, **, p < 0.01 versus WT. ***, p < 0.01 versus WT.
DISCUSSION
To assess the effects of IL-13 on intestine function in vivo, we generated a mouse that constitutively expressed IL-13 in the small bowel. We observed that constitutive overexpression of IL-13 in the intestinal epithelial cells induced an alteration in epithelial architecture, including shortening of the villus, goblet cell hyperplasia, and mucus hypersecretion, and increased epithelial proliferation and epithelial function (Cl− secretion). Notably, IL-13-induced Cl− secretion was CFTR-dependent and associated with increased expression of CFTR. Finally, we demonstrate that the IL-13-mediated epithelial architectural and functional effects were dependent on the IL-4Rα/IL-13Rα1/STAT-6 signaling pathway but were IL-13Rα2-independent.
Intestinal expression of IL-13 in the small bowel epithelium induced intestinal epithelial remodeling, including goblet cell hyperplasia. This finding is consistent with previous studies demonstrating that overexpression of IL-13 in the pulmonary compartment induces mucus hypersecretion (38–40). Goblet cell differentiation in both the lung and intestine is thought to be regulated by the sterile α-motif-pointed domain-containing Ets-like factor (SPEDF) (41–43). Employing the lung-specific inducible IL-13 transgenic mice CCSP-rtTA/tet0-CMV-IL-13, investigators demonstrated that pulmonary IL-13-induced goblet cell hyperplasia is associated with induction of SPDEF expression (44). Notably, investigators showed that IL-13-induced pulmonary SPDEF induction and goblet cell hyperplasia were STAT-6-dependent and primarily type I IL-13R-dependent (IL-4Rα/IL-13Rα1). We assessed the level of SPDEF in the jejunum of WT and iIL-13Tg mice and demonstrated increased number of SPEDF+ epithelial cells in the jejunum of iIL-13Tg mice compared with WT mice (supplemental Fig. S3). Furthermore, we demonstrated that the effects of IL-13 on intestinal epithelial cell proliferation and goblet cell hyperplasia were dependent on IL-13Rα1 and not IL-13Rα2, indicating that IL-13/IL-13Rα1-dependent pathways drive epithelial proliferation and goblet cell hyperplasia in the small intestine.
Previous studies have implicated a role for IL-13 in intestinal epithelial cell migration (45). Moreover, Trichuris muris infestation of BALB/c mice increased intestinal epithelial turnover and rate of epithelial cell movement in the colon. We did not observe altered intestinal epithelial cell migration along the villus-crypt axis or epithelial apoptosis in the jejunum of iIL-13Tg mice. A likely explanation for the observed differences between our studies and the previous report is the involvement of the T. muris-induced intestinal inflammatory reaction. T. muris infestation induces a pronounced Th1/Th2 immune response characterized by elevated cytokines, including IFNγ, IL-4, and IL-13 and chemokines (CXCL10), which can act independently or in synergy to regulate intestinal epithelial function. Indeed, Cliffe et al. (45) demonstrated that T. muris infestation-induced epithelial turnover observed in BALB/c mice was regulated by IL-13 and CXCL10. Previous studies employing a dextran sodium sulfate model of colitis have demonstrated a role for CXCL10 in intestinal epithelial cell turnover (46).
Experimental investigations in mice have demonstrated a critical role for IL-13 in pulmonary and intestinal fibrosis associated with chronic inflammation. Treatment of mice with bleomycin promotes IL-13-dependent pulmonary fibrosis (19), and inhibition of IL-13 activity ameliorates fibrosis associated with chronic trinitrobenzene sulfonic acid-induced colitis (47). Notably, pulmonary overexpression of IL-13 in the lung was sufficient to induce pulmonary fibrosis (48). In contrast, we show that intestinal overexpression of IL-13 was not sufficient to promote intestinal fibrosis. The difference in the ability of IL-13 to induce fibrosis in the lungs as opposed to the gastrointestinal tract is not yet fully elucidated. IL-13-induced pulmonary, intestinal, and liver fibrosis is mediated by IL-13Rα1 and TGFβ1; however, the cellular source of TGFβ1 is not yet known. The lack of IL-13-induced fibrosis in the intestine of iIL-13Tg mice may be attributable to the absence of an intestinal IL-13-responsive TGFβ1+ cell population under homeostatic conditions. Alternatively, intestinal cells may not respond to TGFβ in the same manner as cells in other tissues.
In our in vivo analyses, we demonstrate that intestinal expression of IL-13 up-regulated Baso → Ap Cl− secretion. Increased Cl− secretion was primarily mediated by CFTR activity as Cl− secretion was DIDS-insensitive and was abrogated by CFTR inhibition. Consistent with this observation, forskolin-induced cAMP-mediated Cl− secretory capacity of intestinal epithelium from Cftr−/− mice is attenuated, and the mice die from intestinal obstruction at the time of birth or shortly after weaning (49). Notably, whereas CFTRInh172 abrogated Cl− secretion in CaCo2bbe cells, in ex vivo experiments we observed residual Cl− secretion in jejunal segments from WT and IL-13Tg mice. The differences between in vitro and ex vivo experiments may be attributed to epithelial cell heterogeneity observed in vivo; however, these studies indicate that homeostatic and IL-13-induced Cl− secretion in the small intestine can occur independently of CFTR activity.
We show, in vitro and in vivo, that IL-13-up-regulated CFTR-mediated Cl− secretion is linked with increased CFTR expression. IL-13 has recently been shown to modulate CFTR channel expression in airway epithelial cells (50). The effect of IL-13 on pulmonary CFTR expression is thought to be via dysregulation of the structural protein Ezrin. Ezrin is important for cell polarization and CFTR stabilization at the apical membrane of epithelial cells (51). We are currently assessing the involvement of IL-13 in the regulation of Ezrin in intestinal CFTR expression and function.
There have been a number of in vitro and in vivo studies employing multiple intestinal epithelial cell lines (HT-29/B6, T84, and CaCo2) and transgenic mice with intestinal epithelium-specific expression of constitutively active myosin light chain kinase, that define the effect of IL-13 on intestinal epithelial survival and barrier function (6, 7, 36, 37, 52, 53). Although these studies demonstrated IL-13-mediated decrease in intestinal epithelial resistance (TER) and barrier function, they provided conflicting reports with respect to the relative contribution of epithelial apoptosis, paracellular inorganic ion, and macromolecule flux and the tight junction Na+-selective pore claudin 2 to the IL-13-induced altered intestinal epithelial barrier function (6, 7, 36, 37, 52, 53).
There are a number of possible explanations for the observed mechanistic differences in the in vitro and in vivo studies. First, the paradoxical differences in vitro may have been due to heterogeneity within the epithelial cell lines (T84 versus HT-29/B6 versus CaCo2 cells). Weber et al. (37) demonstrated that IL-13 stimulation of T84 cells increased Na+/Cl− dilution potential ratio (PNa+/PCl−) and subsequently reduced TER. However, IL-13 had no effect on paracellular macromolecular flux (37). In contrast, we demonstrate increased paracellular macromolecular flux and subsequent reduction in TER in CaCo2bbe cells following IL-13 stimulation. Another potential factor that may explain the observed conflicting reports is the different intestinal epithelial cell maturation and differentiation states. Caco2 cells express claudin-2 early following passaging and during proliferation; however, this tight junction protein is subsequently down-regulated during differentiation (54). Consistent with this, Prasad et al. (36) observed decreased expression of claudin 2 and increased expression of claudin 3 and 4 over time and importantly demonstrated that these changes correlated with increased intestinal epithelial permeability. Finally, the observed differences in the in vivo analyses between Weber et al. (37) and our studies could have been due to different cellular source of IL-13 or alternatively altered hematopoietic cell function. Constitutively active myosin light chain kinase Tg mice had altered mucosal immune activation with increased numbers of lamina propria CD4+ lymphocytes, redistribution of CD11c+ cells, and increased production of IFNγ and TNFα, which have potent effects on intestinal epithelial barrier function (55). We did not observe any significant differences in B and T cell function in iIL-13Tg mice. Alternatively, this could have been a consequence of ectopic expression of IL-13 in intestinal epithelial cells.
The relative contribution of PI3K and STAT-6 signaling cascades to IL-13-mediated decrease in TER is also controversial (6, 36, 37, 53). Moreover, investigators have demonstrated a dependence for both STAT-6 and PI3K in IL-13-mediated effects on intestinal epithelial barrier function. However, as IL-13 activated both STAT-6 and PI3K signaling pathways in T84 cells (6), one must also consider that IL-13 stimulation of intestinal epithelial cells may lead to the concurrent activation of both the PI3K and STAT-6 pathways and that these pathways act in parallel but independently to modulate different mechanistic components of both paracellular (inorganic ion and macromolecule) and transcellular permeability leading to a common outcome of epithelial barrier dysfunction. Moreover, IL-13 activation of PI3K promotes increased claudin 2 expression, leading to subsequent increased inorganic ion (Na+) paracellular permeability and, as a consequence, a reduction in TER. Concurrently, IL-13 stimulation of STAT-6 promotes increased macromolecular paracellular flux and CFTR activity leading to reduced TER. Consistent with this, investigators have demonstrated that blockade of the IL-13-PI3K-claudin 2 pathway by pharmacological inhibition or by claudin 2-targeted siRNA approaches only partially reconstituted the IL-13-mediated reduction in TER but had minimal effect on the elevated paracellular macromolecule permeability (37). Furthermore, we show that IL-13-STAT-6-dependent effects on intestinal epithelial barrier function occurred independently of epithelial cell apoptosis and claudin 2 involvement. Moreover, immunofluorescence and Western blot analyses assessing claudin 2 expression in the jejunum of WT and iIL-13Tg mice revealed no significant differences in localization or levels of claudin 2 in the small bowel of iIL-13Tg mice compared with WT mice (supplemental Fig. S4). In fact, we observed decreased claudin 2 mRNA expression in iIL-13Tg compared with WT (supplemental Table 2); however, we speculate that the decreased level of claudin 2 mRNA but not protein could possibly be a consequence of the architectural changes to the intestinal tissue, including modification of villus/crypt ratios. Claudin 2 expression is restricted to the tight junction of the crypt epithelium, and decreased numbers of crypts and crypt length in the iIL-13Tg mice could lead to reduced claudin 2 mRNA levels. Further investigation is required to define the relative importance of STAT-6 and PI3K in the regulation of the discrete components of IL-13-induced intestinal epithelial barrier function.
IL-13 signaling is regulated via the type I and type II IL-13R (23). IL-13 binding to the type I receptor (IL-4Rα/IL-13Rα1) leads to phosphorylation of insulin receptor substrate (IRS-2), JAK-1, and Tyk2 and activation of downstream STAT-6 and PI3K pathways. The type II receptor (IL-13Rα1/IL-13Rα2) binds IL-13 with high affinity via the IL-13Rα2 and is proposed to act as a decoy receptor that limits the activity of IL-13 (6). Studies indicate that IL-13 signals through this receptor in a STAT-6-independent, AP-1-dependent manner (19). Our in vivo analysis showed that IL-13-induced permeability was dependent on IL-13Rα1 and STAT-6 but not IL-13Rα2, indicating that IL-13 was signaling primarily through the type I receptor (IL-4Rα/IL-13Rα1). Consistent with these observations, we and others showed that IL-13 stimulation of human intestinal epithelial lines promoted activation of STAT-6 and PI3K activity (6, 7). Furthermore, blockade of the STAT-6 and PI3K pathway blocked IL-13-induced intestinal epithelial permeability (6).
IL-4 and IL-13 elicit a number of effector mechanisms that provide a comprehensive immune response against nematode parasites (1). IL-4/IL-13 stimulate isotype switching to IgE, mast cell development, increased sensitivity to mast cell-produced mediators, generation of M2 macrophages, goblet cell hyperplasia, RELMβ production, epithelial proliferation, and shedding of intraepithelial cells, intestinal smooth muscle contractility, and paracellular permeability (8, 27, 45, 57–61). IL-13 regulation of CFTR Cl− channel expression and Cl− secretion driving mucosal hydration and secretory diarrhea would be consistent with these functions.
The significance of IL-13 regulation of CFTR Cl− channel expression and Cl− secretion in inflammatory diarrheal diseases is not yet fully delineated. Inflammatory bowel disease-associated diarrhea is thought to be primarily driven by reduced sodium absorption as opposed to heightened Cl− secretion (62–64). Thus, it is not likely that IL-13-induced electrogenic Cl− secretion is the primary pathway involved in inflammatory bowel disease-associated diarrhea; however, the effect of increased CFTR Cl− secretion on Cl−/HCO3− exchanger-mediated Cl− reabsorption is unclear. Notably, diarrheal diseases of the small bowel, such as that observed in viral, bacterial and parasitic diseases and food allergy, are associated with secretory diarrhea that is thought to be driven by both Cl− secretion and sodium absorption (65, 66). Cholera toxin and heat-stable enterotoxin stimulate CFTR-mediated Cl− secretion (67, 68). Notably, the CFTR channel blocker crofelemer stimulates faster symptom resolution in patients with infectious diarrhea such as cholera (69). Furthermore, cryptosporidiosis and cholera infection have been associated with increased T-cell-derived IL-13 (56, 70). We speculate that IL-13 regulation of CFTR expression and activity would exacerbate Cl− and water secretion and diarrhea in cases of infectious diarrhea.
IL-13 is a cytokine that regulates multiple intestinal functions via regulation of hematopoietic and nonhematopoietic cells. We showed in vitro and in vivo that IL-13 regulated epithelial proliferation, architecture, and goblet cell hyperplasia, and CFTR chloride channel-mediated Cl− flux and that this effect of IL-13 was dependent on the type I IL-13R/STAT-6 pathway. Our results identify an IL-13-regulated pathway that may have an important role in the Th2 immunity-induced secretory diarrhea.
Acknowledgments
We thank Pablo Abonia, Nives Zimmermann, and Ariel Munitz for helpful discussions; Helen Taylor and Wayne Damcevski for expert technical support in generating the iIL-13Tg mice; and Shawna Hottinger for editorial support.
This work was supported, in whole or in part, by National Institutes of Health Grant R01AI073553-01 (to S. P. H.). This work was also supported by a Department of Veterans Affairs merit award (to F. D. F.) and the American Heart Foundation Midwest Affiliate and Food Allergy and Anaphylaxis Network (to S. P. H.).

The on-line version of this article (available at http://www.jbc.org) contains supplemental Tables 1–3 and Figs. S1–S4.
- CFTR
- cystic fibrosis transmembrane conductance regulator
- BisTris
- 2-[bis(2-hydroxyethyl)amino]-2-(hydroxymethyl)propane-1,3-diol
- PE
- phycoerythrin
- CMF-HBSS
- calcium- and magnesium-free Hanks; buffered saline solution
- DIDS
- 4,4-diisothiocyanatostilbene-2,2′-disulfonic acid
- Baso
- basolateral
- Ap
- apical
- mS
- millisiemens
- TER
- transepithelial resistance
- PAS
- periodic acid-Schiff
- SPDEF
- sterile α-motif-pointed domain containing ets transcription factor.
REFERENCES
- 1. Wynn T. A. (2003) Annu. Rev. Immunol. 21, 425–456 [DOI] [PubMed] [Google Scholar]
- 2. Mentink-Kane M. M., Wynn T. A. (2004) Immunol. Rev. 202, 191–202 [DOI] [PubMed] [Google Scholar]
- 3. Urban J. F., Jr., Noben-Trauth N., Donaldson D. D., Madden K. B., Morris S. C., Collins M., Finkelman F. D. (1998) Immunity 8, 255–264 [DOI] [PubMed] [Google Scholar]
- 4. Brandt E. B., Munitz A., Orekov T., Mingler M. K., McBride M., Finkelman F. D., Rothenberg M. E. (2009) J. Allergy Clin. Immunol. 123, 53–58 [DOI] [PMC free article] [PubMed] [Google Scholar]
- 5. Heller F., Fuss I. J., Nieuwenhuis E. E., Blumberg R. S., Strober W. (2002) Immunity 17, 629–638 [DOI] [PubMed] [Google Scholar]
- 6. Ceponis P. J., Botelho F., Richards C. D., McKay D. M. (2000) J. Biol. Chem. 275, 29132–29137 [DOI] [PubMed] [Google Scholar]
- 7. Heller F., Florian P., Bojarski C., Richter J., Christ M., Hillenbrand B., Mankertz J., Gitter A. H., Bürgel N., Fromm M., Zeitz M., Fuss I., Strober W., Schulzke J. D. (2005) Gastroenterology 129, 550–564 [DOI] [PubMed] [Google Scholar]
- 8. Zhao A., McDermott J., Urban J. F., Jr., Gause W., Madden K. B., Yeung K. A., Morris S. C., Finkelman F. D., Shea-Donohue T. (2003) J. Immunol. 171, 948–954 [DOI] [PubMed] [Google Scholar]
- 9. Akiho H., Blennerhassett P., Deng Y., Collins S. M. (2002) Am. J. Physiol. Gastrointest. Liver Physiol. 282, G226–G232 [DOI] [PubMed] [Google Scholar]
- 10. Akiho H., Deng Y., Blennerhassett P., Kanbayashi H., Collins S. M. (2005) Gastroenterology 129, 131–141 [DOI] [PubMed] [Google Scholar]
- 11. Zhao A., Urban J. F., Jr., Anthony R. M., Sun R., Stiltz J., van Rooijen N., Wynn T. A., Gause W. C., Shea-Donohue T. (2008) Gastroenterology 135, 217–225 [DOI] [PMC free article] [PubMed] [Google Scholar]
- 12. Finkelman F. D., Hogan S. P., Hershey G. K., Rothenberg M. E., Wills-Karp M. (2010) J. Immunol. 184, 1663–1674 [DOI] [PMC free article] [PubMed] [Google Scholar]
- 13. Zurawski S. M., Chomarat P., Djossou O., Bidaud C., McKenzie A. N., Miossec P., Banchereau J., Zurawski G. (1995) J. Biol. Chem. 270, 13869–13878 [DOI] [PubMed] [Google Scholar]
- 14. Murata T., Husain S. R., Mohri H., Puri R. K. (1998) Int. Immunol. 10, 1103–1110 [DOI] [PubMed] [Google Scholar]
- 15. Donaldson D. D., Whitters M. J., Fitz L. J., Neben T. Y., Finnerty H., Henderson S. L., O'Hara R. M., Jr., Beier D. R., Turner K. J., Wood C. R., Collins M. (1998) J. Immunol. 161, 2317–2324 [PubMed] [Google Scholar]
- 16. Kellner J., Gamarra F., Welsch U., Jörres R. A., Huber R. M., Bergner A. (2007) Int. Arch. Allergy Immunol. 142, 199–210 [DOI] [PubMed] [Google Scholar]
- 17. Chiaramonte M. G., Donaldson D. D., Cheever A. W., Wynn T. A. (1999) J. Clin. Invest. 104, 777–785 [DOI] [PMC free article] [PubMed] [Google Scholar]
- 18. Chiaramonte M. G., Mentink-Kane M., Jacobson B. A., Cheever A. W., Whitters M. J., Goad M. E., Wong A., Collins M., Donaldson D. D., Grusby M. J., Wynn T. A. (2003) J. Exp. Med. 197, 687–701 [DOI] [PMC free article] [PubMed] [Google Scholar]
- 19. Fichtner-Feigl S., Strober W., Kawakami K., Puri R. K., Kitani A. (2006) Nat. Med. 12, 99–106 [DOI] [PubMed] [Google Scholar]
- 20. Munitz A., Brandt E. B., Mingler M., Finkelman F. D., Rothenberg M. E. (2008) Proc. Natl. Acad. Sci. U.S.A. 105, 7240–7245 [DOI] [PMC free article] [PubMed] [Google Scholar]
- 21. Groschwitz K. R., Ahrens R., Osterfeld H., Gurish M. F., Han X., Abrink M., Finkelman F. D., Pejler G., Hogan S. P. (2009) Proc. Natl. Acad. Sci. U.S.A. 106, 22381–22386 [DOI] [PMC free article] [PubMed] [Google Scholar]
- 22. Forbes E. E., Groschwitz K., Abonia J. P., Brandt E. B., Cohen E., Blanchard C., Ahrens R., Seidu L., McKenzie A., Strait R., Finkelman F. D., Foster P. S., Matthaei K. I., Rothenberg M. E., Hogan S. P. (2008) J. Exp. Med. 205, 897–913 [DOI] [PMC free article] [PubMed] [Google Scholar]
- 23. Hershey G. K. (2003) J. Allergy Clin. Immunol. 111, 677–690 [DOI] [PubMed] [Google Scholar]
- 24. Wood N., Whitters M. J., Jacobson B. A., Witek J., Sypek J. P., Kasaian M., Eppihimer M. J., Unger M., Tanaka T., Goldman S. J., Collins M., Donaldson D. D., Grusby M. J. (2003) J. Exp. Med. 197, 703–709 [DOI] [PMC free article] [PubMed] [Google Scholar]
- 25. Khodoun M., Lewis C. C., Lewis C., Yang J. Q., Orekov T., Potter C., Wynn T., Mentink-Kane M., Hershey G. K., Wills-Karp M., Finkelman F. D. (2007) J. Immunol. 179, 6429–6438 [DOI] [PubMed] [Google Scholar]
- 26. Zheng T., Zhu Z., Liu W., Lee C. G., Chen Q., Homer R. J., Elias J. A. (2003) J. Allergy Clin. Immunol. 111, 720–728 [DOI] [PubMed] [Google Scholar]
- 27. Madden K. B., Whitman L., Sullivan C., Gause W. C., Urban J. F., Jr., Katona I. M., Finkelman F. D., Shea-Donohue T. (2002) J. Immunol. 169, 4417–4422 [DOI] [PubMed] [Google Scholar]
- 28. Grasset E., Pinto M., Dussaulx E., Zweibaum A., Desjeux J. F. (1984) Am. J. Physiol. 247, C260–267 [DOI] [PubMed] [Google Scholar]
- 29. Grubb B. R. (1995) Am. J. Physiol. 268, G505–G513 [DOI] [PubMed] [Google Scholar]
- 30. Anderson M. P., Sheppard D. N., Berger H. A., Welsh M. J. (1992) Am. J. Physiol. 263, L1–L14 [DOI] [PubMed] [Google Scholar]
- 31. Clarke L. L., Grubb B. R., Yankaskas J. R., Cotton C. U., McKenzie A., Boucher R. C. (1994) Proc. Natl. Acad. Sci. U.S.A. 91, 479–483 [DOI] [PMC free article] [PubMed] [Google Scholar]
- 32. Gazitúa S., Robinson J. W. (1982) Pflugers Arch. 394, 32–37 [DOI] [PubMed] [Google Scholar]
- 33. Venglarik C. J., Bridges R. J., Frizzell R. A. (1990) Am. J. Physiol. 259, C358–C364 [DOI] [PubMed] [Google Scholar]
- 34. Gyömörey K., Garami E., Galley K., Rommens J. M., Bear C. E. (2001) Pflugers Arch. 443, S103–S106 [DOI] [PubMed] [Google Scholar]
- 35. Kartner N., Hanrahan J. W., Jensen T. J., Naismith A. L., Sun S. Z., Ackerley C. A., Reyes E. F., Tsui L. C., Rommens J. M., Bear C. E. (1991) Cell 64, 681–691 [DOI] [PubMed] [Google Scholar]
- 36. Prasad S., Mingrino R., Kaukinen K., Hayes K. L., Powell R. M., MacDonald T. T., Collins J. E. (2005) Lab. Invest. 85, 1139–1162 [DOI] [PubMed] [Google Scholar]
- 37. Weber C. R., Raleigh D. R., Su L., Shen L., Sullivan E. A., Wang Y., Turner J. R. (2010) J. Biol. Chem. 285, 12037–12046 [DOI] [PMC free article] [PubMed] [Google Scholar]
- 38. Zheng T., Zhu Z., Wang Z., Homer R. J., Ma B., Riese R. J., Jr., Chapman H. A., Jr., Shapiro S. D., Elias J. A. (2000) J. Clin. Invest. 106, 1081–1093 [DOI] [PMC free article] [PubMed] [Google Scholar]
- 39. Zhu Z., Homer R. J., Wang Z., Chen Q., Geba G. P., Wang J., Zhang Y., Elias J. A. (1999) J. Clin. Invest. 103, 779–788 [DOI] [PMC free article] [PubMed] [Google Scholar]
- 40. Fulkerson P. C., Fischetti C. A., Hassman L. M., Nikolaidis N. M., Rothenberg M. E. (2006) Am. J. Respir. Cell Mol. Biol. 35, 337–346 [DOI] [PMC free article] [PubMed] [Google Scholar]
- 41. Chen G., Korfhagen T. R., Xu Y., Kitzmiller J., Wert S. E., Maeda Y., Gregorieff A., Clevers H., Whitsett J. A. (2009) J. Clin. Invest. 119, 2914–2924 [DOI] [PMC free article] [PubMed] [Google Scholar]
- 42. Gregorieff A., Stange D. E., Kujala P., Begthel H., van den Born M., Korving J., Peters P. J., Clevers H. (2009) Gastroenterology 137, 1333–1345 [DOI] [PubMed] [Google Scholar]
- 43. Noah T. K., Kazanjian A., Whitsett J. A., Shroyer N. F. (2010) Exp. Cell Res. 316, 452–465 [DOI] [PMC free article] [PubMed] [Google Scholar]
- 44. Park K. S., Korfhagen T. R., Bruno M. D., Kitzmiller J. A., Wan H., Wert S. E., Khurana Hershey G. K., Chen G., Whitsett J. A. (2007) J. Clin. Invest. 117, 978–988 [DOI] [PMC free article] [PubMed] [Google Scholar]
- 45. Cliffe L. J., Humphreys N. E., Lane T. E., Potten C. S., Booth C., Grencis R. K. (2005) Science 308, 1463–1465 [DOI] [PubMed] [Google Scholar]
- 46. Sasaki S., Yoneyama H., Suzuki K., Suriki H., Aiba T., Watanabe S., Kawauchi Y., Kawachi H., Shimizu F., Matsushima K., Asakura H., Narumi S. (2002) Eur. J. Immunol. 32, 3197–3205 [DOI] [PubMed] [Google Scholar]
- 47. Fichtner-Feigl S., Young C. A., Kitani A., Geissler E. K., Schlitt H. J., Strober W. (2008) Gastroenterology 135, 2003–2013 [DOI] [PubMed] [Google Scholar]
- 48. Lee C. G., Homer R. J., Zhu Z., Lanone S., Wang X., Koteliansky V., Shipley J. M., Gotwals P., Noble P., Chen Q., Senior R. M., Elias J. A. (2001) J. Exp. Med. 194, 809–821 [DOI] [PMC free article] [PubMed] [Google Scholar]
- 49. Clarke L. L., Grubb B. R., Gabriel S. E., Smithies O., Koller B. H., Boucher R. C. (1992) Science 257, 1125–1128 [DOI] [PubMed] [Google Scholar]
- 50. Skowron-zwarg M., Boland S., Caruso N., Coraux C., Marano F., Tournier F. (2007) Exp. Cell Res. 313, 2695–2702 [DOI] [PubMed] [Google Scholar]
- 51. Moyer B. D., Denton J., Karlson K. H., Reynolds D., Wang S., Mickle J. E., Milewski M., Cutting G. R., Guggino W. B., Li M., Stanton B. A. (1999) J. Clin. Invest. 104, 1353–1361 [DOI] [PMC free article] [PubMed] [Google Scholar]
- 52. Heller F., Fromm A., Gitter A. H., Mankertz J., Schulzke J. D. (2008) Mucosal Immunol. 1, S58–S61 [DOI] [PubMed] [Google Scholar]
- 53. Zünd G., Madara J. L., Dzus A. L., Awtrey C. S., Colgan S. P. (1996) J. Biol. Chem. 271, 7460–7464 [DOI] [PubMed] [Google Scholar]
- 54. Escaffit F., Boudreau F., Beaulieu J. F. (2005) J. Cell. Physiol. 203, 15–26 [DOI] [PubMed] [Google Scholar]
- 55. Su L., Shen L., Clayburgh D. R., Nalle S. C., Sullivan E. A., Meddings J. B., Abraham C., Turner J. R. (2009) Gastroenterology 136, 551–563 [DOI] [PMC free article] [PubMed] [Google Scholar]
- 56. Bhuiyan T. R., Lundin S. B., Khan A. I., Lundgren A., Harris J. B., Calderwood S. B., Qadri F. (2009) Infect. Immun. 77, 1888–1893 [DOI] [PMC free article] [PubMed] [Google Scholar]
- 57. Strait R. T., Morris S. C., Smiley K., Urban J. F., Jr., Finkelman F. D. (2003) J. Immunol. 170, 3835–3842 [DOI] [PubMed] [Google Scholar]
- 58. Herbert D. R., Hölscher C., Mohrs M., Arendse B., Schwegmann A., Radwanska M., Leeto M., Kirsch R., Hall P., Mossmann H., Claussen B., Förster I., Brombacher F. (2004) Immunity 20, 623–635 [DOI] [PubMed] [Google Scholar]
- 59. Herbert D. R., Yang J. Q., Hogan S. P., Groschwitz K., Khodoun M., Munitz A., Orekov T., Perkins C., Wang Q., Brombacher F., Urban J. F., Jr., Rothenberg M. E., Finkelman F. D. (2009) J. Exp. Med 206, 2947–2957 [DOI] [PMC free article] [PubMed] [Google Scholar]
- 60. Anthony R. M., Urban J. F., Jr., Alem F., Hamed H. A., Rozo C. T., Boucher J. L., Van Rooijen N., Gause W. C. (2006) Nat. Med. 12, 955–960 [DOI] [PMC free article] [PubMed] [Google Scholar]
- 61. Horsnell W. G., Cutler A. J., Hoving J. C., Hoving C. J., Mearns H., Myburgh E., Arendse B., Finkelman F. D., Owens G. K., Erle D., Brombacher F. (2007) PLoS Pathog. 3, e1. [DOI] [PMC free article] [PubMed] [Google Scholar]
- 62. Hawker P. C., McKay J. S., Turnberg L. A. (1980) Gastroenterology 79, 508–511 [PubMed] [Google Scholar]
- 63. Sandle G. I., Hayslett J. P., Binder H. J. (1986) Gut 27, 309–316 [DOI] [PMC free article] [PubMed] [Google Scholar]
- 64. Amasheh S., Barmeyer C., Koch C. S., Tavalali S., Mankertz J., Epple H. J., Gehring M. M., Florian P., Kroesen A. J., Zeitz M., Fromm M., Schulzke J. D. (2004) Gastroenterology 126, 1711–1720 [DOI] [PubMed] [Google Scholar]
- 65. Surawicz C. M. (2010) Curr. Gastroenterol. Rep. 12, 236–241 [DOI] [PubMed] [Google Scholar]
- 66. Pawlowski S. W., Warren C. A., Guerrant R. (2009) Gastroenterology 136, 1874–1886 [DOI] [PMC free article] [PubMed] [Google Scholar]
- 67. Chao A. C., de Sauvage F. J., Dong Y. J., Wagner J. A., Goeddel D. V., Gardner P. (1994) EMBO J. 13, 1065–1072 [DOI] [PMC free article] [PubMed] [Google Scholar]
- 68. Gabriel S. E., Brigman K. N., Koller B. H., Boucher R. C., Stutts M. J. (1994) Science 266, 107–109 [DOI] [PubMed] [Google Scholar]
- 69. Crutchley R. D., Miller J., Garey K. W. (2010) Ann. Pharmacother. 44, 878–884 [DOI] [PubMed] [Google Scholar]
- 70. Kirkpatrick B. D., Daniels M. M., Jean S. S., Pape J. W., Karp C., Littenberg B., Fitzgerald D. W., Lederman H. M., Nataro J. P., Sears C. L. (2002) J. Infect. Dis. 186, 94–101 [DOI] [PubMed] [Google Scholar]


