Abstract
Background and aim:
The current study utilized a carbon tetrachloride (CCl4)-induced liver fibrosis model to measure levels of the MMP9-mediated collagen type III degradation fragment CO3-610 (site of cleavage: KNGETGPQGP), during disease progression and regression, and to investigate a potential prognostic role of the biomarker.
Materials and methods:
72 female Sprague-Dawley rats aged 6 months old were injected with CCl4 twice a week over different periods of time to induce varying degrees of liver fibrosis. After 4, 6 and 8 weeks of treatment, administration of CCl4 was stopped. The 6- and 8-week treatment groups were left to regress for a further 6 or 12 weeks at which point they were sacrificed and livers removed and sectioned. Liver fibrosis was quantified using Visiopharm software to analyse Sirius red-stained sections. Serum levels of CO3-610 were measured in all animals using an ELISA assay as described by Barascuk et al.1
Results:
Quantitative histology revealed total collagen deposition in the liver increased as fibrosis progressed. In animals treated with CCl4 for 4 weeks, collagen comprised on average 4.94% of the total tissue in liver sections, while after 6 weeks the mean was 8.25%, and after 8 weeks, 9.11%. During the regression phase, the total collagen deposition gradually decreased to a mean of 6.9% and 5.09% for animals regressing 6 and 12 weeks respectively after 6 weeks treatment, and 6.27% for animals regressed 12 weeks after 8 weeks treatment. CO3-610 values increased progressively in rats treated for 4 weeks (by a mean of 55.0 ng/ml), 6 weeks (mean 61.1 ng/ml) and 8 weeks (mean 70.2 ng/ml). During the regression phase, CO3-610 values rapidly decreased by a mean of 28.9 ng/ml at 6 weeks and 21.6 ng/ml at 12 weeks in animals previously treated for 6 weeks, and by a mean of 19.52 ng/ml in animals treated for 8 weeks and regressed for 12 weeks. CO3-610 levels were statistically significantly correlated with total collagen during disease progression (r = 0.5701, P < 0.0001). No statistically significant correlation was observed during regression (r = 0.2081, P = 0.1138).
Conclusion:
Levels of the MMP-9 generated fragment of collagen type III, CO3-610, correlated with the degree of liver fibrosis in rats during the progression phase, but were not correlated with total collagen levels during regression. CO3-610 seems to be produced only under the CCL4 stimulus, and signifies CO3-610 as a potential marker of progression rather than regression. The corresponding steep elevations in levels of CO3-610 total collagen and collagen type III during liver fibrosis progression underline a potential prognostic capacity of the biomarker.
Keywords: fibrosis, biomarkers, liver, CO3-610, extracellular matrix, collagen, CCl4
Introduction
In liver fibrosis, the extensive formation within the organ of scars composed mainly of collagen and proteoglycans,1 which are both extracellular matrix (ECM) proteins, leads to chronic hepatic damage.2 Under normal physiological conditions, the ECM is degraded and reformed in a balanced way to maintain healthy tissue, but in fibrotic diseases, cancer and inflammation, an imbalance occurs in which ECM formation, particularly with collagen types I, III and IV, outstrips degradation. In fibrotic livers, for example, collagen levels have been found to be 6 times higher than in a healthy organ.2 ECM constituents accumulate as a result of the interaction between different receptors and mainly through integrins and lipids, and in the process activate hematopoietic stem cells (HSC), leading to fibrosis.3,4 Hepatic myofibroblasts (MF) also contribute to collagen deposition, mainly of collagen type I and III. However MFs seem to posses distinct and different properties in response to apoptotic stimuli and injury5,6 than HSC. Both MF and HSC generate metalloproteinases (MMPs) and tissue inhibitor of metalloproteinase I (TIMP-1) which can restrain collagenases and have anti-apoptotic activity on both MF and HSC. In addition, MF seem to play a role in liver regeneration.7 The end result of the collective MF and HSC action during sustained chronic injury is the deposition of increased amounts of scar tissue which in turn upsets the architecture, development and ultimately the function of liver.8
Collagens and other ECM molecules are degraded by MMPs, the expression of which may be increased in local, pathologically affected areas.9 MMP degradation of the ECM proteins generates specific cleavage fragments which in turn produce new epitopes. These neoepitopes may have potential utility as biomarkers of unbalanced ECM remodelling in a specific organ or in a specific disease. Collagen type III has been shown to be of particular value as a marker of collagen turnover10 with significance not only for liver fibrosis but other fibrosis-related diseases.11 Specifically, the N terminal propeptide (PIINP) of collagen type III has been proposed as a potentially valuable marker in liver fibrogenesis.12
Histopathological examination of biopsies is the traditional gold standard for diagnosing and staging fibrosis.13 Biopsy, however, has significant drawbacks. It is invasive and prone to sampling error due to variation in the length and size of the tissue specimen, which subsequently leads to low reproducibility and high intra-patient variation. Neoepitope-based biochemical markers found in urine and serum are receiving increased attention due to their promising diagnostic and prognostic potential.9 In slowly progressing diseases, such as osteoporosis and osteoarthritis, bone resorption and cartilage degradation markers in particular have been studied extensively.14
The aim of the current study was to measure levels of the MMP9-generated collagen type III degradation fragment, CO3-610, described by Barascuk,1,15 during both progression and regression of liver fibrosis and to investigate a potential prognostic role of the biomarker. We used a reversible model involving initial administration of carbon tetrachloride (CCl4), a hepatotoxin that causes acute liver injury and, when given repetitively at a low dose, induces liver fibrosis. This reversible model has been widely used in recent years to investigate liver regeneration after injury. A key benefit of the above model is its standardisation and increased reproducibility as it is not relying on an invasive surgical procedure such as the bile duct ligation model.
Materials and Methods
Animals
125 female Sprague-Dawley rats aged 6 months began the experiment and were housed in standard type III H cages with bedding and nest material at the animal research facilities at Nordic Bioscience, Beijing, China. The animals were kept in a 12-hour light/dark cycle, at a temperature of 22 °C ± 2 °C with relative humidity 50% ± 20%, and ventilated with filtered non-recycled air. Their diet consisted of standard food pellets and MilliQ water ad libitum for the entire test period. Experiments were performed according to the European Standard for Good Clinical Practice (2008/561-1450).
Study design
In 97 Sprague-Dawley rats, liver fibrosis was induced by i.p. administration twice a week of 0.5 mL/kg of a solution containing equal parts of CCl4 and intralipid. A further 28 animals were injected with intralipid alone (0.5 mL/kg, twice a week) and served as controls. The animals were divided into 4 groups: the vehicle group (n = 28); a group in which CCl4 treatment was continued until 8 weeks (n = 53); a third group in which CCl4 treatment was stopped after 6 weeks (n = 29) and the effects of regression were assessed 6 and 12 weeks later; and a final group in which CCl4 treatment was stopped after 8 weeks (n = 15) and animals regressed for 12 weeks. On completion of each study period, and following 14 hours of fasting, the animals were asphyxiated by carbon dioxide and sacrificed by exsanguinations.
Urine and serum sampling
Urine and serum samples were taken from animals which had fasted for at least the previous 14 hours overnight. Samples were collected at baseline and on the day of termination. Blood samples were taken from the retro-orbital sinus of the animals under light CO2/O2 anesthesia. Blood was collected in plain tubes and left at room temperature for 30 minutes to clot, then centrifuged at 1500 g for 10 minutes. All clot-free liquid was transferred to a new Eppendorf tube and centrifuged at 1500 g for 10 minutes. Serum was then transferred to a clean Eppendorf. Urine and serum were stored at −80 °C in labeled Eppendorf tubes.
Tissue handling
Immediately after termination, livers were carefully removed, weighed, fixed in 4% formaldehyde for a minimum of 24 hours, cut into slices and embedded in paraffin. 5 μm slices were cut, mounted on glass slides and stained with a combination of Sirius red and Alcian blue, according to the manufacturer’s instructions. A portion of each liver and lung was excised and stored at −80 °C for the extraction of protein.
Immunohistochemistry
The stained liver and lung samples were retained for an hour at 60 °C, then deparaffinized in toluene and rinsed twice in 99% ethanol for 5 minutes each. Samples were then blocked in a peroxidase block (1.05% H2O2 in 99% ethanol) for 10 minutes and rehydrated in 96% ethanol, then 70% ethanol, and tap water. This was followed by two cycles of immersion in a citrate buffer (pH 6) and heating for 5 minutes each time at 800 W in a microwave, after which the material was left to cool to room temperature. The samples were then washed in 0.1% Triton X-100 (Sigma Aldrich, T8787, St. Louis, Missouri, USA) twice for 5 minutes each and incubated for half an hour with 150–200 μL antibodies against collagen III (ab6310, Abcam, UK) diluted in 1% bovine serum albumin. Samples were again washed in 0.1% Triton X-100 (2 × 5 minutes) and incubated with 150–200 μL of Super Enhancer ( BioGener) for 20 minutes. This was followed by a further washing step in 0.1% Triton X-100 (2 × 5 minutes), after which samples were left to incubate for half an hour with 150–200 μL SS Label (polymer HRP—BioGener). Samples were subjected to further washing with Triton X-100 (2 × 5 minutes) and incubation under a cover in AEC (100 mL MilliQ water, 100 mL sodium-acetate buffer, 10 mL AEC stock, and 100 μL 30% H2O2) followed by rinsing in tap water for 5 minutes. Samples were finally counterstained with Mayer’s haematoxylin for 1 minute, rinsed in tap water for another 5 minutes, mounted with Kaiser’s glycerine jelly, covered and left to dry. All the incubations were performed in humid chambers.
Protein extractions
Liver tissue was pulverized in liquid nitrogen in a steel mortar. Tissue samples were transferred into a 1.5 ml Eppendorf tube and left shaking overnight at 4 °C in a 0.5 M acetic acid solution containing a protease inhibitor cocktail (Roche Diagnostics, Basel, Switzerland). The samples were then sonicated using 5 pulses at 60% amplitude (U50 control, IKA Labortechnik, Staufen, Germany), left for 2 hours gently shaking at 4 °C and centrifuged for 5 minutes at 13,000 rpm. The supernatant was carefully removed, transferred to a new labelled Eppendorf tube and stored at −80 °C.
Densitometry
Densitometry measurements were performed using UN-SCAN-IT Version 6.1 from Silk Scientific (Orem, Utah 84059, USA), according to the manufacturer’s guidelines.
Histology image analysis
Histology sections stained with Sirius Red were analysed using Visiopharm software Version 3.2.8.0 (Visiopharm, Hørsholm, Denmark). Images were acquired using Pixelink PL-A623C microscope digital camera (Pixelink, Ottawa, Canada).
SDS PAGE and Western blots
20 μg of tissue extract was mixed with loading buffer (Invitrogen LDS 4x, NP0007, Carlsbad, California, USA), containing reducing agent (NP0004, Invitrogen). Samples were loaded into 4%–12% Bis-Tris gradient gel (NP0332BOX, Invitrogen) and subjected to an electric current of 200 V for 52 minutes. Proteins were transferred onto a nitrocellulose membrane using the i-Blot transfer system (Invitrogen) and blocked with 5% skimmed milk in Tris buffered saline (TTBS) overnight at 4 °C. Beta-Actin antibody (AbCam ab8229, Cambridge, UK) was used as a loading control, collagen III (Abcam ab6310, UK) and CO3-610.
ELISA CO3-610 serum assay
Coating and assay buffers were equilibrated to room temperature. 100 μl of Bio CO3-610 (2.5 ng/ml) in 47 mM PBS-BTE was used to coat 96-well streptavidin plates (cat number 11940279, Roche Diagnostics, Hvidovre, Denmark) for 30 minutes at 20 °C on a 300 rpm shaker. Excess coater was removed by washing 5 times in standard washing buffer. 20 μl of each serum sample was diluted 8-fold in incubation buffer (50 mM TRIS-BTB). CO3-610 antibody was diluted 1:80 in incubation buffer, and 100 μl of the antibody solution was added to each well. Each well was sealed with tape and the plate incubated for 1 hour at 20 °C with shaking at 300 rpm. The plate was washed 5 times in washing buffer. 100 μl of TMB buffer (cat number 4380-100-125, Kem-En-Tec, Taastrup, Denmark) was then added, sealed with tape and incubated for 15 minutes in the dark, with shaking at 300 rpm. 100 μl of stopping solution was then added and the plate read in an ELISA reader (Molecular Devices, SpectraMax M, CA. USA) at 450 nm with 650 nm as reference.
Buffers used for ELISA
Buffer used for dissolving the coating peptide contained 47 mM PBS-BTE, 1 g KH2PO4, 14.5 g Na2HPO4, 0.2 g KCl, 8 g NaCl, 10 g BSA, 9.3 g EDTA, 1 g Tween-20, 100 g Sorbitol, 1000 ml Milli Q water. The incubation buffer comprised 6.055 g Trizma, 10 g BSA, 0.56 g Tween 20, 3.6 mL Bronidox, 30 mg Phenol red, 1000 ml Milli Q. The washing buffer consisted of 154.4 g Trizma, 149 g NaCl, 16.7 g Bronidox, 56.2 g Tween 20, 1000 ml Milli Q. The reaction-stopping buffer was composed of 0.1% H2SO4.
Standards
Standard curves were obtained from serial dilutions of biotinylated CO3-610 for the urine assay. Standard concentrations were 0, 0.33, 1, 3, 9, 27, 81 and 162 ng/ml.
Statistical analysis
Mean values and standard error of the mean (SEM) were calculated using GraphPad Prism (GraphPad Software, San Diego, CA, USA) and compared by Student’s two-tailed paired t-test (α = 0.05) or by Mann-Whitney two-tailed non-parametric test, whenever appropriate. One-way analysis of variance (ANOVA) was also used for group analysis across time points. The coefficient of correlation (R2) and the corresponding P-value was determined by linear regression. A P-value of 0.05 was considered statistically significant. CCl4-treated groups were compared with intralipid-treated groups at each termination time point.
Results
Available population for analysis
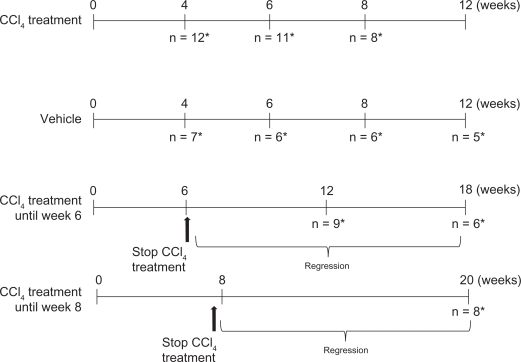
Due to several animals dying prior to scheduled termination points, the number included in the data analysis was reduced to 91 out of the original 125 animals. It was decided to stop CCL4 treatment after a maximum of 8 weeks in the group originally intended to undergo 12 weeks of treatment. Surviving animals from this group were redirected to other groups to provide adequate numbers for meaningful statistical analysis and to reduce mortalities (Table 1).
Table 1.
Study design outline. Final numbers per group were reduced due to mortalities.
Note:
Termination point.
Histology image analysis
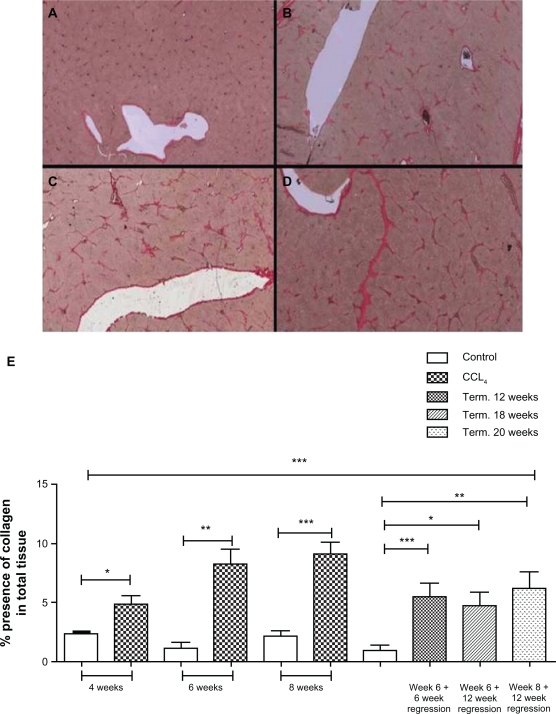
Liver sections stained with Sirius red revealed a significant increase in the presence of total collagen in animals treated with CCl4 (Fig. 1). Quantitative histology revealed that the proportion of total collagen contained in liver sections progressed from a mean of 4.94% at 4 weeks of treatment to a peak of 9.119% after 8 weeks of treatment. The mean proportion of total collagen in liver sections from intralipid-treated, control animals was 2.76%. Total collagen expressed as a percentage of the whole tissue sections did not decrease to a statistically significant degree between animals left to regress for 6 or 12 weeks.
Figure 1.
Total collagen increase during fibrosis progression and regression.
The mean extent of total collagen found in liver sections, stained with Sirius red, from control, intralipid-treated animals (A); in CC l4-treated animals after 4 weeks of treatment (B); in CCl4-treated animals after 6 weeks of treatment (C); and CCl4-treated animals after 8 weeks of treatment (D). Quantification by Visiopharm software of the amount of total collagen expressed as a % of whole tissue in liver sections, showed a statistically significant increase in CCL4-treated rats compared with intralipid-treated animals at the same time of termination, for 4 weeks of treatment (P = 0.0100), 6 weeks (mean 8.25%, P = 0.0025), 8 weeks (P = 0.0007). Animals treated with CCl4 for 6 weeks and left to regress for another 6 showed a significant increase during regression in the total collagen content in the liver compared with the equivalent intralipid-treated animals at the same time of termination (P = 0.0079). Equally significantly increased levels of collagen were seen in both the groups undergoing 12 weeks regression after 6 weeks treatment (P = 0.0087), and 12 weeks’ regression after 8 weeks’ treatment (P = 0.0117). Quantitative histology revealed increased total collagen deposition during disease progression for animals treated with CCl4 for 4 weeks (mean 4.94% presence), 6 weeks (mean 8.25% presence) and 8 weeks (mean 9.11% presence). During regression, the total collagen deposition was gradually decreased to a mean of 6.9% (P = 0.0010) and 5.09% (P = 0.0117) for animals regressing for 6 and 12 weeks respectively after 6 weeks’ treatment and to a mean of 6.27% (P = 0.0083) in animals regressed for 12 weeks after 8 weeks treatment (E).
Changes in CO3-610 levels
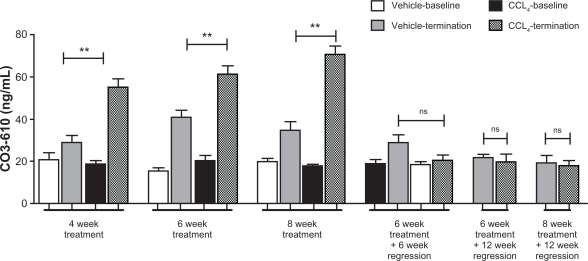
ELISA analysis of serum showed CCL4-treated rats had statistically significantly (P < 0.05) higher levels of the MMP9- generated fragment of type III collagen, CO3-610, than the corresponding intralipidtreated groups at the same time points during progression of liver fibrosis (Fig. 2). During the disease regression phase, CO3-610 levels declined rapidly, reaching the same levels as intralipid-treated animals from as early as 6 weeks of regression, with no statistically significant difference in CO3-610 levels being found between CCl4-treated and control groups at termination. A statistically significant decrease in mean CO3-610 levels was found at all regression points for animals treated for both 6 and 8 weeks (P < 0.05).
Figure 2.
CO3-610 levels during fibrosis regression and progression.
Mean CO3-610 values showed a progressive increase in rats treated for 4 weeks (55 ng/ml), 6 weeks (61.1 ng/ml) and 8 weeks (70.2 ng/ml). During the regression phase, mean CO3-610 values rapidly decreased after 6 weeks (28.9 ng/ml), 12 weeks (21.6 ng/ml) for animals treated for 6 weeks, and in animals treated for 8 weeks followed by 12 weeks’ regression (19.52 ng/ml).
Western blot and densitometry
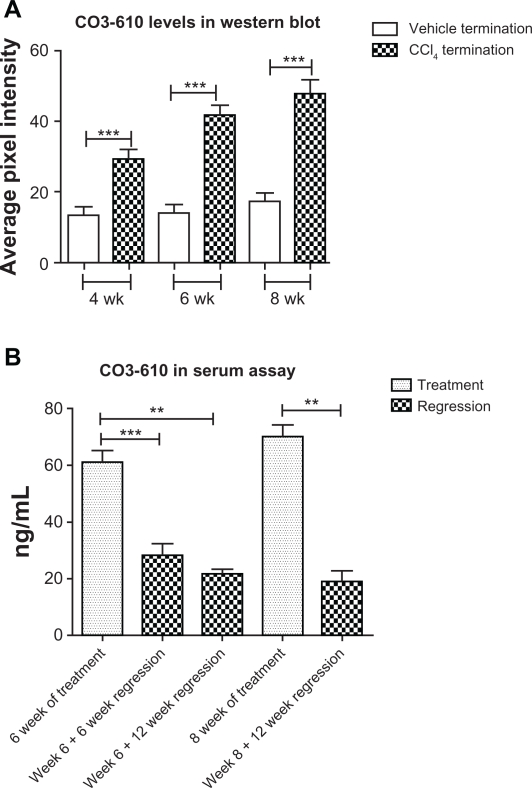
The above pattern was also observed in the densitometry data retrieved from Western blot. CO3-610 levels gradually increased from a mean value of 32.9 average pixel intensity (API) after 4 weeks ‘treatment to 41.6API (6 weeks’ treatment) to a final 47.6API after 8 weeks (Fig. 3A). During the regression phase, CO3-610 levels were significantly lowered. Animals left to regress for 6 (mean API 22.0, P = 0.0006) and 12 (mean API, 16.53, P = 0.0006) weeks after 6 weeks of CCl4 treatment had statistically significantly higher CO3-610 levels than values measured at the end of 6 weeks’ treatment. Animals left to regress for 12 weeks after 8 weeks of CCl4 treatment showed a statistically significant decrease in CO3-610 levels (mean API 29.3, P = 0.0012) (Fig. 3B).
Figure 3.
CO3-610 assessments during disease progression and regression phase in ELISA assay and Western blot.
Mean CO3-610 levels during the fibrosis progression phase of up to 8 weeks of CCl4 treatment (P < 0.05), and regression (A). Comparison of mean CO3-610 levels during treatment and regression phases (B).
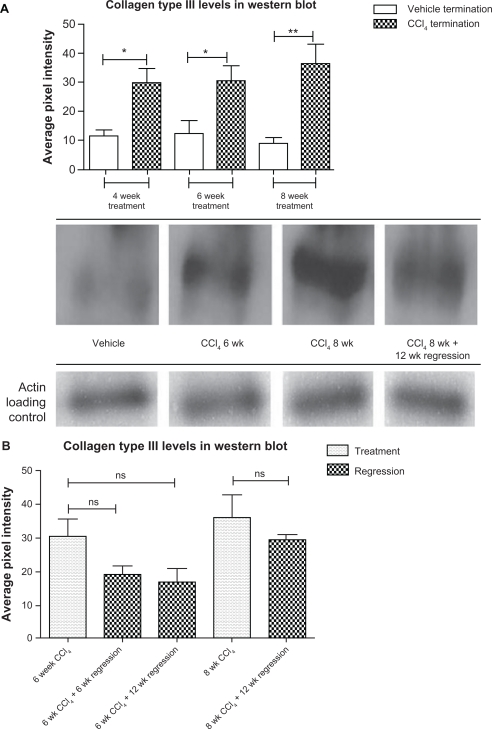
Similarly, mean collagen type III levels assessed by Western blot were found to increase statistically significantly during the fibrosis progression phase of up to 8 weeks of CCl4 treatment (P < 0.05). Animals left to regress for 12 weeks after 8 weeks of CCl4 treatment showed a decrease in collagen III levels (mean API 29.3) which was also found to be statistically significant (P = 0.0016) compared with the API value at the end of 8 weeks’ treatment (Fig. 4A). Western blot densitometry analysis also revealed a non-statistically significant decrease in collagen III levels for all regression points (P > 0.05) (Fig. 4B).
Figure 4.
Total collagen III levels assessment by Western blot.
Mean collagen type III levels assessed by Western blot (Fig. 4A). Collagen III levels at treatment and regression points (Fig. 4B).
Correlation during progression and regression
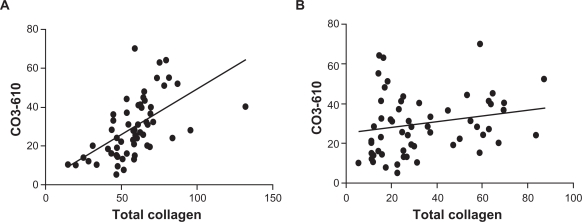
A statistically significant correlation (P < 0.0001) was detected during disease progression between levels of CO3-610 and total collagen (Fig. 5A) while during regression, there was no correlation between the two (P = 0.1138) (Fig. 5B).
Figure 5.
CO3-610 correlation with total collagen levels during disease progression and regression.
CO3-610 levels were statistically significantly correlated with total collagen during disease progression (r = 0.5701, P < 0.0001) (A). No statistically significant correlation was observed during regression (r = 0.2081, P = 0.1138) (B).
Discussion
The most abundant molecules in the ECM are various collagens, in particular types I and III, as well as a range of proteoglycans. During fibrogenesis, levels of ECM components, particularly collagens, increase significantly. Thus, a marker of the excessive turnover of collagens could be a potential biomarker not only of liver fibrosis but also of other diseases such as cancer, in which ECM remodelling is unbalanced.
Collagen type I (CO1) is the predominant form of collagen and could be an attractive biomarker target. However, CO1 is degraded during bone resorption as well as in the fibrotic liver and thus it would be difficult to distinguish the source when measuring CO1 levels in serum or urine.16–20
The present study demonstrates a potential alternative to CO1 as a biomarker of fibrosis. We showed that increased levels of the MMP9-mediated collagen III (CO3) degradation fragment, CO3-610, are found in rats while undergoing treatment with the liver fibrosis-inducer, CCl4. Increasing CO3-610 levels as detected by ELISA analysis of serum and Western blot, showed statistically significant correlations with increasing levels of total collagen detected by Sirius red staining.
The main limitations of the study include the high mortality which reduced the initially planned number of animals and the statistical power of the analysis. It also deprived the study of the 12-week CCl4 treatment group, which could have provided additional information about CO3-610, total collagen and collagen type III levels during progression and regression. Furthermore, a longer period of regression without treatment could potentially have allowed for more informative monitoring of ECM remodelling, and correlating stage of the disease with CO3-610 and collagens, once the chemical stimulus was removed. Weekly administration of CCl4, instead of twice a week, could reduce mortalities and thus enable longer-term data over 12 weeks, for example, to be collected.
In conclusion, we provide additional evidence that the MMP9-cleaved collagen III degradation fragment, CO3-610, is a promising marker for non-invasive monitoring of liver fibrosis progression. The steep elevation of CO3-610 levels, from as early as 4 weeks of treatment with the fibrosis-inducing CCL4, and the corresponding progressive increase in total collagen and collagen type III levels, underline the potential prognostic capacity of the biomarker to monitor liver fibrosis and other manifestations of ECM remodelling in internal organs such as the liver. The above findings further strengthen our view of active role that increased ECM remodelling plays, in which includes collagens as active participants in the continuous tissue alteration process during fibrotic related pathology. We also provide further evidence of the different role of the collagen subgroups during fibrotic events and their promising informational capacity and utilisation as biomarkers. Additional research in well-controlled clinical settings is needed to further investigate this finding.
Footnotes
Disclosure
This manuscript has been read and approved by all authors. This paper is unique and is not under consideration by any other publication and has not been published elsewhere. The authors and peer reviewers of this paper report no conflicts of interest. The authors confirm that they have permission to reproduce any copyrighted material.
References
- 1.Barascuk N, Veidal SS, Larsen L, Larsen DV, Larsen MR, Wang J, et al. A novel assay for extracellular matrix remodeling associated with liver fibrosis: an enzyme-linked immunosorbent assay (ELISA) for a MMP-9 proteolytically revealed neo-epitope of type III collagen. Clinical Biochemistry. 2010;43:899–904. doi: 10.1016/j.clinbiochem.2010.03.012. [DOI] [PubMed] [Google Scholar]
- 2.Bataller R, Brenner DA. Liver fibrosis. J Clin Invest. 2005;115:209–18. doi: 10.1172/JCI24282. [DOI] [PMC free article] [PubMed] [Google Scholar]
- 3.Miyahara T, Schrum L, Rippe R, Xiong S, Yee HF, Jr, Motomura K, et al. Peroxisome proliferator-activated receptors and hepatic stellate cell activation. J Biol Chem. 2000;275:35715–22. doi: 10.1074/jbc.M006577200. [DOI] [PubMed] [Google Scholar]
- 4.Jarcuska P, Janicko M, Veseliny E, Jarcuska P, Skladany L. Circulating markers of liver fibrosis progression. Clin Chim Acta. 2010 doi: 10.1016/j.cca.2010.04.009. [DOI] [PubMed] [Google Scholar]
- 5.Atzori L, Poli G, Perra A. Hepatic stellate cell: a star cell in the liver. Int J Biochem Cell Biol. 2009;41:1639–42. doi: 10.1016/j.biocel.2009.03.001. [DOI] [PubMed] [Google Scholar]
- 6.Knittel T, Kobold D, Saile B, Grundmann A, Neubauer K, Piscaglia F, et al. Rat liver myofibroblasts and hepatic stellate cells: different cell populations of the fibroblast lineage with fibrogenic potential. Gastroenterology. 1999;117:1205–21. doi: 10.1016/s0016-5085(99)70407-5. [DOI] [PubMed] [Google Scholar]
- 7.Novo E, di Bonzo LV, Cannito S, Colombatto S, Parola M. Hepatic myofibroblasts: a heterogeneous population of multifunctional cells in liver fibrogenesis. Int J Biochem Cell Biol. 2009;41:2089–93. doi: 10.1016/j.biocel.2009.03.010. [DOI] [PubMed] [Google Scholar]
- 8.Friedman SL. Mechanisms of hepatic fibrogenesis. Gastroenterology. 2008;134:1655–69. doi: 10.1053/j.gastro.2008.03.003. [DOI] [PMC free article] [PubMed] [Google Scholar]
- 9.Karsdal MA, Henriksen K, Leeming DJ, Mitchell P, Duffin K, Barascuk N, et al. Biochemical markers and the FDA Critical Path: how biomarkers may contribute to the understanding of pathophysiology and provide unique and necessary tools for drug development. Biomarkers. 2009;14:181–202. doi: 10.1080/13547500902777608. [DOI] [PubMed] [Google Scholar]
- 10.Jensen LT. The aminoterminal propeptide of type III procolagen, Studies on physiology and pathophysiology. Danish Medical Bulletin. 1997;44(1):70–8. [PubMed] [Google Scholar]
- 11.Ulrich D, Noah EM, Burchardt ER, Atkins D, Pallua N. Serum concentration of amino-terminal propeptide of type III procollagen (PIIINP) as a prognostic marker for skin fibrosis after scar correction in burned patients. Burns. 2002;28:766–71. doi: 10.1016/s0305-4179(02)00193-6. [DOI] [PubMed] [Google Scholar]
- 12.Zachariae H, Heickendorff L, Sogaard H. The value of amino-terminal propeptide of type III procollagen in routine screening for methotrexateinduced liver fibrosis: a 10-year follow-up. Br J Dermatol. 2001;144:100–3. doi: 10.1046/j.1365-2133.2001.03959.x. [DOI] [PubMed] [Google Scholar]
- 13.Afdhal NH, Nunes D. Evaluation of liver fibrosis: a concise review. Am J Gastroenterol. 2004;99:1160–74. doi: 10.1111/j.1572-0241.2004.30110.x. [DOI] [PubMed] [Google Scholar]
- 14.Schaller S, Henriksen K, Hoegh-Andersen P, Sondergaard BC, Sumer EU, Tanko LB, et al. In vitro, ex vivo, and in vivo methodological approaches for studying therapeutic targets of osteoporosis and degenerative joint diseases: how biomarkers can assist? Assay Drug Dev Technol. 2005;3:553–80. doi: 10.1089/adt.2005.3.553. [DOI] [PubMed] [Google Scholar]
- 15.Barascuk N, Veidal SS, Larsen L, Larsen DV, Larsen MR, Wang J, et al. A novel assay for extracellular matrix remodeling associated with liver fibrosis: An enzyme-linked immunosorbent assay (ELISA) for a MMP-9 proteolytically revealed neo-epitope of type III collagen. Clin Biochem. 2010 doi: 10.1016/j.clinbiochem.2010.03.012. [DOI] [PubMed] [Google Scholar]
- 16.Ricard-Blum S, Chossegros P, Guerret S, Trepo C, Grimaud JA, Chevallier M. The carboxy-terminal cross-linked telopeptide of type I collagen (ICTP) is a potential serum marker of ongoing liver fibrosis. Clin Chim Acta. 1996;248:187–95. doi: 10.1016/0009-8981(95)06253-x. [DOI] [PubMed] [Google Scholar]
- 17.Stone PJ. Potential use of collagen and elastin degradation markers for monitoring liver fibrosis in schistosomiasis. Acta Trop. 2000;77:97–9. doi: 10.1016/s0001-706x(00)00118-2. [DOI] [PubMed] [Google Scholar]
- 18.Matsushima K, Bano M, Kidwell WR, Oppenheim JJ. Interleukin 1 increases collagen type IV production by murine mammary epithelial cells. J Immunol. 1985;134:904–9. [PubMed] [Google Scholar]
- 19.Manolagas SC. Birth and death of bone cells: basic regulatory mechanisms and implications for the pathogenesis and treatment of osteoporosis. Endocr Rev. 2000;21:115–37. doi: 10.1210/edrv.21.2.0395. [DOI] [PubMed] [Google Scholar]
- 20.Bonewald LF, Mundy GR. Role of transforming growth factor-beta in bone remodeling. Clin Orthop Relat Res. 1990:261–76. [PubMed] [Google Scholar]


