

Abstract
Objective
To identify specific genetic pathways showing altered expression in peripheral blood of depressed subjects with bipolar disorder (BPD).
Methods
Illumina Sentrix BeadChip (Human-6v2)microarrays containing > 48,000 transcript probes were used to measure levels of gene expression in peripheral blood from 20 depressed subjects with BPD and in 15 healthy control subjects. Quantitative real-time reverse transcription polymerase chain reaction (qRT-PCR) was used to confirm a subset of these differences.
Results
A total of 1,180 genes were differentially expressed between subjects with BPD and healthy controls (fold-change > 1.3, false discovery rate-corrected p < 0.05, covaried for age and sex). Of these, 559 genes were up-regulated in BPD subjects and 621 were down-regulated. Surprisingly, there was no difference between medicated (n =11) and unmedicated (n =9) subjects with BPD for any of these genes. Pathway analysis using GeneGo MetaCore software showed that the most significantly affected pathway was the mitochondrial electron transport chain (ETC). Of the 85 objects (genes or proteins) in this pathway, 22 were up-regulated and 2 down-regulated in subjects with BPD. qRT-PCR confirmed up-regulation of nuclear encoded ETC genes in complexes I, III, IV, and V and, in addition, demonstrated up-regulation of mitochondrially encoded genes in each of these complexes.
Conclusion
These results suggest that increased expression of multiple components of the mitochondrial ETC may be a primary deficit in bipolar depression, rather than an effect of medication.
Keywords: bipolar disorder, gene expression, microarray, mitochondria, oxidative phosphorylation, qRT-PCR
Bipolar disorder (BPD) is a devastating neurobiological illness affecting from 0.8–1.2% of the population (1–3). Clinically, the disorder is characterized by episodes of mania and major depression. However, as with the vast majority of psychiatric illnesses, the nature of the underlying pathophysiology remains unknown (4). Neuroanatomical studies of patients with BPD have demonstrated structural abnormalities including reduced numbers of glia in the subgenual prefrontal cortex (5) and decreased neuronal and glial density in the dorsolateral prefrontal cortex (6), as well as alterations in neuropeptides and monoamine metabolites (7). However, the relationship between these findings and changes in mood state and treatment response remains unknown.
More recently, genome-wide association studies (GWAS) have been used to identify genetic variants that may contribute to the risk for the development of BPD(8–14). Genes with replicated associations to BPD from GWAS include the L-type voltage-dependent calcium channel, alpha 1C subunit (CACNA1C) and ankyrin 3 (ANK3) genes (15). However, effect sizes for these genes are small (e.g., odds ratios of ~1.4 at ANK3 and ~1.2 at CACNA1C), and polymorphisms in or near these genes are currently of no use in individual risk prediction (16). Moreover, we do not yet understand how these genetic variants relate to either the neuroanatomical changes discussed above or specific symptoms in patients with BPD.
Multiple lines of evidence have suggested that alterations in energy metabolism may play a role in the pathogenesis of BPD (17–20). These include studies showing decreased levels of phospho-creatine in the frontal lobes of patients with bipolar depression (19, 20), increased levels of lactate in cerebrospinal fluid of patients with BPD (21), and decreased levels of messenger RNA (mRNA) for creatinine kinase (22). In mammalian cells, energy is generated by oxidative phosphorylation, which is carried out by the mitochondrial electron transport chain (ETC) [reviewed in Lenaz and Genova (23)]. Several groups have described abnormal expression of ETC genes in postmortem brain tissue of subjects with BPD (24–26). Abnormal expression of ETC genes has also been reported in response to glucose deprivation in cultured cells derived from patients with BPD (27).
While these studies all point to dysregulation of energy metabolism asa contributing factor in the pathogenesis of BPD, the reported direction of change has not always been consistent. For example, Konradi et al.(24), Iwamoto et al. (25), and Sun et al. (26) have all reported down-regulation of genes encoding components of the mitochondrial ETC in postmortem brain tissue of subjects with BPD. However, in the small subgroup of unmedicated subjects with BPD(n = 4) in the study by Iwamoto et al. (25), this trend was reversed, with most of the mitochondrial genes (85.2%) showing up-regulation compared with controls. This same study found that each of the medication groups examined (antidepressants, valproate, and antipsychotics) appeared to have a significant global repressive effect on the expression of mitochondria-related genes. Ben-Shachar and Karry (28) found that there was region-specific variation in the expression of mitochondrial genes in patients with BPD, with increased expression in the parieto-occipital cortex, but reductions in the cerebellum. Nakatani et al. (29) reported increased expression of one ETC gene (NDUFV2) in the dorsolateral cortex (BA 46) of subjects with BPD, but no change in any other ETC genes. Others have suggested that the differences in mitochondrial gene expression observed in these studies may be largely accounted for by differences in brain pH at the time of death (30). Thus, whether and in which direction the expression of mitochondrial genes is altered in BPD remains an area of active investigation.
It is now broadly accepted that changes in gene expression in the brain are related to long-term neuroplasticity underlying both the pathophysiology of psychiatric disorders and the mechanism of action of many of the agents used to treat them (31–34). However, with current technologies it is impossible to assess the time course of such changes in the brains of living subjects. Peripheral cells, including lymphocytes, express many of the same signaling molecules implicated as possible mediators of the long-term effects of both antidepressants and mood stabilizers. These include the CREB (35), phosphatidyl inositol (36), ERK (37), and EGFR (38) pathways. Lymphocytes also express a large number of neurotransmitter receptors including dopamine receptors, cannabinoid receptors, β-adrenergic receptors, mineralocorticoid and glucocorticoid receptors, muscarinic acetylcholine receptors, substance P receptors, GABAA receptors, and serotonin receptors and transporters [reviewed in Gladkevich et al. (39)]. A microarray study evaluating the comparability of gene expression in blood and brain (40) found that whole blood shares significant gene expression similarities with multiple central nervous system (CNS) tissues.
These similarities in gene expression between neural tissue and peripheral lymphoid tissue, combined with the inability to directly sample gene expression in the living brain, have led investigators to examine the feasibility of using blood as a surrogate tissue in which to examine changes in gene expression that may be associated with specific psychiatric disorders. While tissue or region-specific changes will not be detected, changes that affect basic aspects of cellular physiology such as energy metabolism are likely to be seen in both peripheral and central tissues.
In this study, we used microarrays to measure levels of gene expression in peripheral blood in 20 depressed subjects with BPD and in 15 untreated healthy controls. While comparisons with BPD subjects in other mood states (including euthymic BPD subjects) and subjects with major depressive disorder would be of interest, in order to increase subject homogeneity in the current study we included only depressed BPD subjects. In addition, since lithium has been shown to regulate a large number of genes, many of which may be relevant to the pathogenesis of BPD (41–43), we specifically excluded subjects who were currently taking lithium. Pathway analysis was used to identify those functional pathways that differed most significantly between depressed subjects with BPD and healthy controls. To further characterize the differences in mitochondrial gene expression (the top-ranked pathway from the microarray study), we carried out quantitative real-time reverse transcription polymerase chain reaction (qRT-PCR)analysis for a set of 16 genes, including 12 nuclear encoded ETC genes and 4 mitochondrially encoded genes, which were not interrogated by the microarray platform.
Materials and methods
Subjects
All procedures involving human subjects were approved by the Yale Human Investigation Committee and are in accordance with the Helsinki Declaration of 1975. All subjects provided written informed consent at the time of enrollment in the study. Inclusion criteria for subjects with BPD included:age between 18 and 65 years, diagnosis of BPD[type I(BPD-I) or II(BPD-II)], currently depressed as defined by the DSM-IV-TR (44), and not currently being treated with lithium. Diagnosis was determined by consensus of clinical interview by a board-certified psychiatrist (either RDB or ZB) and the Structured Clinical Interview for DSM-IV Axis I Disorders (SCID) (45). Exclusion criteria included DSM-IV-TR diagnoses other than BPD-I or BPD-II and current or recent abuse of illicit substances (verified by urine toxicology screening). Mood ratings for BPD subjects were performed using the Hamilton Depression Rating Scale (46, 47), the Montgomery-Åsberg Depression Rating Scale (48), the Hamilton Anxiety Rating Scale (49), and the Young Mania Rating Scale (50). Study eligibility was based on clinical diagnosis rather than any predetermined severity criteria.
An additional group of healthy controls was recruited through advertising. None of the control subjects met criteria for any DSM-IV-TR Axis I diagnosis as determined by the SCID or current or recent abuse of illicit substances.
Sample preparation and microarray analysis
Blood samples were collected directly into PAXgene blood RNA tubes (QIAGEN, Valencia, CA, USA) and stored frozen at −80°C until processing to reduce variation due to differences in sample processing. The choice to use whole blood rather than peripheral blood mononuclear cells (PBMCs) or some other cell fraction for analysis of gene expression is based on several factors. Primary among these is the desire to capture gene expression profiles that are as close as possible to those that exist in vivo. Collecting blood samples directly into PAXgene blood RNA tubes, which lyse the cells and prevent degradation of the RNA present, has been shown to prevent changes in gene expression associated with differences in storage or handling of the samples prior to RNA extraction (51). Total RNA was isolated from 10 cc whole blood using the PAXgene Blood RNA Isolation kit (QIAGEN) per the manufacturer’s instructions, and depleted of globin mRNA message using GLOBIN clear hybridization capture technology (Ambion, Austin, TX, USA). RNA quality was evaluated using the Agilent Bioanalyser (Agilent Technologies, Inc., Santa Clara, CA, USA) using both visual inspection and RNA integrity number (RIN) analysis (average RIN =7.5, range 5.5–8.8). Globin-reduced total RNA underwent complementary DNA (cDNA)synthesis and overnight in vitro transcription utilizing the Illumina TotalPrep RNA Amplification Kit (Ambion). Biotinylated cRNA (1.5 μg) was hybridized onto an Illumina Sentrix BeadChip (Human-6v2) (Illumina, Inc., San Diego, CA, USA) then scanned on a BeadArray Reader (Illumina, Inc.).
Microarray hybridization and scanning were carried out at the National Institute of Health Neuroscience Microarray Center at Yale (http://info.med.yale.edu/neuromicroarray). Per the policies of the NIH microarray consortium, all raw data, including project annotation, generated by the project have been made publicly available. Raw and normalized data can be accessed at the National Center for Biotechnology Information Gene Expression Omnibus(NCBI-GEO) repository (http://www.ncbi.nlm.nih.gov/geo/). The GSE accession number is GSE23848.
Normalization and data analysis
Statistical analysis of microarray data was carried out at the Keck Foundation Biotechnology Biostatistics Resource (http://keck.med.yale.edu/biostats). Illumina BeadStudio software was used to generate probe and gene expression profiles of each sample. Quantile normalization was carried out using the package incorporated in the Illumina BeadStudio software package (52). Further statistical analysis was carried out on all genes with a detection p-value <0.01 as determined using the Illumina BeadStudio software (i.e., a 99% probability that expression was above background), and normalized expression levels > 20. A total of 17,240 genes on the array met these criteria. This is similar to the detection sensitivity seen in other studies of whole blood using the Illumina Sentrix BeadChip platform (53).
Gene expression levels were compared between subjects with BPD and healthy controls using analysis of variance, and were covaried for the effects of age and sex. The p-values were adjusted to control the group-wise false discovery rate (FDR) (54, 55) at <0.05 using the statistical package R.
Network analysis was carried out using GeneGo MetaCore® software (GeneGo, Inc., Encinitas, CA, USA). The significance of biological pathways is estimated through a variation of Fisher’s exact test as implemented in the MetaCore software package and adjusted for multiple testing using Benjamini-Hochberg FDR analysis (which is a built-infunction of GeneGo MetaCore software). Additional information on the calculations of p-values for the various pathways included in MetaCore is available in the online publication: “Evaluating statistical significance of pathways and network in MetaCore” (available online at: http://portal.genego.com/help/P-value_calculations.pdf). Analysis done using this software package has been shown to produce results that are congruent, but not identical, to those generated using other commercially available systems (e.g., Ingenuity Pathways Analysis) and the DAVID Functional Classification tool (56).
qRT-PCR analysis
qRT-PCR was carried out using samples from a subset of the subjects and controls tested in the microarray (17 subjects with BPD and 10 controls; samples were not used for qRT-PCR when no more purified RNA was available) for a set of 16 genes including 12 nuclear encoded ETC genes: NADH dehydrogenase flavoprotein subunits A1, B3, S4, and S5 (NDUFA1, NDUFB3, NDUFS4, and NDUFS5); succinate dehydrogenase complex, subunit D (SDHD); ubquinol-cytochrome c reductase binding protein (UQCRB); ubquinol-cytochrome c reductase, complex III, subunit VII (UQCRQ); cytochrome c oxidase subunits 6C, 7B and 7C (COX6C, COX7B, and COX7C); and ATP synthase, FO, subunits D, E (ATP5H, ATP5I); and four mitochondrially encoded genes: mitochondrially encoded NADH dehydrogenase 2 (MT-ND2), mitochondrially encoded cytochrome b (MT-CYB), mitochondrially encoded cytochrome c oxidase I (MT-COI), and mitochondrially encoded ATP synthase 6 (MT-ATP6). Normalization was carried out against the endogenous reference gene TNF receptor associated protein (TRAP1), which was recently shown to be stably expressed in RNA from peripheral blood (57). Similar results were obtained using a second housekeeping gene, peptidylprolyl isomerase B (PPIB) (58) for normalization. qRT-PCR was carried out using the TaqMan® Universal PCR Master Mix Protocol (Applied Biosystems, Life Technologies, Carlsbad, CA, USA) and Real-Time PCR probes listed on the NCBI Probe Database (http://www.ncbi.nlm.nih.gov/sites/entrez?db=probe).
Results
Microarray analysis was carried out using Illumina Sentrix BeadChip (Human-6v2) microarrays on peripheral blood RNA isolated from a group of 20 depressed subjects with either BPD-I (n =17) or BPD-II (n = 3) and 15 healthy control subjects. Demographic and clinical information for both BPD subjects and healthy controls are summarized in Table 1. Depressed subjects with BPD included 9 unmedicated patients and 11 who were receiving one or more atypical antipsychotic medications (olanzapine, quietapine, risperidone, or ziprasidone). Two subjects were taking valproic acid in addition to an atypical antipsychotic and one subject each was taking carbamazepine, oxcarbazepine, or topiramate in addition to an atypical antipsychotic (patients had been selected on the condition that they were not receiving lithium). None of the BPD subjects (or healthy controls) was taking antidepressants at the time of the study. Both the healthy controls and the BPD group were predominantly female (70%) and predominantly Caucasian (65%). There were no significant differences in age or ethnic background among the groups compared.
Table 1.
Summary of demographic and clinical information of study participants
| Microarray | qRT-PCR | |||
|---|---|---|---|---|
| Bipolar disorder | Healthy control | Bipolar disorder | Healthy control | |
| Gender, n (%) | ||||
| Male | 6 (30) | 5 (33) | 6 (35) | 6 (60) |
| Female | 14 (70) | 10 (67) | 11 (65) | 4 (40) |
| Ethnicity, n (%) | ||||
| Caucasian | 13 (65) | 10 (67) | 12 (70) | 7 (70) |
| Non-Caucasian | 7 (35) | 5 (33) | 5 (30) | 3 (30) |
| Age (years), mean (SD) | 38.4 (9.5) | 29.0 (9.6) | 38.5 (9.7) | 28.1 (6.7) |
| HAM-D score, mean (SD) | 27.7 (15.0) | NA | 27.9 (14.8) | NA |
| HAM-A score, mean (SD) | 14.6 (7.6) | NA | 14.4 (8.2) | NA |
| MADRS score, mean (SD) | 19.3 (11.3) | NA | 18.6 (11.7) | NA |
| YMRS score, mean (SD) | 6.1 (5.0) | NA | 6.5 (5.3) | NA |
qRT-PCR = quantitative real-time reverse transcription polymerase chain reaction; HAM-D= Hamilton Depression Rating Scale; HAM-A= Hamilton Anxiety Rating Scale; MADRS= Montgomery-Åsberg Depression Rating Scale, YMRS = Young Mania Rating Scale.
Align values by left parenthesis.
Analysis of the microarray data by ANOVA identified 1,180 genes that were differentially expressed between depressed subjects with BPD and healthy controls (fold-change >1.3, FDR-corrected p < 0.05, covaried for age and sex). Of these, 559 genes were up-regulated in BPD subjects and 621 were down-regulated. To assess whether these differences were related to medication usage, we compared gene expression in medicated (n =11) and unmedicated (n =9) subjects with BPD separately from healthy controls. Surprisingly, ANOVA showed no significant differences between medicated and unmedicated BPD subjects in the expression of any of the 1,180 genes where differences were seen in the microarray data between BPD subjects and controls. A complete list of the fold-changes and FDR corrected p-values for all of the genes showing differential expression between BPD subjects and controls, as well as the corresponding values when medicated and unmedicated BPD subjects were compared separately to controls, is provided in Supplemental Table 1.
To identify functional relationships among the differentially expressed genes, we carried out pathway analysis using GeneGo MetaCore software. Table 2 lists the top 10 functional pathways identified using this software as well as the p-value associated with the number of differentially expressed genes in each pathway. As shown in Table 2, the most significantly affected pathway was the mitochondrial ETC (p < 8.64 × 10⁻⁷). Of the 85 objects (genes or proteins) in this pathway, 22 were up-regulated and 2 down-regulated in subjects with BPD.
Table 2.
Top 10 functional pathways identified by microarray analysis as differing significantly between bipolar disorder subjects and healthy controls
| Rank | Pathway | Cell process | p-value | Differentially expressed genes, n | Genes or proteins in pathway, n |
|---|---|---|---|---|---|
| 1 | Oxidative phosphorylation/electron transport chain | Energy metabolism | 8.64E-07 | 24 | 85 |
| 2 | Development: Notch signaling pathway | Response to extracellular stimulus | 2.73E-04 | 12 | 40 |
| 3 | Transcription: NF-kB signaling pathway | Transcription, immune response | 5.36E-04 | 11 | 37 |
| 4 | Development: NOTCH1-mediated pathway for NF-KB activity modulation | Transcription, response to extracellular stimulus | 6.18E-04 | 10 | 32 |
| 5 | Bacterial infections in cystic fibrosis airways | Lung diseases/cystic fibrosis | 7.20E-04 | 12 | 44 |
| 6 | Development: EPO-induced Jak-STAT pathway | Apoptosis, response to extracellular stimulus | 1.35E-03 | 10 | 35 |
| 7 | Apoptosis and survival: Lymphotoxin-beta receptor signaling | Apoptosis, immune response | 1.39E-03 | 11 | 41 |
| 8 | Apoptosis and survival: BAD phosphorylation | Apoptosis and survival | 1.71E-03 | 10 | 36 |
| 9 | Immune response: MIF – the neuroendocrine-macrophage connector | Immune response | 2.07E-03 | 9 | 31 |
| 10 | Apoptosis and survival: Anti-apoptotic TNFs/NF-kB/Bcl-2 pathway | Apoptosis and survival | 4.84E-03 | 10 | 41 |
Table 3 lists the fold-change and FDR-adjusted p-values for each of the differentially expressed genes in the mitochondrial ETC pathway identified in the microarray analysis. Results are shown for BPD subjects as a group compared to controls and for medicated and unmedicated BPD subjects compared separately to controls. There were no significant differences between medicated and un-medicated subjects with BPD for any of these genes.
Table 3.
Mitochondrial electron transport chain (ETC) genes showing differential expression in bipolar disorder (BPD) subjects versus healthy controls by microarray analysis
| Gene symbol | Fold-change (BPD overall versus control) | p-value | Fold-change (unmedicated BPD versus control) | p-value | Fold-change (medicated BPD versus control) | p-value |
|---|---|---|---|---|---|---|
| Complex I (NADH dehydrogenase)a | ||||||
| NDUFA1 | 1.50 | 0.0075 | 1.49 | 0.0226 | 1.51 | 0.0241 |
| NDUFA4 | 1.46 | 0.0181 | 1.37 | NS | 1.58 | 0.0246 |
| NDUFA6 | 1.31 | 0.0124 | 1.27 | NS | 1.37 | 0.0217 |
| NDUFB3 | 1.81 | 0.0017 | 1.62 | 0.0137 | 2.09 | 0.0032 |
| NDUFB9 | −1.42 | 0.0269 | −1.53 | 0.0277 | −1.29 | NS |
| NDUFS4 | 1.67 | 0.0028 | 1.64 | 0.0129 | 1.72 | 0.01 |
| NDUFS5 | 2.01 | 0.0009 | 1.98 | 0.0061 | 2.04 | 0.0049 |
| Complex II (succinate dehydrogenase)b | ||||||
| SDHA | 1.27 | NS | 1.38 | 0.0463 | 1.15 | NS |
| SDHD | −1.63 | 0.0029 | −1.6 | 0.0137 | −1.68 | 0.01 |
| LOC642502c | −1.25 | NS | −1.31 | 0.0265 | −1.19 | NS |
| Complex III (ubiquinol cytochrome c reductase)d | ||||||
| LOC644969e | 2.00 | 0.0181 | 1.82 | NS | 2.25 | 0.0281 |
| UQCRB | 1.63 | 0.002 | 1.55 | 0.0121 | 1.74 | 0.0053 |
| Complex IV (cytochrome c oxidase) | ||||||
| COX6C | 2.17 | 0.0027 | 2.05 | 0.014 | 2.32 | 0.0085 |
| COX7B | 2.21 | 0.005 | 1.79 | 0.037 | 2.90 | 0.0049 |
| COX7C | 1.56 | 0.0148 | 1.54 | 0.0379 | 1.58 | 0.0371 |
| Complex V (ATP synthase) | ||||||
| ATP5Df | 1.33 | 0.024 | 1.39 | 0.0298 | 1.25 | NS |
| ATP5Eg | 1.43 | 0.0028 | 1.38 | 0.0152 | 1.49 | 0.007 |
| ATP5Hh | 1.33 | 0.0043 | 1.33 | 0.0146 | 1.33 | 0.0171 |
| ATP5Ii | 1.33 | 0.0385 | 1.23 | NS | 1.48 | 0.0301 |
| ATP5Jj | 1.34 | 0.0249 | 1.29 | NS | 1.40 | 0.0383 |
The genes listed do not correspond precisely with the objects included in the GeneGO database since two of the genes listed (LOC642502 and LOC644969) are included based on sequence homology to other known ETC genes, but are not included in the GeneGO database. UQCRB = ubquinol-cytochrome c reductase binding protein.
Also known as NADH-coenzyme Q oxidoreductase.
Also known as succinate–Q oxidoreductase.
Predicted similar to SDHC.
Also known as Q-cytochrome c oxidoreductase.
Predicted similar to ubquinol-cytochrome c reductase complex 14 kDa protein.
ATP synthase, F1, subunit delta.
ATP synthase, F1, subunit epsilon.
ATP synthase, F0, subunit D.
ATP synthase, F0, subunit E.
ATP synthase, F1, subunit F6.
Up-regulated ETC genes include components of complexes I, III, IV, and V. The position of each of the differentially regulated ETC genes within the mitochondrial ETC is illustrated in Figure 1.
Fig. 1.
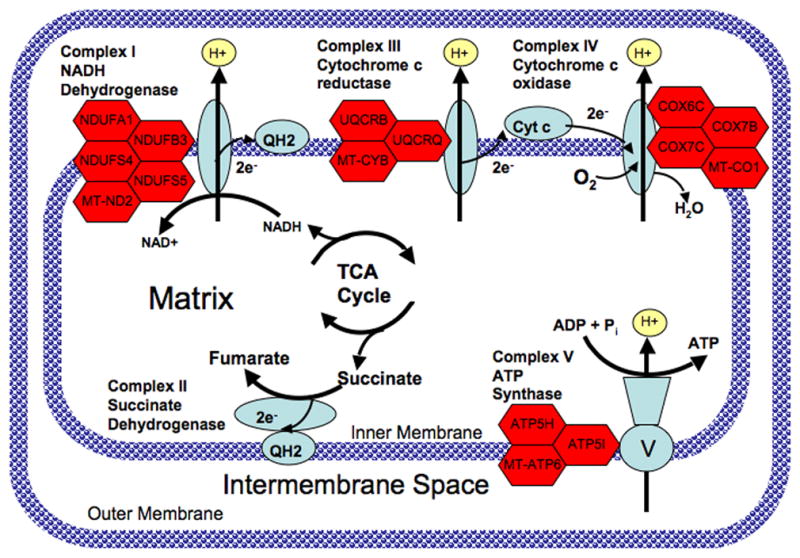
Diagram of the mitochondrial electron transport chain showing genes with altered expression in subjects with bipolar disorder (BPD). Complex I (NADH dehydrogenase) catalyzes the removal of two electrons from NADH and transfers them to the electron carrier ubiquinone (Q). The reduced product is ubiquinol (QH2). Complex II (succinate dehydrogenase) catalyzes the conversion of succinate to fumarate and in the process transfers two electrons to ubiquinone via FAD. Complex III catalyzes the removal of two electrons from QH2 and transfers them to two molecules of the electron carrier, cytochrome c. Complex IV removes two electrons from the two molecules of cytochrome c and transfers them to molecular oxygen (O2), producing water. The proton gradient established by pumping hydrogens across the inner mitochondrial membrane is then utilized by Complex V (ATP synthase) to catalyze the formation of ATP from ADP and Pi. Genes encoding various subunits of complexes I, III, IV, and V that were up-regulated in peripheral blood of subjects with BPD are shown as red hexagons next to the corresponding complex.
To further characterize the differences in mitochondrial gene expression, we carried out qRT-PCR analysis using peripheral blood RNA isolated from a set of 12 nuclear encoded ETC genes and 4 mitochondrially encoded genes (one each from complexes I, III, IV, and V—complex II is encoded by 4 nuclear encoded genes). Table 4 shows the fold-change and p-value for each of these genes as assessed by qRT-PCR after normalization against the endogenous reference gene TRAP1, which was recently shown to be stably expressed in RNA from peripheral blood (57). Similar results were obtained using a second housekeeping gene, PPIB (58), for normalization. There was no difference between BPD subjects and controls in expression of either of these genes as assessed by microarray hybridization or qRT-PCR. Findings from the microarray study are shown for comparison where available.
Table 4.
Comparison of microarray and quantitative real-time reverse transcription polymerase chain reaction (qRT-PCR) results for selected electron transport chaingenes
| Gene symbol | Fold-change qRT-PCR | p-value qRT-PCR | Fold-change microarray | p-value microarray |
|---|---|---|---|---|
| Complex I (NADH dehydrogenase)a | ||||
| NDUFA1–nuclear encoded | 2.35 fold | 0.0069 | 1.49 fold | 0.0068 |
| NDUFB3–nuclear encoded | 2.79 fold | 0.0128 | 1.80 fold | 0.0022 |
| NDUFS4–nuclear encoded | 2.78 fold | 0.0011 | 1.67 fold | 0.0007 |
| NDUFS5–nuclear encoded | 2.58 fold | 0.0066 | 1.94 fold | 0.0024 |
| MT-ND2 | 1.96 fold | 0.0361 | n/a | n/a |
| Complex II (succinate dehydrogenase) | ||||
| SDHD–nuclear encoded | 1.98 fold | 0.0128 | (-)1.64 | 0.0125 |
| Complex III (ubiquinol cytochrome c reductase) | ||||
| UQCRB–nuclear encoded | 4.78 fold | 6.98E-05 | 1.62 fold | 0.0007 |
| UQCRQ–nuclear encoded | 1.28 fold | 0.4270 (NS) | 1.63 fold | 0.002 |
| MT-CYBb | 1.23 fold | 0.4408 (NS) | n/a | n/a |
| Complex IV (cytochrome c oxidase) | ||||
| COX6C–nuclear encoded | 1.91 fold | 0.0546 (NS) | 2.16 fold | 0.0036 |
| COX7B–nuclear encoded | 3.86 fold | 0.0032 | 2.19 fold | 0.0097 |
| COX7C–nuclear encoded | 2.24 fold | 0.0055 | 1.56 fold | 0.0039 |
| MT-COIc | 3.06 fold | 0.0002 | n/a | n/a |
| Complex V (ATP synthase) | ||||
| ATP5H–nuclear encoded | 1.52 fold | 0.1821 (NS) | 1.33 fold | 0.0053 |
| ATP5I–nuclear encoded | 1.35 fold | 0.2856 (NS) | 1.33 fold | 0.0385 |
| MT-ATP6 | 2.38 fold | 0.0066 | n/a | n/a |
NDUFA1 = NADH dehydrogenase flavoprotein A1; NDUFB3 = NADH dehydrogenase flavoprotein B3; NDUFS4 = NADH dehydrogenase flavoprotein S4; NDUFS5 = NADH dehydrogenase flavoprotein S5; MT-ND2 = mitochondrially encoded NADH dehydrogenase 2; SDHD = succinate dehydrogenase complex, subunit D; UQCRB = ubquinol-cytochrome c reductase binding protein; UQCRQ = ubiquinol-cytochrome c reductase, complex III subunit VII; MT-CYB = mitochondrially encoded cytochrome b; COX6C = cytochrome c oxidase subunit VIc; COX7C = cytochrome c oxidase subunit VIIb; COX7C = cytochrome c oxidase subunit VIIc; MT-COI = mitochondrially encoded cytochrome c oxidase I; ATP5H = ATP synthase, FO, subunit d; ATP5I = ATP synthase, FO, subunit E; MT-ATP6 = mitochondrially encoded ATP synthase 6.
Also known as NADH-coenzyme Q oxidoreductase.
Also known as CYTB.
Also known as COX1.
Discussion
These results extend previous reports demonstrating alterations in energy metabolism in subjects with BPD. Using whole genome microarrays, we identified a large number of genes that were differentially expressed in peripheral blood of subjects with BPD compared to healthy controls. Pathway analysis using GeneGo MetaCore software showed that the most significantly affected pathway was the mitochondrial ETC (p < 8.6 × 10⁻⁷), suggesting that this pathway may play an important role in the pathophysiology of depression in patients with BPD. Moreover, this number is probably an underestimate of the number of dysregulated genes in the ETC pathway, since the arrays used did not include any of the mitochondrially encoded components of the ETC (13 genes) (59).
Combining the results from the microarray and qRT-PCR studies, it appears that there is a general increase in the expression of both nuclear and mitochondrially encoded ETC genes in subjects with bipolar depression. Moreover, all of the top 10 functional pathways identified in the microarray analysis are interconnected, and relate directly or indirectly to mitochondrial functions, including energy metabolism and the regulation of apoptosis by mitochondrial proteins. In particular, production of energy via the ETC (the top-ranked pathway) is directly coupled to the regulation of apoptosis and cell survival (Table 2, pathways 6–8, 10) since mitochondrially formed oxidants activate a number of signaling pathways related to apoptosis. In particular, activation of the mitochondrial death pathways mediated by Bax and Bak is dependent upon oxidative phosphorylation (60, 61). There is also evidence that the activity of the mitochondrial ETC is regulated directly by the Notch signaling pathway (Table 2, pathways 2, 4) (62, 63) and indirectly by the pro-inflammatory/anti-apoptotic regulatory protein, nuclear factor kappa B (NF-κB) (Table 2, pathways 3–5) (64, 65). The macrophage migration inhibitory pathway (Table 2, pathway 9) also interacts with the NF-κB pathway and has been implicated as a regulator of apoptosis (66). Thus, it appears likely that a dysregulation of mitochondrial function is central to the large number of gene expression changes observed in the current study.
Limitations of this study include the small sample size and possible confounding effects of differences among specific subpopulations of white blood cells between subjects with BPD and controls. Such differences could affect the relative expression of some genes, i.e., those specific to the over- or under-represented cell types. However, since ETC genes are expressed in all cell types, it is unlikely that that the observed differences in ETC gene expression are related to differences in subpopulations of white cells between the two groups.
Several previous studies have examined the expression of mitochondrial genes, most notably NDUFV2, in transformed lymphocytes from patients with BPD. Washizuka et al. examined the expression of NDUFV2 (67) and 11 other mitochondria-related genes (68) in lymphoblastoid cells derived from a cohort of 21 Japanese subjects with BPD and 11 controls. They found that components of complex I and complex IV were down-regulated in the subset of subjects with BPD-I (n =13), although only the change in NDUFV2 was significant after correction for multiple testing. In contrast, Xu et al. (69) reported no difference in the level of expression of NDUFV2 in transformed lymphocytes from a group of 178 subjects with BPD of European Caucasian ancestry compared to a group of 120 controls. In a follow-up study, Washizuka et al. (70) confirmed the decrease of NDUFV2 in subjects with BPD-I of Japanese ancestry (n =25), but found increased expression of NDUFV2 in Japanese subjects with BPD-II (n =10) and no change in BPD (either BPD-I or BPD-II) in subjects of Caucasian ancestry. However, the significance of these studies with regard to the expression of ETC genes in lymphocytes in vivo is unclear, since transformation with Epstein-Barr virus has been shown to affect the expression of multiple genes in lymphocytes, including pathways regulating cell growth and division (71–74).
In contrast to our current findings, a number of postmortem studies (24–26) have suggested that the expression of ETC genes may be decreased in patients with BPD. There are several possible explanations for the difference between those findings and our findings in the current study. First, it is possible that there are state-related differences in the expression of ETC genes in subjects with BPD. In the current study, all BPD subjects were depressed at the time of study entry, while the postmortem studies may have included subjects who were depressed, manic, or euthymic at the time of death. Consistent with that hypothesis, Dror et al. (75) found evidence of state-dependent changes in mitochondrial complex I activity in platelets of schizophrenic patients, with increased activity in patients with active psychotic symptoms but decreased activity in patients with residual schizophrenia. Further studies will be needed to determine if there is a similar state-dependence to the changes in ETC gene expression observed in this study. Second, the majority of patients included in the previous studies were receiving mood stabilizers and/or antipsychotic medications at the time of death. Thus, the decreased expression of ETC genes in those studies may be reflective of either acute or chronic effects of these medications on gene expression. Consistent with that hypothesis, Iwamoto et al. (25) found that each of the medication groups examined (antidepressants, valproate, and antipsychotics) appeared to have a significant global repressive effect on the expression of mitochondria-related genes. Moreover, in the same study, the small group of unmedicated subjects with BPD (n =4) showed an up-regulation of ETC genes consistent with the findings we have reported here. Third, the previous reports are based on postmortem brain samples, while our findings are based on blood samples isolated from living subjects with BPD. Thus, there may be a tissue-specific difference with ETC genes being up-regulated in blood, but down-regulated in some or all regions of the CNS of patients with BPD. Consistent with that hypothesis, Ben-Shachar and Karry (28) found that there was region-specific variation in the expression of mitochondrial genes in patients with BPD, with increased expression in the parieto-occipital cortex but reduced expression in the cerebellum. Finally, differences in brain pH at the time of death may explain a large part of the previously reported decrease in ETC gene expression (30). Further studies will be needed to clarify more precisely the relationships among diagnosis, mood state, treatment status, and ETC gene expression in BPD.
Studies in cell culture and animal models have shown that chronic treatment with lithium or valproate can enhance mitochondrial function and protect against mitochondrially mediated toxicity (76). Lithium has also been shown to increase the activity of ETC complexes I+ III and II + III in extracts from human postmortem brain tissue at therapeutically relevant concentrations (77). Conversely, rats subjected to an experimental model of depression showed impaired mitochondrial function (78). Thus, enhancing mitochondrial ETC function may play a role in the therapeutic effects of lithium and other mood stabilizers. In the current study, we found that depressed BPD subjects had elevated levels of mRNA for several of the genes in ETC complexes I, III, IV, and V. Increased expression of these genes suggests that there may be increased mitochondrial turnover in depressed subjects with BPD (79). Consistent with the hypothesis that bipolar depression is characterized by impaired mitochondrial function, Andreazza et al.(80) have recently demonstrated that the activity of mitochondrial complex I is decreased and oxidative damage is increased in the postmortem prefrontal cortex of patients with BPD.
Abnormal expression of mitochondrial genes has also been suggested to play a role in other disorders, including schizophrenia (18, 81, 82) and type 2 diabetes (83, 84). An emerging challenge for the field will be to establish how changes in mitochondrial gene expression, and by implication changes in mitochondrial function, relate to the specific symptoms observed in each of these disorders.
Supplementary Material
Acknowledgments
This work was supported by grants from the California Bipolar Foundation (RDB), Donaghue Foundation Grant # DF08-009 (RDB), Stanley Medical Research Institute Grants # 05R-864 (RDB) and #05T-68 (ZB), NIH/NIDA K12 DA-00167 (RDB), 1K23MH077914-01A1 (ZB), NARSAD (ZB), CTSA Grant Number UL1 RR024139 from the National Center for Research Resources to Yale University (ZB), R01-AA013892 (RS), UL1-DE019586 (RS), and PL1-DA024859 (RS).
Footnotes
The authors of this paper do not have any commercial associations that might pose a conflict of interest in connection with this manuscript.
References
- 1.Merikangas KR, Akiskal HS, Angst J, et al. Lifetime and 12-month prevalence of bipolar spectrum disorder in the National Comorbidity Survey replication. Arch Gen Psychiatry. 2007;64:543–552. doi: 10.1001/archpsyc.64.5.543. [DOI] [PMC free article] [PubMed] [Google Scholar]
- 2.Kessler RC, Berglund P, Demler O, Jin R, Merikangas KR, Walters EE. Lifetime prevalence and age-of-onset distributions of DSM-IV disorders in the National Comorbidity Survey Replication. Arch Gen Psychiatry. 2005;62:593–602. doi: 10.1001/archpsyc.62.6.593. [DOI] [PubMed] [Google Scholar]
- 3.Waraich P, Goldner EM, Somers JM, Hsu L. Prevalence and incidence studies of mood disorders: a systematic review of the literature. Can J Psychiatry. 2004;49:124–138. doi: 10.1177/070674370404900208. [DOI] [PubMed] [Google Scholar]
- 4.Martinowich K, Schloesser RJ, Manji HK. Bipolar disorder: from genes to behavior pathways. J Clin Invest. 2009;119:726–736. doi: 10.1172/JCI37703. [DOI] [PMC free article] [PubMed] [Google Scholar]
- 5.Ongur D, Drevets WC, Price JL. Glial reduction in the subgenual prefrontal cortex in mood disorders. Proc Natl Acad Sci USA. 1998;95:13290–13295. doi: 10.1073/pnas.95.22.13290. [DOI] [PMC free article] [PubMed] [Google Scholar]
- 6.Rajkowska G, Halaris A, Selemon LD. Reductions in neuronal and glial density characterize the dorsolateral prefrontal cortex in bipolar disorder. Biol Psychiatry. 2001;49:741–752. doi: 10.1016/s0006-3223(01)01080-0. [DOI] [PubMed] [Google Scholar]
- 7.Vawter MP, Freed WJ, Kleinman JE. Neuropathology of bipolar disorder. Biol Psychiatry. 2000;48:486–504. doi: 10.1016/s0006-3223(00)00978-1. [DOI] [PubMed] [Google Scholar]
- 8.WTCCC. Wellcome Trust Case Control Consortium. Genome-wide association study of 14,000 cases of seven common diseases and 3000 shared controls. Nature. 2007;447:661–678. doi: 10.1038/nature05911. [DOI] [PMC free article] [PubMed] [Google Scholar]
- 9.Baum AE, Akula N, Cabanero M, et al. A genome-wide association study implicates diacylglycerol kinase eta (DGKH) and several other genes in the etiology of bipolar disorder. Mol Psychiatry. 2008;13:197–207. doi: 10.1038/sj.mp.4002012. [DOI] [PMC free article] [PubMed] [Google Scholar]
- 10.Ferreira MA, O’Donovan MC, Meng YA, et al. Collaborative genome-wide association analysis supports a role for ANK3 and CACNA1C in bipolar disorder. Nat Genet. 2008;40:1056–1058. doi: 10.1038/ng.209. [DOI] [PMC free article] [PubMed] [Google Scholar]
- 11.Sklar P, Smoller JW, Fan J, et al. Whole-genome association study of bipolar disorder. Mol Psychiatry. 2008;13:558–569. doi: 10.1038/sj.mp.4002151. [DOI] [PMC free article] [PubMed] [Google Scholar]
- 12.Smith EN, Bloss CS, Badner JA, et al. Genome-wide association study of bipolar disorder in European American and African American individuals. Mol Psychiatry. 2009;14:755–763. doi: 10.1038/mp.2009.43. [DOI] [PMC free article] [PubMed] [Google Scholar]
- 13.Scott LJ, Muglia P, Kong XQ, et al. Genome-wide association and meta-analysis of bipolar disorder in individuals of European ancestry. Proc Natl Acad Sci USA. 2009;106:7501–7506. doi: 10.1073/pnas.0813386106. [DOI] [PMC free article] [PubMed] [Google Scholar]
- 14.Hattori E, Toyota T, Ishitsuka Y, et al. Preliminary genome-wide association study of bipolar disorder in the Japanese population. Am J Med Genet B Neuropsychiatr Genet. 2009;150B:1110–1117. doi: 10.1002/ajmg.b.30941. [DOI] [PubMed] [Google Scholar]
- 15.O’Donovan MC, Craddock NJ, Owen MJ. Genetics of psychosis; insights from views across the genome. Hum Genet. 2009;126:3–12. doi: 10.1007/s00439-009-0703-0. [DOI] [PubMed] [Google Scholar]
- 16.Craddock N, Sklar P. Genetics of bipolar disorder: successful start to a long journey. Trends Genet. 2009;25:99–105. doi: 10.1016/j.tig.2008.12.002. [DOI] [PubMed] [Google Scholar]
- 17.Quiroz JA, Gray NA, Kato T, Manji HK. Mitochondrially mediated plasticity in the pathophysiology and treatment of bipolar disorder. Neuropsychopharmacology. 2008;11:2551–2565. doi: 10.1038/sj.npp.1301671. [DOI] [PubMed] [Google Scholar]
- 18.Shao L, Martin MV, Watson SJ, et al. Mitochondrial involvement in psychiatric disorders. Ann Med. 2008;40:281–295. doi: 10.1080/07853890801923753. [DOI] [PMC free article] [PubMed] [Google Scholar]
- 19.Kato T. Mitochondrial dysfunction as the molecular basis of bipolar disorder: Therapeutic implications. CNS Drugs. 2007;21:1–11. doi: 10.2165/00023210-200721010-00001. [DOI] [PubMed] [Google Scholar]
- 20.Stork C, Renshaw PF. Mitochondrial dysfunction in bipolar disorder: evidence from magnetic resonance spectroscopy research. Mol Psychiatry. 2005;10:900–919. doi: 10.1038/sj.mp.4001711. [DOI] [PubMed] [Google Scholar]
- 21.Regenold WT, Phatak P, Marano CM, Sassan A, Conley RR, Kling MA. Elevated cerebrospinal fluid lactate concentrations in patients with bipolar disorder and schizophrenia: Implications for the mitochondrial dysfunction hypothesis. Biol Psychiatry. 2009;65:489–494. doi: 10.1016/j.biopsych.2008.11.010. [DOI] [PMC free article] [PubMed] [Google Scholar]
- 22.MacDonald ML, Naydenov A, Chu M, Matzilevich D, Konradi C. Decrease in creatine kinase messenger RNA expression in the hippocampus and dorsolateral prefrontal cortex in bipolar disorder. Bipolar Disord. 2006;8:255–264. doi: 10.1111/j.1399-5618.2006.00302.x. [DOI] [PMC free article] [PubMed] [Google Scholar]
- 23.Lenaz G, Genova ML. Structural and functional organization of the mitochondrial respiratory chain: a dynamic super-assembly. Int J Biochem Cell Biol. 2009;41:1750–1772. doi: 10.1016/j.biocel.2009.04.003. [DOI] [PubMed] [Google Scholar]
- 24.Konradi C, Eaton M, MacDonald ML, Walsh J, Benes FM, Heckers S. Molecular evidence for mitochondrial dysfunction in bipolar disorder. Arch Gen Psychiatry. 2004;61:300–308. doi: 10.1001/archpsyc.61.3.300. [DOI] [PubMed] [Google Scholar]
- 25.Iwamoto K, Bundo M, Kato T. Altered expression of mitochondria-related genes in postmortem brains of patients with bipolar disorder or schizophrenia, as revealed by large-scale DNA microarray analysis. Hum Mol Genet. 2005;14:241–253. doi: 10.1093/hmg/ddi022. [DOI] [PubMed] [Google Scholar]
- 26.Sun X, Wang JF, Tseng M, Young LT. Downregulation in components of the mitochondrial electron transport chain in the postmortem frontal cortex of subjects with bipolar disorder. J Psychiatry Neurosci. 2006;31:189–196. [PMC free article] [PubMed] [Google Scholar]
- 27.Naydenov AV, MacDonald ML, Ongur D, Konradi C. Differences in lymphocyte electron transport gene expression levels between subjects with bipolar disorder and normal controls in response to glucose deprivation stress. Arch Gen Psychiatry. 2007;64:555–564. doi: 10.1001/archpsyc.64.5.555. [DOI] [PubMed] [Google Scholar]
- 28.Ben-Shachar D, Karry R. Neuroanatomical pattern of mitochondrial complex I pathology varies between schizophrenia, bipolar disorder and major depression. PLoS ONE. 2008;3:e3676. doi: 10.1371/journal.pone.0003676. [DOI] [PMC free article] [PubMed] [Google Scholar]
- 29.Nakatani N, Hattori E, Ohnishi T, et al. Genome-wide expression analysis detects eight genes with robust alterations specific to bipolar I disorder: Relevance to neuronal network perturbation. Hum Mol Genet. 2006;15:1949–1962. doi: 10.1093/hmg/ddl118. [DOI] [PubMed] [Google Scholar]
- 30.Vawter MP, Tomita H, Meng F, et al. Mitochondrial-related gene expression changes are sensitive to agonal-pH state: Implications for brain disorders. Mol Psychiatry. 2006;11(615):63–79. doi: 10.1038/sj.mp.4001830. [DOI] [PMC free article] [PubMed] [Google Scholar]
- 31.Beech RD. Thyroid hormones, affective disorders, and gene-regulation: a reexamination. Psychiatric Annals. 1997;27:773–778. [Google Scholar]
- 32.Beech RD, Duman RS. The role of transcription factors in the biology of depression. In: Licinio J, Wong M-L, editors. Biology of Depression: Towards a Novel Understanding and Therapeutic Strategies. Weinheim: Wiley-VCH; 2005. pp. 823–854. [Google Scholar]
- 33.Duman RS, Heninger GR, Nestler EJ. A molecular and cellular theory of depression. Arch Gen Psychiatry. 1997;54:597–606. doi: 10.1001/archpsyc.1997.01830190015002. [DOI] [PubMed] [Google Scholar]
- 34.Manji HK, Moore GJ, Chen G. Clinical and preclinical evidence for the neurotrophic effects of mood stabilizers: implications for the pathophysiology and treatment of manic-depressive illness. Biol Psychiatry. 2000;48:740–754. doi: 10.1016/s0006-3223(00)00979-3. [DOI] [PubMed] [Google Scholar]
- 35.Kuo CT, Leiden JM. Transcriptional regulation of T lymphocyte development and function. Annu Rev Immunol. 1999;17:149–187. doi: 10.1146/annurev.immunol.17.1.149. [DOI] [PubMed] [Google Scholar]
- 36.Jumaa H, Hendriks RW, Reth M. B cell signaling and tumorigenesis. Annu Rev Immunol. 2005;23:415–445. doi: 10.1146/annurev.immunol.23.021704.115606. [DOI] [PubMed] [Google Scholar]
- 37.Fischer AM, Katayama CD, Pages G, Pouyssegur J, Hedrick SM. The role of erk1 and erk2 in multiple stages of T cell development. Immunity. 2005;23:431–443. doi: 10.1016/j.immuni.2005.08.013. [DOI] [PubMed] [Google Scholar]
- 38.Feistritzer C, Mosheimer BA, Sturn DH, Riewald M, Patsch JR, Wiedermann CJ. Endothelial protein C receptor-dependent inhibition of migration of human lymphocytes by protein C involves epidermal growth factor receptor. J Immunol. 2006;176:1019–1025. doi: 10.4049/jimmunol.176.2.1019. [DOI] [PubMed] [Google Scholar]
- 39.Gladkevich A, Kauffman HF, Korf J. Lymphocytes as a neural probe: potential for studying psychiatric disorders. Prog Neuro-Psychopharmacol Biol Psychiatry. 2004;28:559–576. doi: 10.1016/j.pnpbp.2004.01.009. [DOI] [PubMed] [Google Scholar]
- 40.Sullivan PF, Fan C, Perou CM. Evaluating the comparability of gene expression in blood and brain. Am J Med Genet B Neuropsychiatr Genet. 2006;141:261–268. doi: 10.1002/ajmg.b.30272. [DOI] [PubMed] [Google Scholar]
- 41.Chetcuti A, Adams LJ, Mitchell PB, Schofield PR. Microarray gene expression profiling of mouse brain mRNA in a model of lithium treatment. Psychiatr Genet. 2008;18:64–72. doi: 10.1097/YPG.0b013e3282fb0051. [DOI] [PubMed] [Google Scholar]
- 42.McQuillin A, Rizig M, Gurling HM. A microarray gene expression study of the molecular pharmacology of lithium carbonate on mouse brain mRNA to understand the neurobiology of mood stabilization and treatment of bipolar affective disorder. Pharmacogenet Genomics. 2007;17:605–617. doi: 10.1097/FPC.0b013e328011b5b2. [DOI] [PubMed] [Google Scholar]
- 43.Seelan RS, Khalyfa A, Lakshmanan J, Casanova MF, Parthasarathy RN. Deciphering the lithium transcriptome: Microarray profiling of lithium-modulated gene expression in human neuronal cells. Neuroscience. 2008;151:1184–1197. doi: 10.1016/j.neuroscience.2007.10.045. [DOI] [PubMed] [Google Scholar]
- 44.American Psychiatric Association. Diagnostic and Statistical Manual of Mental Disorders. 4. Washington, DC: American Psychiatric Association; 2000. Text Revision (DSM-IV-TR) [Google Scholar]
- 45.First MB, Spitzer RL, Gibbon M, Williams J. Structured Clinical Interview for DSM-IV Axis I Disorders. New York: Biometrics Research Department, New York State Psychiatric Institute; 1996. Patient Edition (SCID-I/P, Version 2.0) [Google Scholar]
- 46.Hamilton M. A rating scale for depression. J Neurol Neurosurg Psychiatry. 1960;23:56–62. doi: 10.1136/jnnp.23.1.56. [DOI] [PMC free article] [PubMed] [Google Scholar]
- 47.Mazure C, Nelson JC, Price LH. Reliability and validity of the symptoms of major depressive illness. Arch Gen Psychiatry. 1986;43:451–456. doi: 10.1001/archpsyc.1986.01800050053006. [DOI] [PubMed] [Google Scholar]
- 48.Montgomery SA, Åsberg M. A new depression scale designed to be sensitive to change. Br J Psychiatry. 1979;134:382–389. doi: 10.1192/bjp.134.4.382. [DOI] [PubMed] [Google Scholar]
- 49.Hamilton M. The assessment of anxiety states by ratings. Br J Med Psychol. 1959;32:50–55. doi: 10.1111/j.2044-8341.1959.tb00467.x. [DOI] [PubMed] [Google Scholar]
- 50.Young RC, Biggs JT, Ziegler VE, Meyer DA. A rating scale for mania: reliability, validity and sensitivity. Br J Psychiatry. 1978;133:429–435. doi: 10.1192/bjp.133.5.429. [DOI] [PubMed] [Google Scholar]
- 51.QIAGEN. PAXgene Blood RNA Kit Handbook. Valencia: QIAGEN; 2005. [Google Scholar]
- 52.Illumina, Inc. Technical Support. San Diego: Illumina, Inc; 2009. Chapter 4: Normalization and Differential Analysis. BeadStudio Gene Expression Module v32 User Guide. [Google Scholar]
- 53.Barnes M, Freudenberg J, Thompson S, Aronow B, Pavlidis P. Experimental comparison and cross-validation of the Affymetrix and Illumina gene expression analysis platforms. Nucleic Acids Res. 2005;33:5914–5923. doi: 10.1093/nar/gki890. [DOI] [PMC free article] [PubMed] [Google Scholar]
- 54.Reiner A, Yekutieli D, Benjamini Y. Identifying differentially expressed genes using false discovery rate controlling procedures. Bioinformatics. 2003;19:368–375. doi: 10.1093/bioinformatics/btf877. [DOI] [PubMed] [Google Scholar]
- 55.Storey JD, Tibshirani R. Statistical significance for genomewide studies. Proc Natl Acad Sci USA. 2003;100:9440–9445. doi: 10.1073/pnas.1530509100. [DOI] [PMC free article] [PubMed] [Google Scholar]
- 56.Ptitsyn AA, Weil MM, Thamm DH. Systems biology approach to identification of biomarkers for metastatic progression in cancer. BMC Bioinformatics. 2008;9 (Suppl 9):S8. doi: 10.1186/1471-2105-9-S9-S8. [DOI] [PMC free article] [PubMed] [Google Scholar]
- 57.Stamova BS, Apperson M, Walker WL, et al. Identification and validation of suitable endogenous reference genes for gene expression studies in human peripheral blood. BMC Med Genomics. 2009;2:49. doi: 10.1186/1755-8794-2-49. [DOI] [PMC free article] [PubMed] [Google Scholar]
- 58.Pachot A, Blond JL, Mougin B, Miossec P. Peptidylpropyl isomerase B (PPIB): a suitable reference gene for mRNA quantification in peripheral whole blood. J Biotechnol. 2004;114:121–124. doi: 10.1016/j.jbiotec.2004.07.001. [DOI] [PubMed] [Google Scholar]
- 59.Hock MB, Kralli A. Transcriptional control of mitochondrial biogenesis and function. Annu Rev Physiol. 2009;71:177–203. doi: 10.1146/annurev.physiol.010908.163119. [DOI] [PubMed] [Google Scholar]
- 60.Niizuma K, Endo H, Chan PH. Oxidative stress and mitochondrial dysfunction as determinants of ischemic neuronal death and survival. J Neurochem. 2009;1091(Suppl):133–138. doi: 10.1111/j.1471-4159.2009.05897.x. [DOI] [PMC free article] [PubMed] [Google Scholar]
- 61.Tomiyama A, Serizawa S, Tachibana K, et al. Critical role for mitochondrial oxidative phosphorylation in the activation of tumor suppressors Bax and Bak. J Natl Cancer Inst. 2006;98:1462–1473. doi: 10.1093/jnci/djj395. [DOI] [PubMed] [Google Scholar]
- 62.Mantel CR, Wang RH, Deng C, Broxmeyer HE. Sirt1, notch and stem cell “age asymmetry. Cell Cycle. 2008;7:2821–2825. doi: 10.4161/cc.7.18.6517. [DOI] [PubMed] [Google Scholar]
- 63.de la Pena P, Bornstein B, del Hoyo P, et al. Mitochondrial dysfunction associated with a mutation in the Notch3 gene in a CADASIL family. Neurology. 2001;57:1235–1238. doi: 10.1212/wnl.57.7.1235. [DOI] [PubMed] [Google Scholar]
- 64.Gloire G, Legrand-Poels S, Piette J. NF-kappaB activation by reactive oxygen species: Fifteen years later. Biochem Pharmacol. 2006;72:1493–1505. doi: 10.1016/j.bcp.2006.04.011. [DOI] [PubMed] [Google Scholar]
- 65.Jones WK, Brown M, Ren X, He S, McGuinness M. NF-kappaB as an integrator of diverse signaling pathways: the heart of myocardial signaling? Cardiovasc Toxicol. 2003;3:229–254. doi: 10.1385/ct:3:3:229. [DOI] [PubMed] [Google Scholar]
- 66.Calandra T, Roger T. Macrophage migration inhibitory factor: a regulator of innate immunity. Nat Rev Immunol. 2003;3:791–800. doi: 10.1038/nri1200. [DOI] [PMC free article] [PubMed] [Google Scholar]
- 67.Washizuka S, Kakiuchi C, Mori K, et al. Association of mitochondrial complex I subunit gene NDUFV2 at 18p11 with bipolar disorder. Am J Med Genet B Neuropsychiatr Genet. 2003;120B:72–78. doi: 10.1002/ajmg.b.20041. [DOI] [PubMed] [Google Scholar]
- 68.Washizuka S, Kakiuchi C, Mori K, Tajima O, Akiyama T, Kato T. Expression of mitochondria-related genes in lymphoblastoid cells from patients with bipolar disorder. Bipolar Disord. 2005;7:146–152. doi: 10.1111/j.1399-5618.2005.00184.x. [DOI] [PubMed] [Google Scholar]
- 69.Xu C, Li PP, Kennedy JL, et al. Further support for association of the mitochondrial complex I subunit gene NDUFV2 with bipolar disorder. Bipolar Disord. 2008;10:105–110. doi: 10.1111/j.1399-5618.2008.00535.x. [DOI] [PubMed] [Google Scholar]
- 70.Washizuka S, Iwamoto K, Kakiuchi C, Bundo M, Kato T. Expression of mitochondrial complex I subunit gene NDUFV2 in the lymphoblastoid cells derived from patients with bipolar disorder and schizophrenia. Neurosci Res. 2009;63:199–204. doi: 10.1016/j.neures.2008.12.004. [DOI] [PubMed] [Google Scholar]
- 71.Carter KL, Cahir-McFarland E, Kieff E. Epstein-Barr virus-induced changes in B-lymphocyte gene expression. J Virol. 2002;76:10427–10436. doi: 10.1128/JVI.76.20.10427-10436.2002. [DOI] [PMC free article] [PubMed] [Google Scholar]
- 72.Chen A, Zhao B, Kieff E, Aster JC, Wang F. EBNA-3B- and EBNA-3C-regulated cellular genes in Epstein-Barr virus-immortalized lymphoblastoid cell lines. J Virol. 2006;80:10139–10150. doi: 10.1128/JVI.00854-06. [DOI] [PMC free article] [PubMed] [Google Scholar]
- 73.Niller HH, Wolf H, Minarovits J. Epigenetic dysregulation of the host cell genome in Epstein-Barr virus-associated neoplasia. Semin Cancer Biol. 2009;19:158–164. doi: 10.1016/j.semcancer.2009.02.012. [DOI] [PubMed] [Google Scholar]
- 74.Faumont N, Durand-Panteix S, Schlee M, et al. c-Myc and Rel/NF-kappaB are the two master transcriptional systems activated in the latency III program of Epstein-Barr virus-immortalized B cells. J Virol. 2009;83:5014–5027. doi: 10.1128/JVI.02264-08. [DOI] [PMC free article] [PubMed] [Google Scholar]
- 75.Dror N, Klein E, Karry R, et al. State-dependent alterations in mitochondrial complex I activity in platelets: a potential peripheral marker for schizophrenia. Mol Psychiatry. 2002;7:995–1001. doi: 10.1038/sj.mp.4001116. [DOI] [PubMed] [Google Scholar]
- 76.Bachmann RF, Wang Y, Yuan P, et al. Common effects of lithium and valproate on mitochondrial functions: protection against methamphetamine-induced mitochondrial damage. Int J Neuropsychopharmacol. 2009;12:805–822. doi: 10.1017/S1461145708009802. [DOI] [PMC free article] [PubMed] [Google Scholar]
- 77.Maurer IC, Schippel P, Volz HP. Lithium-induced enhancement of mitochondrial oxidative phosphorylation in human brain tissue. Bipolar Disord. 2009;11:515–522. doi: 10.1111/j.1399-5618.2009.00729.x. [DOI] [PubMed] [Google Scholar]
- 78.Rezin GT, Cardoso MR, Goncalves CL, et al. Inhibition of mitochondrial respiratory chain in brain of rats subjected to an experimental model of depression. Neurochem Int. 2008;53:395–400. doi: 10.1016/j.neuint.2008.09.012. [DOI] [PubMed] [Google Scholar]
- 79.Diaz F, Moraes CT. Mitochondrial biogenesis and turnover. Cell Calcium. 2008;44:24–35. doi: 10.1016/j.ceca.2007.12.004. [DOI] [PMC free article] [PubMed] [Google Scholar]
- 80.Andreazza AC, Shao L, Wang JF, Young LT. Mitochondrial complex I activity and oxidative damage to mitochondrial proteins in the prefrontal cortex of patients with bipolar disorder. Arch Gen Psychiatry. 2010;67:360–368. doi: 10.1001/archgenpsychiatry.2010.22. [DOI] [PubMed] [Google Scholar]
- 81.Rezin GT, Amboni G, Zugno AI, Quevedo J, Streck EL. Mitochondrial dysfunction and psychiatric disorders. Neurochem Res. 2009;34:1021–1029. doi: 10.1007/s11064-008-9865-8. [DOI] [PubMed] [Google Scholar]
- 82.Rollins B, Martin MV, Sequeira PA, et al. Mitochondrial variants in schizophrenia, bipolar disorder, and major depressive disorder. PLoS ONE. 2009;4:e4913. doi: 10.1371/journal.pone.0004913. [DOI] [PMC free article] [PubMed] [Google Scholar]
- 83.Mootha VK, Handschin C, Arlow D, et al. Erralpha and Gabpa/b specify PGC-1alpha-dependent oxidative phosphorylation gene expression that is altered in diabetic muscle. Proc Natl Acad Sci USA. 2004;101:6570–6575. doi: 10.1073/pnas.0401401101. [DOI] [PMC free article] [PubMed] [Google Scholar]
- 84.Soyal S, Krempler F, Oberkofler H, Patsch W. PGC-1alpha: a potent transcriptional cofactor involved in the pathogenesis of type 2 diabetes. Diabetologia. 2006;49:1477–1488. doi: 10.1007/s00125-006-0268-6. [DOI] [PubMed] [Google Scholar]
Associated Data
This section collects any data citations, data availability statements, or supplementary materials included in this article.