

Abstract
Synchronous firing is commonly observed in the brain, but its underlying mechanisms and neurobiological meaning remain debated. Most commonly, synchrony is attributed either to electrical coupling by gap junctions or to shared excitatory inputs. In the cerebral cortex and hippocampus, fast-spiking (FS) or somatostatin-containing (SOM) inhibitory interneurons are electrically coupled to same-type neighbors, and each subtype-specific network tends to fire in synchrony. Electrical coupling across subtypes is weak or absent, but SOM–FS and FS–FS pairs are often connected by inhibitory synapses. Theoretical studies suggest that purely inhibitory coupling can also promote synchrony; however, this has not been confirmed experimentally. We recorded from 74 pairs of electrically noncoupled layer 4 interneurons in mouse somatosensory cortex in vitro, and found that tonically depolarized FS–FS and SOM–FS pairs connected by unidirectional or bidirectional inhibitory synapses often fired within 1 ms of each other. Using a novel, jitter-based measure of synchrony, we found that synchrony correlated with inhibitory coupling strength. Importantly, synchrony was resistant to ionotropic glutamate receptors antagonists but was strongly reduced when GABAA receptors were blocked, confirming that in our experimental system IPSPs were both necessary and sufficient for synchrony. Submillisecond firing lags emerged in a computer simulation of pairs of spiking neurons, in which the only assumed interaction between neurons was by inhibitory synapses. We conclude that cortical interneurons are capable of synchronizing both within and across subtypes, and that submillisecond coordination of firing can arise by mutual synaptic inhibition alone, with neither shared inputs nor electrical coupling.
Introduction
Whether and to what degree the mammalian brain encodes information in the mean firing rate of its constituent neurons (“rate code”), in the fine temporal structure of their spike trains (“temporal code”), or in their precise temporal relationships (“coordination code”) is a long-standing, unresolved question in neuroscience (for review, see deCharms and Zador, 2000; Richmond, 2009; Singer, 2009; Kumar et al., 2010). The most basic temporal relationship between two or more neurons is synchrony. Synchronous firing is widely observed in the CNS, but its mechanistic origin and neurobiological meaning remain debated (for review, see Lestienne, 2001; Uhlhaas et al., 2009). The temporal scale of reported synchrony varies widely between different studies in different systems, from “loose synchrony” measured in hundreds of milliseconds (Vaadia et al., 1995) to sharper coincidences with lags from 25 down to 2 ms (Wylie et al., 1995; deCharms and Merzenich, 1996; Hatsopoulos et al., 1998; Mann-Metzer and Yarom, 1999; Baker et al., 2001; Schnitzer and Meister, 2003; Schoppa, 2006). Even sharper synchrony, in which (some) spikes occur <1 ms apart, is observed in various neuronal populations, including ganglion cells in the retina (Mastronarde, 1983; Schnitzer and Meister, 2003), thalamocortical relay neurons (Alonso et al., 1996; Dan et al., 1998), hippocampal pyramidal neurons (Takahashi and Sakurai, 2009), and putative cortical inhibitory interneurons (Swadlow et al., 1998). In these studies, the only mechanisms proposed for this near-millisecond or submillisecond synchrony were either shared excitatory inputs from diverging presynaptic axons, or electrical coupling mediated by gap junctions.
The two most prevalent subtypes of cortical interneurons are fast-spiking (FS) interneurons, which preferentially target somata and proximal dendrites, and somatostatin-containing (SOM) interneurons, which preferentially target distal dendrites (Kawaguchi and Kubota, 1998). As discovered over a decade ago, neighboring cortical interneurons can be coupled either electrically, through gap junctions, chemically, through GABAergic synapses, or both (Tamás et al., 1998, 2000; Galarreta and Hestrin, 1999; Gibson et al., 1999; Fukuda and Kosaka, 2000b; Thomson et al., 2002). Electrical coupling, observed almost exclusively in homotypic pairs (e.g., FS–FS or SOM–SOM), was shown to promote precisely synchronous firing (Galarreta and Hestrin, 1999; Gibson et al., 1999; Beierlein et al., 2000; Tamás et al., 2000; Deans et al., 2001; Szabadics et al., 2001; Blatow et al., 2003; Galarreta et al., 2004; Mancilla et al., 2007; Fanselow et al., 2008). Theoretical studies predict that inhibitory coupling alone can also promote synchrony (Wang and Rinzel, 1992; Golomb and Rinzel, 1994; Van Vreeswijk et al., 1994; Terman et al., 1998); however, firing synchrony in a biological network with purely inhibitory coupling was reported in only one previous study (Gibson et al., 2005), and a causative relationship between IPSPs and synchrony has never been confirmed experimentally. Here, we show that chemically but not electrically connected FS–FS and SOM–FS pairs fired action potentials with submillisecond lags and that synchrony strength correlated with, and was dependent on, unidirectional or reciprocal GABAergic synapses between the two neurons.
Materials and Methods
Animals and solutions.
All experimental protocols were approved by the West Virginia University Animal Care and Use Committee. Experiments were conducted on juvenile mice (postnatal days 15–22) of transgenic lines X94 [Tg(Gad1/EGFP)94Agmo/J] and G42 [Tg(Gad1-EGFP)G42Zjh/J], both available from The Jackson Laboratory (stock numbers 006334 and 007677, respectively). Mouse lines were maintained as hemizygotes, by breeding transgenic males with outbred wild-type females (CD-1; Charles River Laboratories). For experiments, breedings were conducted also between transgenic animals, to increase the fraction of green fluorescent protein (GFP)-expressing pups. Coronal brain slices of somatosensory (barrel) cortex, 300 μm thick, were prepared as described (Ma et al., 2006). Slices were continuously superfused with 32°C oxygenated artificial CSF (ACSF) containing the following (in mm): 126 NaCl, 3 KCl, 1.25 NaH2PO4, 2 CaCl2, 1.3 MgSO4, 26 NaHCO3, and 20 d-glucose. To block GABAA, AMPA, and NMDA receptors, gabazine, 6-cyano-7-nitroquinoxaline-2,3-dione disodium (CNQX) [or DNQX (6,7-dinitroquinoxaline-2,3-dione disodium salt)], and/or d-(−)-2-amino-5-phosphonopentanoic acid (APV), all from Tocris, were added to the ACSF, at final concentrations of 10, 20, and 20 μm, respectively.
Electrophysiological recordings and analysis.
Whole-cell pipettes were prepared as described (Ma et al., 2006). Dual whole-cell recordings were performed from adjacent layer 4 SOM and FS interneurons using the dual-channel Axoclamp 2B amplifier (Molecular Devices). Records were filtered at 3 kHz and digitized at 20 kHz with a National Instruments ADC board. Data acquisition was controlled by in-house software written in the LabView environment (National Instruments). To evoke firing, one cell was depolarized tonically by constant current, while the other cell was depolarized phasically by 600 ms current pulses at 5–10 s intervals. In connected pairs, the “dominant” cell (i.e., the cell evoking the stronger IPSP) was typically selected as the phasic cell. Pairs were included in the analysis if at least 400 spikes were recorded from each neuron. To minimize contamination by nonspecific effects when longer trains were recorded (e.g., synaptic fatigue, gradual changes in ionic concentrations, etc.), we limited the analysis to the first 800–1200 spikes fired by the slower neuron. Drug application was standardized as follows: a control dual spike train was elicited and recorded for 5 min, bath solution was then changed to include the drug(s), and the slice allowed to equilibrate (without any stimulation) for a 10 min period, followed by a second 5 min dual spike train. To verify effectiveness of GABAergic antagonists, unitary IPSPs were recorded in control conditions and immediately after the 10 min drug perfusion period. To verify the effectiveness of glutamatergic antagonists, an EPSP was elicited by a brief extracellular stimulation in the nearby gray matter, in control and immediately after the 10 min drug perfusion period.
Electrophysiological parameters.
Electrophysiological parameters were defined and measured as previously described (Ma et al., 2006) during the first few minutes after break-in. To measure electrical coupling, a 600 ms current step was injected alternately into one neuron or the other, hyperpolarizing it to approximately −90 mV; the coupling coefficient (CC) was defined as the ratio of the voltage deflection in the noninjected cell to the voltage deflection in the injected cell just before current offset, averaged over 10–20 sweeps and then averaged between the two directions of connectivity. Only pairs with CC < 1% were included in the current dataset. Inhibitory synaptic connections were tested by eliciting single or 20 Hz trains of action potentials in the presynaptic cell, repeated at 8 s intervals, while holding the postsynaptic cell at a depolarized potential of −50 mV; 10–20 responses were averaged. The reported membrane potentials are not corrected for the liquid junction potential and are therefore biased by approximately +8 mV.
Synchrony analysis.
The time of occurrence of all spikes was determined using a LabView built-in peak detection algorithm that fitted a quadratic polynomial to sequential groups of three data points; peak locations were determined by interpolation, so their precision exceeded the 50 μs sampling interval. For each pair, the lists of all spike times in all 600 ms segments were concatenated and used as input to subsequent analysis routines. Cross-correlation histograms were computed by binning all cross-interspike intervals (cross-ISIs) <100 ms into 2 ms bins symmetric about 0, and dividing the counts by the number of spikes in the shorter train. In this manner, cross-ISIs included in the central bin corresponded to spike pairs which were ±1 ms apart, and therefore synchronized on a submillisecond timescale. Note that only the cross-ISIs were binned, not the spike trains themselves, thus avoiding a common pitfall associated with binning spike trains, that of two near-coincident spikes falling into two adjacent bins and thereby not counted as synchronous. The reference spike train in the cross-correlogram construction was always the longer spike train (the faster neuron), which was almost always also the phasic/dominant cell. To compute the jitter-sensitive synchrony index (JSSI), a synchrony window of ± S (S = 1 ms) was centered on each of the spikes of the faster spike train, and the number SYN(S) of spikes in the slower spike train occurring within all synchrony windows was counted. This count corresponded to all spike pairs occurring at a lag of ≤1 ms, regardless of firing order, and was equal to the height of the central bin in the un-normalized cross-correlogram. A jitter window of ± J (J = 2 ms) was then centered on each of the N spikes of the slower spike train, and the probability that a randomly jittered spike will fall within a synchrony window was determined by the fraction of the jitter window that overlapped any synchrony window. This calculation yielded a series of N probabilities, in general different from each other. The probability PN(n) of exactly n synchronies, for any n ≤ N, was then calculated using an efficient recursive algorithm (Thomas and Taub, 1982). The mean and SD of the distribution PN(n) were used to calculate a Z score [=distance of the observed value of SYN(S) from the mean, in units of SD], which was used to determine the statistical significance of the synchrony. The Z score was further normalized by √N to yield the JSSI. The justification for selecting this normalization procedure is as follows. The most significant synchrony will occur when each of the N spikes of the slow train is within S of one spike in the fast train, but at least S + J away from any other spike. Under these conditions, the probability of each spike in the slow train remaining synchronous after a random jitter J is p = S/J = 0.5, and PN(n) becomes a binomial distribution with a mean of Np and a variance of Np(1 − p). The Z score becomes the following:
Dividing by √N then yields 1, the theoretically maximal JSSI. Independently generated spike trains should, on average, have a JSSI of 0. Theoretically, the JSSI can also attain negative values, indicating less-than-expected synchrony; however, we almost never encountered negative JSSI values experimentally. All computations were programmed in MathCad (PTC).
Simulation.
We constructed a spike response model (Gerstner and Kistler, 2002) based on a minimal set of assumptions, as follows. The membrane potential of each neuron was assumed to relax with a time constant τ (varied between 10 and 20 ms) toward an asymptotic value determined by the applied current, and a spike was fired whenever the threshold (set to −35 mV) was crossed from below. After a spike, the membrane potential of the presynaptic neuron decremented instantaneously by a fixed value [representing the afterhyperpolarization (AHP)], and after a delay D an inhibitory conductance G was activated in the postsynaptic neuron, causing the postsynaptic membrane potential to relax toward the inhibitory reversal potential with a time constant proportional to 1/G, for a duration RT (representing the IPSP rise time). Both the AHP and the IPSP were assumed to decay with the membrane time constant τ. We typically set D = 1 ms and RT = 2 ms, but moderate variations in these values did not affect the results qualitatively. A small amount of random noise (0.5 mV peak-to-peak) was added to the membrane potential, to generate realistic-looking autocorrelograms and cross-correlograms; noise was added independently to each cell at each integration step (0.1 ms), so no correlations were introduced. We performed a series of control simulations to test the effect of noise on synchrony, and found a weak inverse correlation—increasing the noise slightly decreased the synchrony, again attesting against any role for the introduced noise in promoting synchrony. We determined the amplitude of the IPSP for each value of the conductance G in the same manner we did in the actual experiments, by averaging simulated responses at a holding potential of −50 mV. Computations were done in MathCad.
Statistics.
Statistical tests were done by distribution-free permutation routines (Good, 1999) programmed in MathCad. Each test compared the observed value of the statistic to the distribution of 10,000 values computed from random permutations of the data; the reported p values are the fraction of equal or more extreme values in this distribution. In cases when 10,000 permutations yielded no more extreme values, the p value is designated as p < 0.0001. Two-group differences were tested by comparing means (two-tailed), equivalent to the unpaired t test; three-group differences were tested by comparing the F statistic (one-tailed), equivalent to one-way ANOVA. Significance of squared correlation coefficients (r2) was determined by a one-tailed test. Summary data are reported as mean ± SEM, where SEM is the sample SD divided by the square root of the sample size.
Results
Intrinsic and synaptic properties of layer 4 SOM and FS interneurons
To examine the role of inhibitory synapses in synchronizing firing between interneurons, we performed simultaneous whole-cell, current-clamp recordings from 74 pairs of interneurons, including 44 FS–FS pairs and 30 SOM–FS pairs, in layer 4 of the somatosensory (“barrel”) cortex, in brain slices prepared from juvenile (postnatal days 15–22) mice. Paired neurons were separated by <115 μm and were nearly always within the same layer 4 barrel. All SOM–FS and most FS–FS pairs were recorded in mouse line X94 (Ma et al., 2006), in which SOM cells were targeted by their GFP expression, with the exception of one SOM cell that did not express GFP and its identity was confirmed electrophysiologically. FS cells in X94 slices were targeted by their cell body size (large) and shape (elongated); eight additional FS–FS pairs were recorded in mouse line G42 (Chattopadhyaya et al., 2004), in which a subset of FS cells express GFP. The subtype identity of each neuron was verified by post hoc analysis of its membrane parameters and firing patterns, specifically by the values of its firing frequency adaptation and spike width at half-height; the two subtypes segregated by these two parameters into nearly non-overlapping clusters (Table 1, Fig. 1). Differences between the two subtypes in other electrophysiological parameters, such as spike height and input resistance, were also highly significant (Table 1), but these parameters had partially overlapping distributions and were therefore less useful as classifiers.
Table 1.
Intrinsic membrane parameters of layer 4 FS and SOM interneurons
| SOM (N = 30) |
FS (N = 118) |
p value | |||
|---|---|---|---|---|---|
| Mean | SEM | Mean | SEM | ||
| Age (postnatal days) | 17.4 | 0.3 | 18.2 | 0.2 | 0.09 |
| Vrest (mV) | −64.0 | 0.2 | −64.5 | 0.1 | 0.05 |
| Spike height (mV) | 72.9 | 1.2 | 64.3 | 0.8 | <0.0001 |
| Rin (MΩ) | 99.3 | 3.5 | 68.0 | 1.1 | <0.0001 |
| Spike width (ms) | 0.35 | 0.01 | 0.21 | 0.00 | <0.0001 |
| Adaptation ratio | 0.37 | 0.01 | 0.77 | 0.02 | <0.0001 |
The mean, SEM, and p value of the difference between the means of the FS and SOM groups are indicated, for postnatal age and for five electrophysiological parameters, for all neurons in our sample.
Figure 1.

Firing patterns and spike parameters of FS and SOM interneurons. A, B, Voltage responses (top traces) of representative FS and SOM cells to hyperpolarizing and depolarizing intracellular current steps (bottom traces). Note the pronounced difference in firing frequency adaptation. C, Superimposed, color-coded spike waveforms of representative FS and SOM interneurons (the SOM spike is larger and slower). D, Scatterplot of adaptation ratio and spike width for all cells. Note the clear segregation of the SOM and FS populations, and the intermixing of FS interneurons from X94 and G42 mice. Note also that the non-GFP-expressing SOM interneuron was not different from the others. The dotted lines indicate the cutoff values (adaptation ratio of 0.47; spike width of 0.28 ms) that best separate the two populations.
Consistent with previous reports in the rat (Gibson et al., 1999, 2005), electrical coupling in SOM–FS pairs was rare (17%) and, when present, always weak (CC < 1%). FS–FS pairs were more often coupled electrically (44%), with approximately one-half of the coupled pairs moderately coupled (1% < CC < 3%) and the rest weakly coupled. With one exception, all electrically coupled pairs were <75 μm apart, but within that range there was no correlation between cell–cell separation and coupling coefficient. Since the current report deals with the role of chemical synapses in synchrony, only noncoupled or weakly coupled FS–FS pairs (a total of 44 pairs) were selected for additional analysis. Interestingly, electrical coupling (of any magnitude) was observed only among FS–FS or SOM–FS pairs that were also connected chemically in at least one direction (see next paragraph), suggesting a possible link between electrical and chemical synaptogenesis. SOM–SOM pairs were always coupled electrically but never connected chemically and are therefore not included in this report.
Consistent with previous studies in other species (Tamás et al., 1998; Galarreta and Hestrin, 1999; Gibson et al., 1999, 2005; Thomson et al., 2002; Beierlein et al., 2003), FS–FS and SOM–FS pairs were often connected by one-way or reciprocal inhibitory synapses (Table 2, Fig. 2). The probability of a one-way connection in our dataset was 0.55 for FS→FS, 0.57 for FS→SOM, and 0.73 for SOM→FS connections, in good agreement with previous estimates in the rat (0.46, 0.56, 0.70, respectively) (Gibson et al., 1999). Overall, 78% of all interneuron pairs were synaptically connected; as explained below, this is likely to be an underestimate of the true connectivity. The probability of a reciprocal connection was 0.39 for FS–FS pairs (compare to 0.30, the squared one-way probability) and 0.40 for SOM–FS pairs (compare to 0.42, the product of the two one-way probabilities); Fisher's exact test revealed a small bias in favor of reciprocal connectivity for FS–FS pairs (p = 0.046) but not for SOM–FS pairs (p = 0.55).
Table 2.
Synaptic connectivity between layer 4 FS and SOM interneurons
| Not connected | → | ← | ⇆ | Total | |
|---|---|---|---|---|---|
| FS–FS | 13 | 14 | 17 | 44 | |
| SOM–FS | 3 | 10 | 5 | 12 | 30 |
| Total | 16 | 29 | 29 | 74 |
The number of recorded pairs is indicated for each category of connection. Note that there are three categories for SOM–FS pairs (SOM→FS, FS→SOM, and reciprocal) but only two categories for FS–FS pairs (one-way and reciprocal).
Figure 2.

Synaptic connectivity between FS and SOM interneurons. Representative records from unidirectionally (top) and bidirectionally (bottom) connected FS–FS (left) and SOM–FS (right) pairs of layer 4 interneurons; simultaneous records from each pair are shifted vertically and color-coded red or blue. In each panel, the bottom traces show the action potentials fired by the presynaptic neuron and the top traces show the averaged postsynaptic response, recorded at a holding potential of −50 mV. Capacitive artifacts, which were more noticeable on channel 2 of the amplifier (blue traces), are blanked. The diagrams illustrate the recording configuration.
Submillisecond synchrony between interneurons
To examine temporal relationships between interneurons, we elicited trains of action potentials in simultaneously recorded cells by suprathreshold depolarization (see Materials and Methods). Examination of the spike trains of synaptically connected FS–FS and SOM–FS pairs revealed many occurrences of submillisecond firing lags between the paired interneurons. Figure 3 illustrates such synchronous firing in one unidirectionally and one reciprocally connected pair from each group; in each panel, spike pairs occurring with submillisecond lags are indicated by asterisks above the top trace, and are replotted at an expanded timescale in the bottom trace. Submillisecond synchrony did not require that the two cells fire at the same, or even similar frequencies. This is illustrated in Figure 4, in a reciprocally connected FS–FS pair (left) and a unidirectionally connected FS–SOM pair (right): in each pair, the firing frequency of the one cell was kept around 70–80 Hz while the other cell was induced to fire at lower frequencies, varied over a twofold to threefold range. Regardless of frequency, submillisecond spike coincidences were observed (note asterisks). In general, only a fraction of all spikes from any given pair were synchronized at a submillisecond timescale (see below), with the remaining spikes distributed approximately evenly throughout all phases of the opponent ISI. However, in some synaptically connected pairs, we observed a tendency for firing both in synchrony and in antiphase (midway through the opponent ISI), giving rise to alternating runs of synchrony and “antisynchrony” (data not shown). This bistability was observed mostly at lower firing rates (∼40–70 Hz), as previously reported (Gibson et al., 2005; Merriam et al., 2005), and will not be further discussed here.
Figure 3.
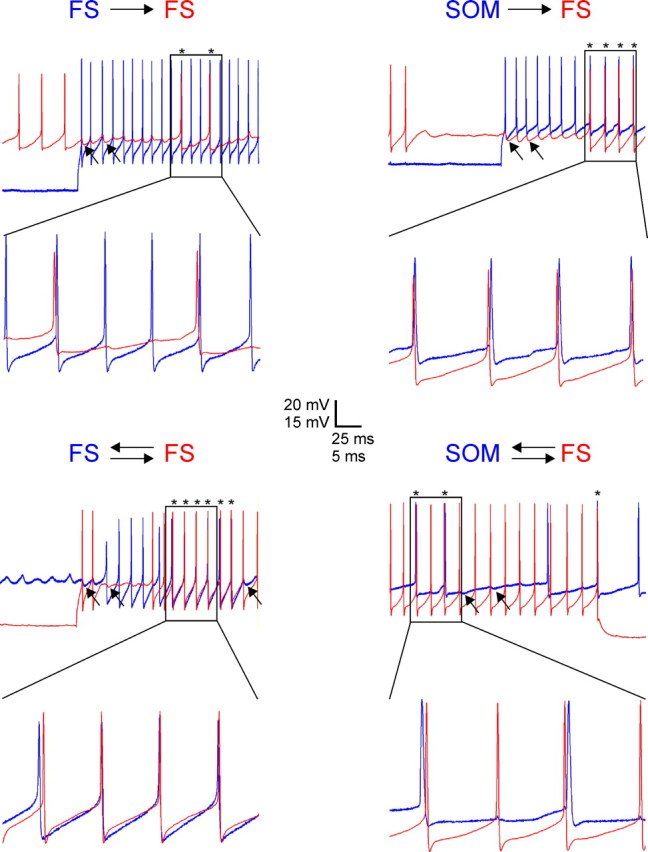
Submillisecond firing lags between FS and SOM interneurons. Representative records from unidirectionally (top) and bidirectionally (bottom) connected FS–FS (left) and SOM–FS (right) pairs of layer 4 interneurons; simultaneous records from each pair are superimposed and color-coded red or blue. In each panel, the top traces show 250-ms-long segments of firing induced by intracellular current injection into both cells, with spike pairs occurring at submillisecond lags indicated by asterisks. A 50 ms segment is shown at an expanded timescale in the bottom traces. The arrows point to examples of IPSPs.
Figure 4.
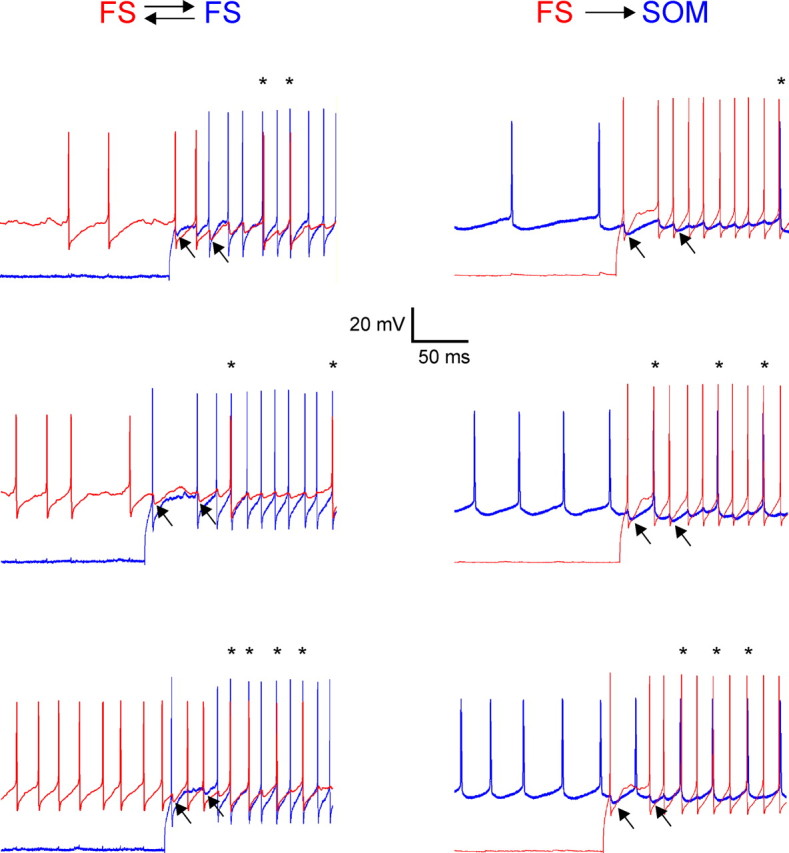
Submillisecond synchrony occurred at different firing frequencies. Records from bidirectionally connected FS–FS (left) and unidirectionally connected FS–SOM (right) pairs of layer 4 interneurons; simultaneous records from each pair are superimposed and color-coded red or blue. In each pair, the phasically firing neuron was kept at a constant firing rate, whereas the tonically firing neuron was depolarized to three different firing rates. In all cases, submillisecond spike lags (asterisks above spikes) were observed. The arrows point to examples of IPSPs.
To quantify the observed synchrony, we computed spike cross-correlograms, in which counts of all cross-ISIs <100 ms were collected in 2-ms-wide bins and normalized by the number of spikes in the slower train; Figure 5 illustrates averaged cross-correlograms of all nonconnected (top) and unidirectionally (middle) and reciprocally connected pairs (bottom) for each of the two groups. In all synaptically connected pairs, the cross-correlogram exhibited a sharp, single bin-wide peak at 0 time lag (Fig. 5, filled black). The height of this central bin indicates the raw synchrony rate—the probability that, given the occurrence of a spike in the reference cell, a spike in the target cell will occur within ±1 ms. This rate was, on average, 0.19 ± 0.02, 0.31 ± 0.03, and 0.34 ± 0.03 for nonconnected and unidirectionally and bidirectionally connected FS–FS pairs, respectively, and 0.15 ± 0.00, 0.27 ± 0.02, and 0.34 ± 0.03 for SOM–FS pairs, respectively. There were no significant difference within each category of connectivity between the FS–FS and SOM–FS groups; however, the differences in synchrony rate between synaptically connected and nonconnected pairs within each group were highly significant (p < 0.0001 and p = 0.01, respectively).
Figure 5.

Cross-correlation histograms reveal excess of submillisecond spike lags. Raw cross-correlograms of spike lags in FS–FS (left) and SOM–FS (right) pairs, averaged from all unconnected (top), unidirectionally connected (middle), and bidirectionally connected (bottom) pairs. In one-way connections, the presynaptic cell was used as the reference cell; the center right correlogram is an average of both SOM→FS and FS→SOM pairs. Bin width is 2 ms; the central bin (indicating lags of ±1 ms) is filled black. Error bars represent SEM.
The one-way or bidirectional IPSP was reflected in the cross-correlograms as a “dip” to one or both sides of the central bin, respectively; such dips are most often interpreted as evidence for monosynaptic inhibition (Perkel et al., 1967; Moore et al., 1970). Interestingly, cross-correlograms generated from some of the seemingly nonconnected pairs exhibited an inhibitory dip, and cross-correlograms generated from some of the pairs with an apparent one-way connection exhibited a dual dip on both sides of the central bin (data not shown). Although it is theoretically possible that dips in cross-correlograms of nonconnected pairs reflected indirect inhibition mediated by intercalated neurons (e.g., by interneurons electrically coupled to one of the two cells), it is not clear why such disynaptic IPSPs, if reliable enough to be reflected in the cross-correlogram, were not observed in our direct recordings. A more plausible explanation is that these dips reflected real connectivity and that the cross-correlograms were a more sensitive measure of connectivity than our direct recordings. In other words, the connectivity determined by direct recording (Fig. 2) could have been an underestimate of the true connectivity. Several reasons could underlie such an underestimate. For one, relatively small IPSPs could have escaped detection by our current-clamp recording procedure, which was done at a holding potential of −50 mV, relatively close to the GABAergic reversal potential. Such small IPSPs would still be effective at curtailing firing when the postsynaptic cell was depolarized above firing threshold, because of the increased driving force on the Cl− conductance. It is also worth noting that many interneurons have axons that emanate from a dendritic process (Ma et al., 2006). Therefore, synaptic boutons and gap junctions that occur more distally on the dendrite will have better access to the spike initiation zone than to the cell body, and may influence firing even when too attenuated for detection by a somatic microelectrode.
The raw synchrony rate (the height of the central bin in the cross-correlogram) cannot be used directly to quantify synchrony, because one needs to correct this value for chance coincidences of spikes. Methods commonly used for such a correction suffer from various limitations (Brody, 1999), limitations that can be mostly avoided by using jitter-based methods (Hatsopoulos et al., 2003). Formally, jitter methods test the null hypothesis that the precision of spike timing in the system is no finer than ±J, and therefore a small random perturbation (“jitter”) of up to ±J in the timing of each spike should not reduce the observed synchrony. Most previous implementation of the jitter method tested this null hypothesis by constructing surrogate spike trains in which Monte Carlo-generated jitter was added to the timing of each spike; in contrast, we developed an algorithm that computed the probability density for random synchrony exactly and assigned a Z score to the observed synchrony (see Materials and Methods). The computed Z score was then normalized by the square root of the number of spikes in the slower train, resulting in an index that we termed the JSSI. With our choice of J = 2 ms, the maximal theoretical JSSI is 1 (see Materials and Methods), whereas independently firing pairs should have a JSSI of 0. To validate this novel measure of synchrony, we compared the JSSI to the excess count index (ECI), a synchrony index based on the cross-correlogram. For cross-correlograms binned and normalized as described in Materials and Methods, the ECI was defined as the difference between the height of the central bin and the average of the two off-center bins. The two indices were highly correlated (r2 = 0.93 and 0.89 for FS–FS and SOM–FS pairs, respectively). However, because the JSSI not only quantifies the synchrony but also provides an intrinsic measure of firing precision with a corresponding statistical significance, we used it in all subsequent analysis.
In synaptically nonconnected pairs, average JSSI values were <0.10, indicating low synchrony (Fig. 6, bottom panel). Indeed, in over one-third of nonconnected pairs, Z scores (Fig. 6, top panel) were <2, equivalent to a p-value of > 0.05, and the null hypothesis (that firing precision was not better than ±2 ms) could not be rejected. In contrast, in pairs connected by one-way or reciprocal inhibitory synapses, the average JSSI value was ∼0.20, and in 91% of all connected pairs Z scores were >3.3, allowing us to reject the null hypothesis with a confidence level of p < 0.001. Differences in JSSI values between synaptically connected and nonconnected pairs were highly significant (p < 0.0001 in FS–FS pairs; p = 0.01 in SOM–FS pairs). JSSI values of pairs with a two-way IPSP were significantly greater than those of one-way connected pairs in SOM–FS pairs (p = 0.01), but in FS–FS pairs there was no significant difference in synchrony between one-way and reciprocal connections (p = 0.62).
Figure 6.

Average Z scores and JSSI values for different patterns of connectivity. Error bars are SEM. Note that nonconnected pairs had average JSSI values <0.10 and Z scores that were only marginally significant; synaptically connected pairs had average JSSI values ∼0.20 and highly significant Z scores. The horizontal dotted lines indicate a Z score of 2 (equivalent to p = 0.05) and a Z score of 3.3 (equivalent to p = 0.001).
The role of IPSPs in submillisecond firing coordination between interneurons
Firing synchrony can be promoted by electrical coupling, as proposed theoretically and confirmed experimentally; however, electrical coupling between the pairs in our dataset were weak or absent. Theoretical studies and numerical simulations have also suggested that firing synchrony can be promoted by chemical inhibitory coupling alone; this, however, has rarely been reported and never confirmed experimentally. We therefore examined the dependence of the JSSI on the inhibitory coupling strength (ICS), defined as the IPSP amplitude at a holding potential of −50 mV, averaged between the two directions of connectivity (for one-way connections, the nonconnected direction was considered an IPSP of zero amplitude). JSSI values in SOM–FS pairs were well correlated with the ICS (r2 = 0.50) (Fig. 7A), but the FS–FS data points were more scattered (r2 = 0.35) (Fig. 7C). Since the squared correlation coefficient (r2) is an estimate of the fraction of the variance in the dependent variable accounted for by the variance in the independent variable, the lower r2 in the FS–FS dataset most likely reflected additional factors contributing to firing synchrony, such as the weak electrical coupling between some of the FS–FS pairs. Notably, theoretical studies have shown that electrical coupling can interact nonlinearly with chemical synaptic inhibition and that addition of even a small amount of electrical coupling to chemically connected neurons may have a large effect on synchronization (Kopell and Ermentrout, 2004).
Figure 7.

The role of IPSPs and EPSPs in promoting submillisecond firing coordination. A, C, Scatterplots of JSSI values versus the ICS for all SOM–FS (A) and FS–FS (C) pairs. Symbols representing bidirectionally connected pairs are filled gray. The linear regression lines apply to all data points and have r2 values of 0.50 (A) and 0.35 (C). B, D, The effect of blocking fast glutamate receptors (APV/CNQX), GABAA receptors (GBZ), or both (APV/CNQX/GBZ) on the JSSI, for nine SOM–FS pairs (B) and seven FS–FS pairs (D). Symbols representing the same pair are connected by lines. Note that blocking ionotropic glutamate receptors had little effect on synchrony, whereas blocking GABAA receptor profoundly reduced it.
To determine whether the correlation between synchrony and IPSP amplitudes reflected causation, and to test the role of excitatory synapses in synchrony, we repeated the recording in seven FS–FS and nine SOM–FS synaptically connected pairs while blocking GABAA receptors with gabazine (GBZ) and/or blocking ionotropic glutamate receptors with CNQX and APV (Fig. 7B,D). Six pairs were tested after a 10 min superfusion of CNQX/APV; of these, four were tested again 10 min after sequential addition of GBZ to the CNQX/APV perfusate. Five pairs were tested after 10 min in GBZ alone; five other pairs were tested directly in CNQX/APV/GBZ. The average change in JSSI values after 10 min in CNQX/APV alone was to 96 ± 4% of control value, a statistically nonsignificant change (p = 0.75), suggesting that excitatory synapses did not contribute to synchrony under the conditions of our experiments. In contrast, 10 min perfusion in GBZ alone reduced JSSI values to 18 ± 5% of control (p = 0.006), and 10 min in CNQX/APV/GBZ reduced JSSI values to 33 ± 7% compared with CNQX/APV alone (p = 0.03). Switching directly to CNQX/APV/GBZ reduced JSSI values to 27 ± 8% of control (p = 0.01). We conclude that, under our experimental conditions and in the absence of electrical coupling, GABAergic IPSPs were both necessary and sufficient for submillisecond firing synchrony between layer 4 interneurons.
A numerical simulation confirms the role of IPSPs in promoting submillisecond synchrony
To further confirm that inhibitory coupling can promote synchronous firing in the absence of any other interaction, we constructed a phenomenological “spike response model” (Gerstner and Kistler, 2002) of a pair of spiking neurons depolarized by current injections and connected only by one-way or reciprocal inhibitory synapses (see Materials and Methods). We tested different values of inhibitory conductances and varied the firing rates independently for each neuron within experimentally observed values, by varying the injected current and/or the membrane time constant. Representative simulated IPSPs of unidirectionally and bidirectionally connected pairs are illustrated in Figure 8, A and B, respectively, and representative simulated spike trains are shown in Figure 8, C and D. Averaged cross-correlograms, each computed from 10 simulated spike trains with varying spike rates and inhibitory conductances, are shown in Figure 8, E and F. As can be seen by comparing Figures 8 and 5, cross-correlograms of simulated spike trains resembled experimental ones. Specifically, either unidirectional or bidirectional IPSPs resulted in a sharp, single bin-wide peak at the center of the cross-correlogram, with a “dip” on one or both sides of the central bin, respectively. As in the experiments, JSSI values of simulated trains were positively correlated with the amplitude of the ICS (Fig. 8G,H). There were two notable differences, however, between the simulated spike trains and the experimental ones. First, in the simulation, nonconnected pairs had both positive and negative JSSI values scattered around 0, whereas experimental nonconnected pairs had non-negative JSSI values ranging from 0.02 to 0.11 (Fig. 7A,C). Second, whereas JSSI values of unidirectionally and bidirectionally connected pairs in the experimental dataset appeared to fall along the same regression line (Fig. 7A,C), in the simulated data the slope of the regression line was twice as large for bidirectional IPSPs, compared with unidirectional ones (Fig. 8G,H). For example, a simulated bidirectional IPSP of 1 mV amplitude in each direction was twice as effective in promoting synchrony as a simulated 2 mV unidirectional IPSP. Both of these discrepancies could have resulted from the underestimate of the true connectivity in our sample, as explained above (because of our failure to detect some of the connections). Alternatively, some additional, as-yet-unknown factors impinging on the biological system and affecting firing synchrony may not have been captured by the model.
Figure 8.
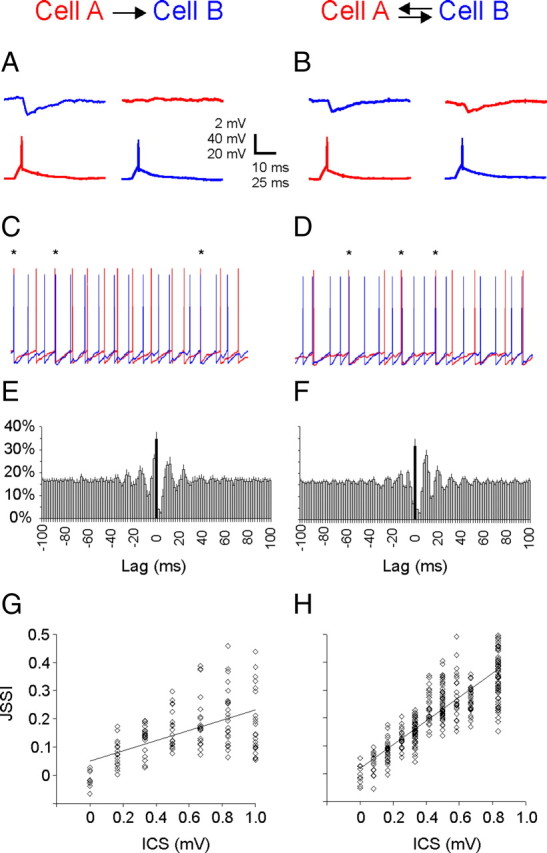
Submillisecond synchrony in simulated pairs of neurons connected by unidirectional (left) and bidirectional (right) inhibitory synapses. A, B, Representative simulated IPSPs (top traces) and presynaptic action potentials (bottom) (compare with Fig. 2). C, D, Representative simulated paired spike trains (compare with Fig. 3). E, F, Cross-correlograms averaged from ∼10 simulated pairs each (compare with Fig. 5). G, H, Scatterplots of JSSI values versus ICS (compare with Fig. 7A,C).
Discussion
We recorded pairwise from GABAergic interneurons in layer 4 of the mouse barrel cortex, and documented that both FS and SOM interneurons were capable of coordinating their firing on a submillisecond timescale, when paired with either same- or different-subtype interneurons. Since we selected pairs that were not (or were only weakly) electrically coupled, and since the experiments were done under conditions in which the great majority of neurons in the network were presumably quiescent, it was unlikely that either electrical coupling or shared excitatory inputs contributed to the synchrony, leaving coupling by GABAergic synapses as the most plausible mechanism. We confirmed this by showing that the degree of synchrony correlated with the bidirectionally averaged IPSP, was nearly unchanged after blocking ionotropic glutamate receptors, but was profoundly reduced after blocking GABAA receptors. Finally, simulated spike trains, in which the two neurons were assumed to be connected only through inhibitory synapses, reproduced submillisecond synchrony at the experimentally observed strength. This inherent, stimulus-independent propensity for synchrony between synaptically connected inhibitory interneurons is likely to be manifested during ongoing network activity in vitro and in vivo (e.g., during “UP states”), during sensory evoked responses or in the freely behaving animal, when interneurons of both subtypes are firing (Fanselow and Connors, 2010; Gentet et al., 2010; Ma et al., 2010). Whether this sharp synchrony is used by the cerebral cortex to encode, transmit, and/or store information, and what effect such synchrony has on the activity of postsynaptic excitatory neurons, remain to be determined.
A few caveats need to be kept in mind. In some of our experiments, we found evidence for weak but statistically significant synchrony of unknown origin. For example, weak synchrony was observed between some of the 16 pairs that appeared to be connected neither electrically nor chemically (Fig. 7A,C; note also the small peak at 0 lag in Fig. 5, top row of cross-correlograms), and even between some of the pairs recorded in a mixture of glutamatergic and GABAergic blockers (Fig. 7B,D). For pairs recorded in normal ACSF, such residual synchrony could have been induced by shared EPSPs coming from spontaneously firing, presynaptic excitatory neurons; but shared EPSPs could not explain residual synchrony when glutamatergic receptors were blocked. A more likely source of unexplained synchrony could have been “hidden” electrical or chemical synaptic inputs, coming from synaptic junctions on distal dendritic branches and therefore attenuated electrotonically below the detection limit of somatic recordings. Since many layer 4 interneurons have axons emanating from a proximal dendritic branch (Ma et al., 2006), such contacts could potentially be electrotonically closer to the spike generating zone in the initial segment of the axon than to the recording microelectrode. An intriguing support for this possibility is the appearance of “dips” in cross-correlograms from pairs in which no IPSPs were observed in direct recordings. Regardless of its source, however, this unexplained residual synchrony was quite low. In all cases when strong synchrony was observed (i.e., JSSI values >0.11 or so), it was correlated either with directly observable IPSPs (in the current dataset), or with clearly evident electrical coupling (in SOM–SOM and FS–FS pairs not included in the current dataset). Thus, under the experimental conditions of a quiescent in vitro preparation, synchrony seems to require direct coupling by either electrical or inhibitory synapses or both. Our results do not rule out a role for shared excitatory inputs in promoting synchrony under more physiological conditions during which the full network is active, including neighboring excitatory neurons.
Jitter-based measures of spike synchrony
We introduced here a novel, jitter-based index of synchrony, the JSSI, which allows both a quantification of the degree of synchrony, and a determination of its statistical significance. Jitter methods avoid many pitfalls of traditional cross-correlation techniques, since to correct for random synchrony, the latter require untested assumptions about firing rate stationarity or Poissonian statistics (Narayanan and Laubach, 2009). Even after such corrections, peaks detected in the cross-correlogram do not necessarily indicate synchrony but could result from slow covariations in firing rates or latencies (Brody, 1999). Previous methods based on the introduction of virtual temporal jitter (variously referred to also as “dithering” or “teetering”) for determining temporal spiking precision have mostly relied on Monte Carlo generation of surrogate spike trains to test for statistical significance of temporal patterns (Lestienne and Tuckwell, 1998; Abeles and Gat, 2001; Hatsopoulos et al., 2003; Shmiel et al., 2006; Pazienti et al., 2008). Our approach differed in that we computed the exact probability density function that describes the expected number of synchronous spike pairs after any arbitrary jitter. From this distribution, we derived both a raw Z score, which we used to determine statistical significance, and a normalized Z score, which we used as an index of synchrony, the JSSI.
The roles of inhibitory synapses and electrical coupling in interneuron firing synchrony
Can mutually inhibitory neurons fire in synchrony? Naive intuition would suggest that they would always fire out of phase rather than in synch, and this intuition was indeed the basis for the “half center oscillator” model—a network consisting of two populations of neurons that inhibit each other and generate rhythmic activity that alternates between the two populations (Perkel and Mulloney, 1974; Miller and Selverston, 1982; Satterlie, 1985). Later numerical and analytical modeling studies established that, under various parameter regimens, the same circuit can also give rise to in-phase oscillations (i.e., synchrony) (Wang and Rinzel, 1992; Golomb and Rinzel, 1994; Van Vreeswijk et al., 1994; Terman et al., 1998). However, synchrony by mutual inhibition was often found to be unstable in the face of noisy inputs or parameter heterogeneity (Wang and Buzsáki, 1996; White et al., 1998; Tiesinga and Jose, 2000). The discovery over a decade ago that same-type interneurons are often coupled electrically, via gap junctions (Galarreta and Hestrin, 1999; Gibson et al., 1999; Fukuda and Kosaka, 2000a), has shifted the attention of both theoreticians and experimentalists to the role of electrical synapses in synchrony, alone or in combination with inhibitory chemical synapses. Most theoretical studies concluded that synchrony is more stable when mediated by both chemical and electrical synapses compared with either mode of coupling on its own, thus overcoming the problem of heterogeneity (Traub et al., 2001; Bartos et al., 2002; Di Garbo et al., 2002, 2005; Kopell and Ermentrout, 2004; Pfeuty et al., 2005, 2007; Kanamaru and Aihara, 2008). In general, experimental studies concurred with these predictions (Tamás et al., 2000; Blatow et al., 2003; Gibson et al., 2005). Only a handful of experimental studies, however, examined the effect of purely inhibitory coupling on firing synchrony. Of these, two studies using hybrid networks (real neurons with electronically simulated connectivity) concluded that inhibitory coupling alone can only generate antiphasic firing patterns (“antisynchrony”) (Bem et al., 2005; Netoff et al., 2005). In contrast, another hybrid network study (Merriam et al., 2005) and a single study of a biological interneuronal network (Gibson et al., 2005) observed that inhibitory coupling on its own can promote both synchrony and antisynchrony, with synchrony favored at higher firing rates or when electrical coupling is added. Notably, the authors of the latter study observed synchrony only in FS–FS pairs, never in SOM–FS pairs. To our knowledge, the current study is the first to report sharp firing synchrony between different interneuronal subtypes, and the first to confirm experimentally a causal relationship between IPSPs and firing synchrony in the nervous system.
Mixed subnetworks of cortical interneurons
Previous studies emphasize the segregation of cortical interneurons into several subtype-specific subnetworks that are electrically coupled within, but not across subnetworks, and suggest that proximally targeting FS and distally targeting SOM interneurons may function semi-independently during sensory information processing and other cortical tasks (Hestrin and Galarreta, 2005). Consistent with such functional independence is the differential response of neocortical FS and SOM interneurons to thalamocortical inputs in vitro (Gibson et al., 1999; Tan et al., 2008) and to sensory inputs in vivo (Ma et al., 2010), their differential capacity to entrain pyramidal neurons at different firing frequencies (Tamás et al., 2004) and their differential participation during different behavioral states (Gentet et al., 2010). Similar independence of somatically and dendritically targeting interneurons has been proposed in the hippocampus, supported by their differential firing patterns during network oscillations (Gloveli et al., 2005), their differential frequency-dependent recruitment (Pouille and Scanziani, 2004), and their differential involvement in exploratory behavior (Moser, 1996). Our current findings, that direct chemical IPSPs can promote a high degree of synchrony in the absence of electrical coupling, imply an hitherto-unrecognized potential for coordination of activity between different interneuronal subtypes, including other presumably independent subnetworks such as PV- and cholecystokinin-containing interneurons (Karson et al., 2009), and suggest that subnetwork membership based also on chemical synaptic connectivity, rather than on electrical coupling alone, may be a more functionally meaningful organization of cortical interneurons.
Footnotes
This work was supported by National Institutes of Health Grants NS050437 (A.A.) and RR015574 (West Virginia University Sensory Neuroscience Research Center). We thank Drs. Yael Amitai, Kevin Daly, Anna Devor, David Golomb, Liset Menendez de la Prida, and George Spirou for critical reading of previous versions of this manuscript. We are grateful to Dr. Menendez de la Prida for advice on the recording technique. Cary Johnson and Qingyan Wang provided excellent technical support. The authors of this manuscript are fully and solely responsible for its content.
References
- Abeles M, Gat I. Detecting precise firing sequences in experimental data. J Neurosci Methods. 2001;107:141–154. doi: 10.1016/s0165-0270(01)00364-8. [DOI] [PubMed] [Google Scholar]
- Alonso JM, Usrey WM, Reid RC. Precisely correlated firing in cells of the lateral geniculate nucleus. Nature. 1996;383:815–819. doi: 10.1038/383815a0. [DOI] [PubMed] [Google Scholar]
- Baker SN, Spinks R, Jackson A, Lemon RN. Synchronization in monkey motor cortex during a precision grip task. I. Task-dependent modulation in single-unit synchrony. J Neurophysiol. 2001;85:869–885. doi: 10.1152/jn.2001.85.2.869. [DOI] [PubMed] [Google Scholar]
- Bartos M, Vida I, Frotscher M, Meyer A, Monyer H, Geiger JR, Jonas P. Fast synaptic inhibition promotes synchronized gamma oscillations in hippocampal interneuron networks. Proc Natl Acad Sci U S A. 2002;99:13222–13227. doi: 10.1073/pnas.192233099. [DOI] [PMC free article] [PubMed] [Google Scholar]
- Beierlein M, Gibson JR, Connors BW. A network of electrically coupled interneurons drives synchronized inhibition in neocortex. Nat Neurosci. 2000;3:904–910. doi: 10.1038/78809. [DOI] [PubMed] [Google Scholar]
- Beierlein M, Gibson JR, Connors BW. Two dynamically distinct inhibitory networks in layer 4 of the neocortex. J Neurophysiol. 2003;90:2987–3000. doi: 10.1152/jn.00283.2003. [DOI] [PubMed] [Google Scholar]
- Bem T, Le Feuvre Y, Rinzel J, Meyrand P. Electrical coupling induces bistability of rhythms in networks of inhibitory spiking neurons. Eur J Neurosci. 2005;22:2661–2668. doi: 10.1111/j.1460-9568.2005.04405.x. [DOI] [PubMed] [Google Scholar]
- Blatow M, Rozov A, Katona I, Hormuzdi SG, Meyer AH, Whittington MA, Caputi A, Monyer H. A novel network of multipolar bursting interneurons generates theta frequency oscillations in neocortex. Neuron. 2003;38:805–817. doi: 10.1016/s0896-6273(03)00300-3. [DOI] [PubMed] [Google Scholar]
- Brody CD. Correlations without synchrony. Neural Comput. 1999;11:1537–1551. doi: 10.1162/089976699300016133. [DOI] [PubMed] [Google Scholar]
- Chattopadhyaya B, Di Cristo G, Higashiyama H, Knott GW, Kuhlman SJ, Welker E, Huang ZJ. Experience and activity-dependent maturation of perisomatic GABAergic innervation in primary visual cortex during a postnatal critical period. J Neurosci. 2004;24:9598–9611. doi: 10.1523/JNEUROSCI.1851-04.2004. [DOI] [PMC free article] [PubMed] [Google Scholar]
- Dan Y, Alonso JM, Usrey WM, Reid RC. Coding of visual information by precisely correlated spikes in the lateral geniculate nucleus. Nat Neurosci. 1998;1:501–507. doi: 10.1038/2217. [DOI] [PubMed] [Google Scholar]
- Deans MR, Gibson JR, Sellitto C, Connors BW, Paul DL. Synchronous activity of inhibitory networks in neocortex requires electrical synapses containing connexin36. Neuron. 2001;31:477–485. doi: 10.1016/s0896-6273(01)00373-7. [DOI] [PubMed] [Google Scholar]
- deCharms RC, Merzenich MM. Primary cortical representation of sounds by the coordination of action-potential timing. Nature. 1996;381:610–613. doi: 10.1038/381610a0. [DOI] [PubMed] [Google Scholar]
- deCharms RC, Zador A. Neural representation and the cortical code. Annu Rev Neurosci. 2000;23:613–647. doi: 10.1146/annurev.neuro.23.1.613. [DOI] [PubMed] [Google Scholar]
- Di Garbo A, Barbi M, Chillemi S. Synchronization in a network of fast-spiking interneurons. Biosystems. 2002;67:45–53. doi: 10.1016/s0303-2647(02)00062-x. [DOI] [PubMed] [Google Scholar]
- Di Garbo A, Panarese A, Chillemi S. Gap junctions promote synchronous activities in a network of inhibitory interneurons. Biosystems. 2005;79:91–99. doi: 10.1016/j.biosystems.2004.09.004. [DOI] [PubMed] [Google Scholar]
- Fanselow EE, Connors BW. The roles of somatostatin-expressing (GIN) and fast-spiking inhibitory interneurons in UP-DOWN states of mouse neocortex. J Neurophysiol. 2010;104:596–606. doi: 10.1152/jn.00206.2010. [DOI] [PMC free article] [PubMed] [Google Scholar]
- Fanselow EE, Richardson KA, Connors BW. Selective, state-dependent activation of somatostatin-expressing inhibitory interneurons in mouse neocortex. J Neurophysiol. 2008;100:2640–2652. doi: 10.1152/jn.90691.2008. [DOI] [PMC free article] [PubMed] [Google Scholar]
- Fukuda T, Kosaka T. Gap junctions linking the dendritic network of GABAergic interneurons in the hippocampus. J Neurosci. 2000a;20:1519–1528. doi: 10.1523/JNEUROSCI.20-04-01519.2000. [DOI] [PMC free article] [PubMed] [Google Scholar]
- Fukuda T, Kosaka T. The dual network of GABAergic interneurons linked by both chemical and electrical synapses: a possible infrastructure of the cerebral cortex. Neurosci Res. 2000b;38:123–130. doi: 10.1016/s0168-0102(00)00163-2. [DOI] [PubMed] [Google Scholar]
- Galarreta M, Hestrin S. A network of fast-spiking cells in the neocortex connected by electrical synapses. Nature. 1999;402:72–75. doi: 10.1038/47029. [DOI] [PubMed] [Google Scholar]
- Galarreta M, Erdélyi F, Szabó G, Hestrin S. Electrical coupling among irregular-spiking GABAergic interneurons expressing cannabinoid receptors. J Neurosci. 2004;24:9770–9778. doi: 10.1523/JNEUROSCI.3027-04.2004. [DOI] [PMC free article] [PubMed] [Google Scholar]
- Gentet LJ, Avermann M, Matyas F, Staiger JF, Petersen CC. Membrane potential dynamics of GABAergic neurons in the barrel cortex of behaving mice. Neuron. 2010;65:422–435. doi: 10.1016/j.neuron.2010.01.006. [DOI] [PubMed] [Google Scholar]
- Gerstner W, Kistler WM. Cambridge, UK: Cambridge UP; 2002. Spiking neuron models. [Google Scholar]
- Gibson JR, Beierlein M, Connors BW. Two networks of electrically coupled inhibitory neurons in neocortex. Nature. 1999;402:75–79. doi: 10.1038/47035. [DOI] [PubMed] [Google Scholar]
- Gibson JR, Beierlein M, Connors BW. Functional properties of electrical synapses between inhibitory interneurons of neocortical layer 4. J Neurophysiol. 2005;93:467–480. doi: 10.1152/jn.00520.2004. [DOI] [PubMed] [Google Scholar]
- Gloveli T, Dugladze T, Saha S, Monyer H, Heinemann U, Traub RD, Whittington MA, Buhl EH. Differential involvement of oriens/pyramidale interneurones in hippocampal network oscillations in vitro. J Physiol. 2005;562:131–147. doi: 10.1113/jphysiol.2004.073007. [DOI] [PMC free article] [PubMed] [Google Scholar]
- Golomb D, Rinzel J. Clustering in globally coupled inhibitory neurons. Physica D. 1994;72:259–282. [Google Scholar]
- Good PI. Boston: Birkhauser; 1999. Resampling methods. [Google Scholar]
- Hatsopoulos NG, Ojakangas CL, Paninski L, Donoghue JP. Information about movement direction obtained from synchronous activity of motor cortical neurons. Proc Natl Acad Sci U S A. 1998;95:15706–15711. doi: 10.1073/pnas.95.26.15706. [DOI] [PMC free article] [PubMed] [Google Scholar]
- Hatsopoulos N, Geman S, Amarasingham A, Bienenstock E. At what time scale does the nervous system operate? Neurocomputing. 2003;52–54:25–29. [Google Scholar]
- Hestrin S, Galarreta M. Electrical synapses define networks of neocortical GABAergic neurons. Trends Neurosci. 2005;28:304–309. doi: 10.1016/j.tins.2005.04.001. [DOI] [PubMed] [Google Scholar]
- Kanamaru T, Aihara K. Stochastic synchrony of chaos in a pulse-coupled neural network with both chemical and electrical synapses among inhibitory neurons. Neural Comput. 2008;20:1951–1972. doi: 10.1162/neco.2008.05-07-516. [DOI] [PubMed] [Google Scholar]
- Karson MA, Tang AH, Milner TA, Alger BE. Synaptic cross talk between perisomatic-targeting interneuron classes expressing cholecystokinin and parvalbumin in hippocampus. J Neurosci. 2009;29:4140–4154. doi: 10.1523/JNEUROSCI.5264-08.2009. [DOI] [PMC free article] [PubMed] [Google Scholar]
- Kawaguchi Y, Kubota Y. Neurochemical features and synaptic connections of large physiologically-identified GABAergic cells in the rat frontal cortex. Neuroscience. 1998;85:677–701. doi: 10.1016/s0306-4522(97)00685-4. [DOI] [PubMed] [Google Scholar]
- Kopell N, Ermentrout B. Chemical and electrical synapses perform complementary roles in the synchronization of interneuronal networks. Proc Natl Acad Sci U S A. 2004;101:15482–15487. doi: 10.1073/pnas.0406343101. [DOI] [PMC free article] [PubMed] [Google Scholar]
- Kumar A, Rotter S, Aertsen A. Spiking activity propagation in neuronal networks: reconciling different perspectives on neural coding. Nat Rev Neurosci. 2010;11:615–627. doi: 10.1038/nrn2886. [DOI] [PubMed] [Google Scholar]
- Lestienne R. Spike timing, synchronization and information processing on the sensory side of the central nervous system. Prog Neurobiol. 2001;65:545–591. doi: 10.1016/s0301-0082(01)00019-3. [DOI] [PubMed] [Google Scholar]
- Lestienne R, Tuckwell HC. The significance of precisely replicating patterns in mammalian CNS spike trains. Neuroscience. 1998;82:315–336. doi: 10.1016/s0306-4522(97)00281-9. [DOI] [PubMed] [Google Scholar]
- Ma WP, Liu BH, Li YT, Huang ZJ, Zhang LI, Tao HW. Visual representations by cortical somatostatin inhibitory neurons—selective but with weak and delayed responses. J Neurosci. 2010;30:14371–14379. doi: 10.1523/JNEUROSCI.3248-10.2010. [DOI] [PMC free article] [PubMed] [Google Scholar]
- Ma Y, Hu H, Berrebi AS, Mathers PH, Agmon A. Distinct subtypes of somatostatin-containing neocortical interneurons revealed in transgenic mice. J Neurosci. 2006;26:5069–5082. doi: 10.1523/JNEUROSCI.0661-06.2006. [DOI] [PMC free article] [PubMed] [Google Scholar]
- Mancilla JG, Lewis TJ, Pinto DJ, Rinzel J, Connors BW. Synchronization of electrically coupled pairs of inhibitory interneurons in neocortex. J Neurosci. 2007;27:2058–2073. doi: 10.1523/JNEUROSCI.2715-06.2007. [DOI] [PMC free article] [PubMed] [Google Scholar]
- Mann-Metzer P, Yarom Y. Electrotonic coupling interacts with intrinsic properties to generate synchronized activity in cerebellar networks of inhibitory interneurons. J Neurosci. 1999;19:3298–3306. doi: 10.1523/JNEUROSCI.19-09-03298.1999. [DOI] [PMC free article] [PubMed] [Google Scholar]
- Mastronarde DN. Interactions between ganglion cells in cat retina. J Neurophysiol. 1983;49:350–365. doi: 10.1152/jn.1983.49.2.350. [DOI] [PubMed] [Google Scholar]
- Merriam EB, Netoff TI, Banks MI. Bistable network behavior of layer I interneurons in auditory cortex. J Neurosci. 2005;25:6175–6186. doi: 10.1523/JNEUROSCI.0512-05.2005. [DOI] [PMC free article] [PubMed] [Google Scholar]
- Miller JP, Selverston AI. Mechanisms underlying pattern generation in lobster stomatogastric ganglion as determined by selective inactivation of identified neurons. IV. Network properties of pyloric system. J Neurophysiol. 1982;48:1416–1432. doi: 10.1152/jn.1982.48.6.1416. [DOI] [PubMed] [Google Scholar]
- Moore GP, Segundo JP, Perkel DH, Levitan H. Statistical signs of synaptic interaction in neurons. Biophys J. 1970;10:876–900. doi: 10.1016/S0006-3495(70)86341-X. [DOI] [PMC free article] [PubMed] [Google Scholar]
- Moser EI. Altered inhibition of dentate granule cells during spatial learning in an exploration task. J Neurosci. 1996;16:1247–1259. doi: 10.1523/JNEUROSCI.16-03-01247.1996. [DOI] [PMC free article] [PubMed] [Google Scholar]
- Narayanan NS, Laubach M. Methods for studying functional interactions among neuronal populations. Methods Mol Biol. 2009;489:135–165. doi: 10.1007/978-1-59745-543-5_7. [DOI] [PMC free article] [PubMed] [Google Scholar]
- Netoff TI, Banks MI, Dorval AD, Acker CD, Haas JS, Kopell N, White JA. Synchronization in hybrid neuronal networks of the hippocampal formation. J Neurophysiol. 2005;93:1197–1208. doi: 10.1152/jn.00982.2004. [DOI] [PubMed] [Google Scholar]
- Pazienti A, Maldonado PE, Diesmann M, Grün S. Effectiveness of systematic spike dithering depends on the precision of cortical synchronization. Brain Res. 2008;1225:39–46. doi: 10.1016/j.brainres.2008.04.073. [DOI] [PubMed] [Google Scholar]
- Perkel DH, Mulloney B. Motor pattern production in reciprocally inhibitory neurons exhibiting postinhibitory rebound. Science. 1974;185:181–183. doi: 10.1126/science.185.4146.181. [DOI] [PubMed] [Google Scholar]
- Perkel DH, Gerstein GL, Moore GP. Neuronal spike trains and stochastic point processes. II. Simultaneous spike trains. Biophys J. 1967;7:419–440. doi: 10.1016/S0006-3495(67)86597-4. [DOI] [PMC free article] [PubMed] [Google Scholar]
- Pfeuty B, Mato G, Golomb D, Hansel D. The combined effects of inhibitory and electrical synapses in synchrony. Neural Comput. 2005;17:633–670. doi: 10.1162/0899766053019917. [DOI] [PubMed] [Google Scholar]
- Pfeuty B, Golomb D, Mato G, Hansel D. Inhibition potentiates the synchronizing action of electrical synapses. Front Comput Neurosci. 2007;1:8. doi: 10.3389/neuro.10.008.2007. [DOI] [PMC free article] [PubMed] [Google Scholar]
- Pouille F, Scanziani M. Routing of spike series by dynamic circuits in the hippocampus. Nature. 2004;429:717–723. doi: 10.1038/nature02615. [DOI] [PubMed] [Google Scholar]
- Richmond BJ. Stochasticity, spikes and decoding: sufficiency and utility of order statistics. Biol Cybern. 2009;100:447–457. doi: 10.1007/s00422-009-0321-x. [DOI] [PMC free article] [PubMed] [Google Scholar]
- Satterlie RA. Reciprocal inhibition and postinhibitory rebound produce reverberation in a locomotor pattern generator. Science. 1985;229:402–404. doi: 10.1126/science.229.4711.402. [DOI] [PubMed] [Google Scholar]
- Schnitzer MJ, Meister M. Multineuronal firing patterns in the signal from eye to brain. Neuron. 2003;37:499–511. doi: 10.1016/s0896-6273(03)00004-7. [DOI] [PubMed] [Google Scholar]
- Schoppa NE. Synchronization of olfactory bulb mitral cells by precisely timed inhibitory inputs. Neuron. 2006;49:271–283. doi: 10.1016/j.neuron.2005.11.038. [DOI] [PubMed] [Google Scholar]
- Shmiel T, Drori R, Shmiel O, Ben-Shaul Y, Nadasdy Z, Shemesh M, Teicher M, Abeles M. Temporally precise cortical firing patterns are associated with distinct action segments. J Neurophysiol. 2006;96:2645–2652. doi: 10.1152/jn.00798.2005. [DOI] [PubMed] [Google Scholar]
- Singer W. Distributed processing and temporal codes in neuronal networks. Cogn Neurodyn. 2009;3:189–196. doi: 10.1007/s11571-009-9087-z. [DOI] [PMC free article] [PubMed] [Google Scholar]
- Swadlow HA, Beloozerova IN, Sirota MG. Sharp, local synchrony among putative feed-forward inhibitory interneurons of rabbit somatosensory cortex. J Neurophysiol. 1998;79:567–582. doi: 10.1152/jn.1998.79.2.567. [DOI] [PubMed] [Google Scholar]
- Szabadics J, Lorincz A, Tamás G. Beta and gamma frequency synchronization by dendritic gabaergic synapses and gap junctions in a network of cortical interneurons. J Neurosci. 2001;21:5824–5831. doi: 10.1523/JNEUROSCI.21-15-05824.2001. [DOI] [PMC free article] [PubMed] [Google Scholar]
- Takahashi S, Sakurai Y. Sub-millisecond firing synchrony of closely neighboring pyramidal neurons in hippocampal CA1 of rats during delayed non-matching to sample task. Front Neural Circuits. 2009;3:9. doi: 10.3389/neuro.04.009.2009. [DOI] [PMC free article] [PubMed] [Google Scholar]
- Tamás G, Somogyi P, Buhl EH. Differentially interconnected networks of GABAergic interneurons in the visual cortex of the cat. J Neurosci. 1998;18:4255–4270. doi: 10.1523/JNEUROSCI.18-11-04255.1998. [DOI] [PMC free article] [PubMed] [Google Scholar]
- Tamás G, Buhl EH, Lörincz A, Somogyi P. Proximally targeted GABAergic synapses and gap junctions synchronize cortical interneurons. Nat Neurosci. 2000;3:366–371. doi: 10.1038/73936. [DOI] [PubMed] [Google Scholar]
- Tamás G, Szabadics J, Lörincz A, Somogyi P. Input and frequency-specific entrainment of postsynaptic firing by IPSPs of perisomatic or dendritic origin. Eur J Neurosci. 2004;20:2681–2690. doi: 10.1111/j.1460-9568.2004.03719.x. [DOI] [PubMed] [Google Scholar]
- Tan Z, Hu H, Huang ZJ, Agmon A. Robust but delayed thalamocortical activation of dendritic-targeting inhibitory interneurons. Proc Natl Acad Sci U S A. 2008;105:2187–2192. doi: 10.1073/pnas.0710628105. [DOI] [PMC free article] [PubMed] [Google Scholar]
- Terman D, Kopell N, Bose A. Dynamics of two mutually coupled slow inhibitory neurons. Physica D. 1998;117:241–275. [Google Scholar]
- Thomas M, Taub A. Calculating binomial probabilities when the trial probabilities are unequal. J Stat Comput Simul. 1982;14:125–131. [Google Scholar]
- Thomson AM, West DC, Wang Y, Bannister AP. Synaptic connections and small circuits involving excitatory and inhibitory neurons in layers 2–5 of adult rat and cat neocortex: triple intracellular recordings and biocytin labelling in vitro. Cereb Cortex. 2002;12:936–953. doi: 10.1093/cercor/12.9.936. [DOI] [PubMed] [Google Scholar]
- Tiesinga PH, Jose JV. Robust gamma oscillations in networks of inhibitory hippocampal interneurons. Network. 2000;11:1–23. [PubMed] [Google Scholar]
- Traub RD, Kopell N, Bibbig A, Buhl EH, LeBeau FE, Whittington MA. Gap junctions between interneuron dendrites can enhance synchrony of gamma oscillations in distributed networks. J Neurosci. 2001;21:9478–9486. doi: 10.1523/JNEUROSCI.21-23-09478.2001. [DOI] [PMC free article] [PubMed] [Google Scholar]
- Uhlhaas PJ, Pipa G, Lima B, Melloni L, Neuenschwander S, Nikolić D, Singer W. Neural synchrony in cortical networks: history, concept and current status. Front Integr Neurosci. 2009;3:17. doi: 10.3389/neuro.07.017.2009. [DOI] [PMC free article] [PubMed] [Google Scholar]
- Vaadia E, Haalman I, Abeles M, Bergman H, Prut Y, Slovin H, Aertsen A. Dynamics of neuronal interactions in monkey cortex in relation to behavioural events. Nature. 1995;373:515–518. doi: 10.1038/373515a0. [DOI] [PubMed] [Google Scholar]
- Van Vreeswijk C, Abbott LF, Ermentrout GB. When inhibition not excitation synchronizes neural firing. J Comput Neurosci. 1994;1:313–321. doi: 10.1007/BF00961879. [DOI] [PubMed] [Google Scholar]
- Wang XJ, Buzsáki G. Gamma oscillation by synaptic inhibition in a hippocampal interneuronal network model. J Neurosci. 1996;16:6402–6413. doi: 10.1523/JNEUROSCI.16-20-06402.1996. [DOI] [PMC free article] [PubMed] [Google Scholar]
- Wang XJ, Rinzel J. Alternating and synchronous rhythms in reciprocally inhibitory model neurons. Neural Comput. 1992;4:84–97. [Google Scholar]
- White JA, Chow CC, Ritt J, Soto-Treviño C, Kopell N. Synchronization and oscillatory dynamics in heterogeneous, mutually inhibited neurons. J Comput Neurosci. 1998;5:5–16. doi: 10.1023/a:1008841325921. [DOI] [PubMed] [Google Scholar]
- Wylie DR, De Zeeuw CI, Simpson JI. Temporal relations of the complex spike activity of Purkinje cell pairs in the vestibulocerebellum of rabbits. J Neurosci. 1995;15:2875–2887. doi: 10.1523/JNEUROSCI.15-04-02875.1995. [DOI] [PMC free article] [PubMed] [Google Scholar]