Abstract
DNA in its natural, double-stranded form may contain palindromes, sequences which read the same from either side because they are identical to their reverse complement on the sister strand. Short palindromes are underrepresented in all kinds of genomes. The frequency distribution of short palindromes exhibits more than twice the inter-species variance of non-palindromic sequences, which renders palindromes optimally suited for the typing of DNA. Here, we show that based on palindrome frequency, DNA sequences can be discriminated to the level of species of origin. By plotting the ratios of actual occurrence to expectancy, we generate palindrome frequency patterns that allow to cluster different sequences of the same genome and to assign plasmids, and in some cases even viruses to their respective host genomes. This finding will be of use in the growing field of metagenomics.
Keywords: comparative genomics, DNA palindrome, hierarchical clustering
1. Introduction
The double helix forms the structural basis of semi-conservative DNA replication.1,2 Less intuitively, it also has implications on the information content of DNA for double-stranded DNA as such only has about half the storage capacity of single-stranded DNA. This is because a given sequence and its reverse complement, while the same in the double-stranded form, are different entities in single-stranded DNA—except for those sequences which are identical to their reverse complement. Centrally symmetric when double-stranded, such sequences read the same from either 5′ end and are called DNA palindromes (e.g. 5′-GATC-3′). Consider the 44 = 256 different single-stranded sequences of length 4; only the 42 = 16 possible palindromes are unique in the double-stranded form. The remaining 240 form 120 pairs of identical sequences when complemented to the double strands (e.g. 5′-GACT-3′ and 5′-AGTC-3′). Thus, the total number of different double-stranded sequences of length 4bp is 120 + 16 = 136. It follows that the generally accepted maximal information content of 2 bit per base pair only holds true if the two sister strands can be distinguished (which requires extra information).
Given that palindromes are the only sequences which are unique in double-stranded DNA, it is not surprising that they are of particular importance in genome biology. Dimeric restriction endonucleases and DNA methyltransferases bind palindromic recognition sites.3,4 The same applies to transcription factors such as the bacterial trp repressor5 or the mammalian oestrogen receptor.6 Palindromes also fulfil an important role as spacers in the prokaryotic CRISPR/Cas system (clustered regularly interspaced short palindromic repeats), which forms the basis of immune memory against bacteriophages and plasmids.7 Viral and bacterial genomes possess palindromic replication origins.8,9 Palindromes also contribute to genome instability: as target sites for insertion sequence elements10 and for homologous strand invasion during recombination,11 and by inducing double-strand breaks due to hairpin-specific nucleases.12
While statistically, palindromes are expected to occur half as often as non-palindromic sequences in double-stranded DNA, they are even rarer than this in natural DNA sequences. Short palindromes were found to be underrepresented in various genomes including bacteriophages,13 bacteria,14–16 and fungi.17,18 In the human genome, palindromes were found to be underrepresented in exons but overrepresented in introns and in upstream regions of genes.19 In bacteria, restriction endonucleases which cleave palindromic DNA recognition sites were proposed as a selective force against palindromes.20 In vertebrate genomes, the underrepresentation of palindromes is partly attributable to the drift of CG dinucleotides to TG by deamination of methylated cytosine.21 Other factors accounting for the scarcity of palindromes in genomic DNA sequences are the potential adverse effects of palindromes on chromatin structure,17 bias of the mismatch repair system,22 and selection against palindromes to avoid inappropriate binding of transcription factors.17 Here, we make use of the large number of available sequenced genomes, scanning them for the occurrence of short palindromes and demonstrating that (i) the underrepresentation of short palindromes is ubiquitous and (ii) the frequency distribution of short palindromes lends itself for species-specific typing of DNA sequences.
2. Materials and methods
2.1. Genome sequences
Genomic DNA sequences were analysed of 200 species from 10 different phylogenetic groups, 20 species per group: vertebrates, invertebrates, fungi, plants, protozoa, bacteria, archaea, mitochondria, dsDNA viruses, and retroviruses. Complete genomes or chromosomes were analysed if available, otherwise large contigs of at least 100 kb. Twenty was the maximal number of available genome sequences for groups like invertebrates or plants; to be able to compare the variances between the different groups, the number of species per group was therefore fixed to 20 (randomly selected). See Supplementary Table S1 for a complete list of species including accession numbers.
2.2. Calculation of palindrome expectancy
The number N of different DNA palindromes of length l is given by:
| (1) |
since palindromes are centrally symmetric. The expectancy (E) of a palindrome (pal) of length lpal and GC ratio gcpal in a DNA sequence (seq) of length lseq and GC ratio gcseq is:
 |
(2) |
The ratio R of palindrome frequency was defined as:
| (3) |
where n is the actual occurrence of the palindrome (pal) in the sequence (seq).
2.3. Counting of palindromes
The counting of palindromes in DNA sequences (Fasta format) was performed with a Perl script, available on request under the GNU public licence. Input DNA sequences were first rid of all perfect repeats (word size four or longer, repeated in tandem for at least five times) to avoid a possible bias from telomeric or centromeric repeats. Then, the occurrence was counted of each of the 16 different palindromes of length 4 (Table 1). To allow for comparison of variance, the same number of control sequences were included that did not contain any palindromic duplets nor compatible ends (Table 1). Each of these controls was counted alongside its reverse complement to render the result independent of the DNA strand searched. The log2 of the ratios R of occurrence to expectancy for each 4-mer palindrome was plotted as vectors of 16 components, which were clustered by average linkage based on the city-block distance (i.e. the sum of absolute differences in the components of a given pair of vectors). Clustering was performed with the programs Cluster and TreeView23 from the Eisen lab (http://rana.lbl.gov/eisen/).
Table 1.
The 16 palindromes of length 4 and an equal number of non-palindromes, their mean ratio R of occurrence to expectancy, and variance of R, across 200 genomes
| Palindrome | R | Var(R) | Non-palindrome | R | Var(R) |
|---|---|---|---|---|---|
| AATT | 0.97 | 0.06 | AAGG/CCTT | 1.23 | 0.09 |
| ATAT | 0.85 | 0.05 | ACAG/CTGT | 1.04 | 0.08 |
| TATA | 0.68 | 0.07 | ACTG/CAGT | 0.94 | 0.06 |
| TTAA | 0.84 | 0.10 | AGAC/GTCT | 0.87 | 0.05 |
| ACGT | 0.63 | 0.12 | CAAC/GTTG | 1.10 | 0.06 |
| AGCT | 1.13 | 0.13 | CAGA/TCTG | 1.16 | 0.12 |
| CATG | 0.99 | 0.09 | CCAA/TTGG | 1.24 | 0.12 |
| CTAG | 0.67 | 0.14 | CTGA/TCAG | 1.06 | 0.08 |
| GATC | 0.86 | 0.16 | GAGA/TCTC | 1.14 | 0.09 |
| GTAC | 0.71 | 0.05 | GGAA/TTCC | 1.30 | 0.11 |
| TCGA | 0.84 | 0.39 | GTCA/TGAC | 0.87 | 0.04 |
| TGCA | 1.15 | 0.15 | GTGA/TCAC | 0.94 | 0.04 |
| CCGG | 0.89 | 0.24 | TCCT/AGGA | 1.29 | 0.12 |
| CGCG | 0.62 | 0.27 | TGAG/CTCA | 1.07 | 0.07 |
| GCGC | 0.80 | 0.28 | TGGT/ACCA | 1.13 | 0.08 |
| GGCC | 1.15 | 0.32 | TGTC/GACA | 0.92 | 0.04 |
| Overall | 0.86 | 0.19 | Overall | 1.08 | 0.10 |
Values significantly deviating from 1 are given in bold (P < 0.01, one-way ANOVA followed by Dunnett's multiple comparison test).
2.4. Random controls
Random sequences of variable length were generated with the program makenucseq of the EMBOSS package.24 Randomly selected, non-overlapping 10 kb fragments of bacterial genomes were generated with a self-made Perl script using srand(time) as the random number seed.
3. Results and discussion
3.1. Palindrome occurrence across the tree of life
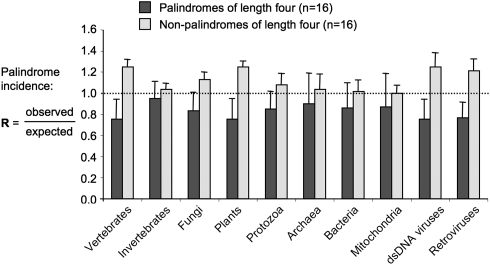
We counted the occurrence of the 16 palindromic words of length 4 (Table 1), along with an equal number of non-palindromic words of length 4 (Table 1), in DNA sequences of selected genomes. Twenty different species were analysed for each of 10 different phylogenetic groups, i.e. the vertebrates, invertebrates, fungi, plants, protozoa, mitochondria, bacteria, archaea, double-stranded DNA viruses, and retroviruses. Perfect repeats were removed from the input sequences to avoid introduction of a trivial bias from regions of extremely low complexity such as telomeric or centromeric repeats. For each input DNA sequence and each 4-mer word, we then calculated the ratio R of actual occurrence of the word divided by the expected number of occurrences, given its GC content and that of the input DNA sequence. Most of the palindromes were underrepresented (R < 1) across all genomes analysed. Overall, the palindromes exhibited a mean R of 0.86, in contrast to a mean R of 1.08 for the non-palindromic controls (Table 1). The underrepresentation of palindromes was most pronounced in vertebrate genomes, plants, double-stranded DNA viruses, and retroviruses (Fig. 1). Contrary to previous reports,20 palindromes were underrepresented even in mitochondrial genomes, demonstrating that the infrequence of palindromes in prokaryote genomes cannot solely be explained by the selective pressure exerted by restriction enzymes. Additional selective forces against palindromes might comprise their impact on DNA structure or their role as transcription factor-binding sites.17 Whatever the underlying forces, short palindromes are underrepresented in all kinds of genomes (Fig. 1). Exactly which palindromes and how strongly depend on the source of the DNA. Interestingly, the inter-genome frequencies of short palindromes exhibit more than twice the variance of the non-palindromic control sequences (22 versus 9%; Table 1), whereas the intra-genome frequencies, e.g. between different chromosomes of the same organism, are uniform (Figs 2–4). This renders short palindromes optimally suited for the typing of DNA.
Figure 1.
Frequency of palindromes throughout a diverse selection of genomes. Palindrome frequency is expressed as the ratio (R) of occurrence to expectancy. Palindromes are underrepresented (R < 1, dotted line) in all kinds of genomes, most strongly in vertebrates, plants, and viruses, and they exhibit about twice the inter-species variance in frequency (error bars) than non-palindromes. Twenty different genomes were analysed per group (see Section 2).
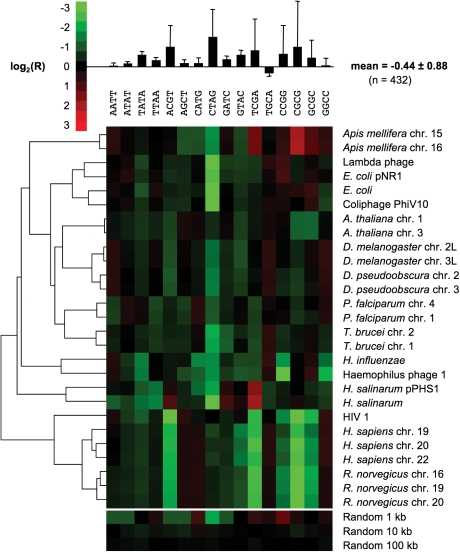
Figure 2.
Examples of palindrome frequency patterns. Frequency of the 16 palindromes of length 4 in selected genomes, expressed as log2 of ratio (R) of actual to expected occurrence. Hierarchical clustering was performed based on the city-block distance.23 (Top) Mean and variance by palindrome. (Bottom) The signals from three random sequences are shown for comparison.
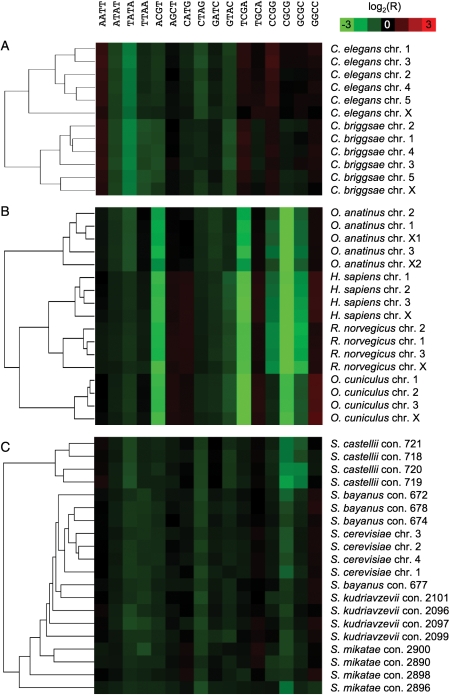
Figure 4.
Case studies on Caenorhabditis spp. (A), mammalian chromosomes (B), and sensu stricto yeasts (C). Most of the chromosomes are correctly resolved by clustering based on palindrome frequency. Perfect tandem repeats were removed prior to analysis to avoid trivial differences from repetitive regions. Note the striking difference between vertebrate and invertebrate DNA.
3.2. Clustering of DNA based on palindrome frequency
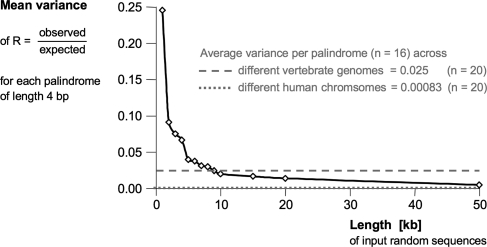
Here, we represent a given DNA sequence by a vector of 16 numbers: for each of the 16 palindromes of length 4, the log2 of the ratio R of actual to expected frequency (given the GC content of the analysed DNA and that of the palindrome). When such vectors, generated from a diverse selection of DNA sequences, were aligned and hierarchically clustered based on the city-block distance, different DNA sequences of the same species readily grouped together (see Fig. 2 for a representative set of diverse genomes). The clustering worked for all kinds of genome sequences tested—eukaryote, prokaryote, plastid, or virus—but the topology of the resulting tree was not phylogenetically meaningful (Fig. 2). The lack of a large-scale phylogenetic signal was equally apparent from the analysis of the complete set of 200 genomes (Supplementary Fig. S1). The resolution of palindrome frequency clustering would increase further by using the 64 different palindromes of length 6. However, this would also require the input sequences to be longer. On the basis of the random sequences included in Fig. 2, the present approach appeared to work for sequences longer than about 10 kb. To obtain a better estimate on the minimally required size of input DNA, we analysed randomly generated sequences of increasing length (Fig. 3). Above 9 kb, the average variance of R per palindrome dropped below the value obtained for different vertebrate chromosomes (0.025, dashed grey line in Fig. 3). For comparison, the average variance of R per palindrome across human chromosomes was 0.0008 (dotted grey line in Fig. 3), demonstrating again that the variance of palindrome frequency is much lower intra- than inter-genome.
Figure 3.
Variance of palindrome frequencies in random DNA sequence of different lengths (n = 20 for each). The mean variance for each palindrome of length 4 across the 20 different sequences is compared with those across the first 20 human chromosomes (dotted grey line) and across the 20 different vertebrate chromosomes analysed in Fig. 1 (see Supplementary Table S1).
Invertebrates exhibiting the smallest inter-genome variance of palindrome frequency (Fig. 1), we chose Caenorhabditis species to challenge its power of discrimination. The complete nuclear genomes of C. briggsae and C. elegans were compared as described above and all the chromosomes were correctly resolved in spite of the weak patterns (Fig. 4A). Clustering based on palindrome frequency also segregated different mammalian chromosomes which, in contrast to invertebrate DNA, showed the characteristic pattern caused by strong underrepresentation of palindromes containing a CG dinucleotide (ACGT, TCGA, CCGG, GCGC, and CGCG; Fig. 4B). This is in agreement with the model that in vertebrates, DNA methylation is restricted to cytosines followed by guanine (CpG), whereas in invertebrates, cytosines are methylated in a wider context.25 Spontaneous mutation of the palindromic CG to the non-palindromic TG by deamination of methylated cytosine thus eliminates short palindromes from vertebrate DNA. The limit of resolution of palindrome frequency clustering was reached with a data set of highly similar sensu stricto yeasts.26 The different chromosomes of the closely related species Saccharomyces cerevisiae, S. bayanus, S. mikatae, and S. kudriavzevii did not segregate perfectly; those of the more distantly related S. castellii did (Fig. 4C).
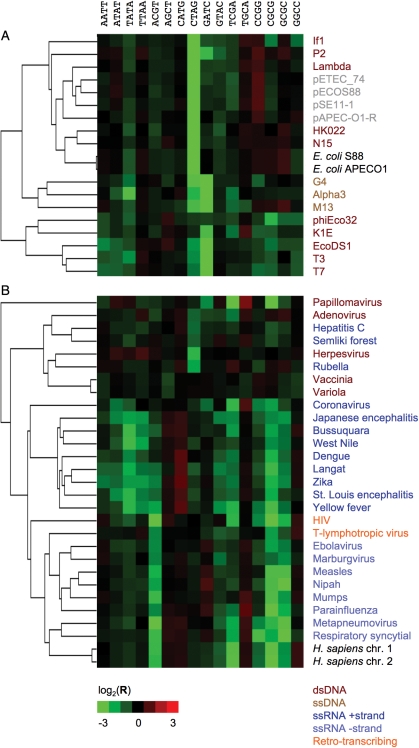
Clustering based on palindrome frequency also worked for prokaryotes, generating species-specific patterns for archaea as well as bacteria. Prokaryote genomes exhibited highly diverse patterns (Supplementary Fig. S1). Natural plasmids of Escherichia coli clearly clustered with the host DNA (Fig. 5A). The same applied to certain dsDNA bacteriophages such as Lambda or P2. However, other dsDNA phages such as T3, as well as all analysed ssDNA phages, did not exhibit the same palindrome frequency patterns as E. coli (Fig. 5A). An interesting picture emerged when comparing human viruses: while all ssRNA minus-strand viruses and the retro-transcribing HIV clustered with human DNA, dsDNA viruses and ssRNA plus-strand viruses did not (Fig. 5B).
Figure 5.
Palindrome frequency patterns of host genomic DNA (A, E. coli; B, Homo sapiens; labelled in black) and associated viruses (colour-coded according to nucleic acid type of the genome) or plasmids (grey).
3.3. Potential application to metagenomics
The quickly developing field of environmental shotgun sequencing allows metagenomic analyses of communities of microorganisms, the majority of which cannot be cultured in the lab and have therefore remained undetected until recently.27 A key challenge in interpreting environmental shotgun sequencing data is the binning of non-overlapping DNA scaffolds into groups which, ideally, correspond to the different species of microorganisms present.28 Standard methods such as similarity searches to known genomes or phylogenetic analysis of marker genes are of limited use when dealing with DNA fragments sampled from previously undescribed species.28 Di-, tri- and tetra-nucleotide frequencies have been proposed to provide DNA signatures.29–31 Palindrome frequencies carrying a species-specific signal (Figs 2 and 4), the ratios of occurrence to expectancy as applied here may also be useful to bin environmental shotgun sequencing data, provided that the contigs to be analysed are longer than 9 kb (Fig. 3). From the 2007 Sorcerer II Global Ocean Sampling Expedition, which at that time predominantly produced novel sequences,32 the hundred largest contigs, sized between 11 and 59 kb, were analysed as described above. This revealed a diverse picture of palindrome frequency patterns with several major clusters (Supplementary Fig. S2). However, the analysed sequences still did not return high-quality hits when searched with blastn33 against the NCBI non-redundant nucleotide collection, with only one exception of 99% identity to Prochlorococcus phage P-SSM4 (GenBank accession no. AY940168). Thus, it was not possible to assess the benefit of palindrome frequency clustering with this data set. To nevertheless test the potential of the method, we randomly selected 10 non-overlapping fragments of length 10 kb from each of the 20 different bacterial genomes analysed in Fig. 1 (Supplementary Table S1). When these 200 sequences were clustered according to palindrome frequency patterns, over 90% of them correctly assembled according to species of origin.
4. Conclusion
Accustomed to reading DNA as linear sequences, we tend to forget that it is double-stranded in nature. In double-stranded DNA, the only sequences which are unique are palindromes. Here, we confirm the notion that short palindromes are underrepresented across all different kinds of genomes. The frequency distribution of short palindromes exhibits highest inter-species but low intra-species variance. We take advantage of this to type DNA based on palindrome frequency, generating highly specific patterns which discriminate the DNA from different species, clustering together sequences from the same species. The method allows for the assignment of plasmids and certain viruses to their respective host genomes. Although the underlying selective forces are not fully understood, these patterns are highly useful for analysis of DNA sequences of unknown origin, such as those generated by the gigabase in metagenomic high-throughput sequencing surveys. Palindrome frequency ratios as presented here could be incorporated into more sophisticated classifiers such as self-organizing maps,34 Bayesian classifiers,35 or support vector machines.36 Concentrating on palindromes may help to estimate the diversity of microbial communities and to bin different, non-overlapping sequences originating from the same genome, to classify sequences by comparison to reference patterns, and to assign plasmids and bacteriophages to their respective host genomes.
Supplementary data
Supplementary data are available at www.dnaresearch.oxfordjournals.org.
Funding
We wish to thank the Swiss National Science Foundation for financial support.
References
- 1.Watson J., Crick F. Genetical implications of the structure of deoxyribonucleic acid. Nature. 1953;171:964–7. doi: 10.1038/171964b0. doi:10.1038/171964b0. [DOI] [PubMed] [Google Scholar]
- 2.Chagin V.O., Stear J.H., Cardoso M.C. Organization of DNA replication. Cold Spring Harb. Perspect. Biol. 2010;2:a000737. doi: 10.1101/cshperspect.a000737. [DOI] [PMC free article] [PubMed] [Google Scholar]
- 3.Pingoud A., Jeltsch A. Structure and function of type II restriction endonucleases. Nucleic Acids Res. 2001;29:3705–27. doi: 10.1093/nar/29.18.3705. doi:10.1093/nar/29.18.3705. [DOI] [PMC free article] [PubMed] [Google Scholar]
- 4.Zinoviev V.V., Yakishchik S.I., Evdokimov A.A., Malygin E.G., Hattman S. Symmetry elements in DNA structure important for recognition/methylation by DNA [amino]-methyltransferases. Nucleic Acids Res. 2004;32:3930–4. doi: 10.1093/nar/gkh712. doi:10.1093/nar/gkh712. [DOI] [PMC free article] [PubMed] [Google Scholar]
- 5.Czernik P.J., Shin D.S., Hurlburt B.K. Functional selection and characterization of DNA binding sites for trp repressor of Escherichia coli. J. Biol. Chem. 1994;269:27869–75. [PubMed] [Google Scholar]
- 6.Welboren W.J., Stunnenberg H.G., Sweep F.C., Span P.N. Identifying estrogen receptor target genes. Mol. Oncol. 2007;1:138–43. doi: 10.1016/j.molonc.2007.04.001. doi:10.1016/j.molonc.2007.04.001. [DOI] [PMC free article] [PubMed] [Google Scholar]
- 7.Horvath P., Barrangou R. CRISPR/Cas, the immune system of bacteria and archaea. Science. 2010;327:167–70. doi: 10.1126/science.1179555. doi:10.1126/science.1179555. [DOI] [PubMed] [Google Scholar]
- 8.Leung M.Y., Choi K.P., Xia A., Chen L.H. Nonrandom clusters of palindromes in herpesvirus genomes. J. Comput. Biol. 2005;12:331–54. doi: 10.1089/cmb.2005.12.331. doi:10.1089/cmb.2005.12.331. [DOI] [PMC free article] [PubMed] [Google Scholar]
- 9.Zakrzewska-Czerwinska J., Jakimowicz D., Zawilak-Pawlik A., Messer W. Regulation of the initiation of chromosomal replication in bacteria. FEMS Microbiol. Rev. 2007;31:378–87. doi: 10.1111/j.1574-6976.2007.00070.x. doi:10.1111/j.1574-6976.2007.00070.x. [DOI] [PubMed] [Google Scholar]
- 10.Schoner B., Kahn M. The nucleotide sequence of IS5 from Escherichia coli. Gene. 1981;14:165–74. doi: 10.1016/0378-1119(81)90112-8. doi:10.1016/0378-1119(81)90112-8. [DOI] [PubMed] [Google Scholar]
- 11.Zhou Z.H., Akgun E., Jasin M. Repeat expansion by homologous recombination in the mouse germ line at palindromic sequences. Proc. Natl Acad. Sci. USA. 2001;98:8326–33. doi: 10.1073/pnas.151008498. doi:10.1073/pnas.151008498. [DOI] [PMC free article] [PubMed] [Google Scholar]
- 12.Nasar F., Jankowski C., Nag D.K. Long palindromic sequences induce double-strand breaks during meiosis in yeast. Mol. Cell. Biol. 2000;20:3449–58. doi: 10.1128/mcb.20.10.3449-3458.2000. doi:10.1128/MCB.20.10.3449-3458.2000. [DOI] [PMC free article] [PubMed] [Google Scholar]
- 13.Duggleby R.G. A paucity of palindromes in phi X174. J. Theor. Biol. 1981;93:143–55. doi: 10.1016/0022-5193(81)90061-8. doi:10.1016/0022-5193(81)90061-8. [DOI] [PubMed] [Google Scholar]
- 14.Elhai J. Determination of bias in the relative abundance of oligonucleotides in DNA sequences. J. Comput. Biol. 2001;8:151–75. doi: 10.1089/106652701300312922. doi:10.1089/106652701300312922. [DOI] [PubMed] [Google Scholar]
- 15.Karlin S., Mrazek J., Campbell A.M. Compositional biases of bacterial genomes and evolutionary implications. J. Bacteriol. 1997;179:3899–913. doi: 10.1128/jb.179.12.3899-3913.1997. [DOI] [PMC free article] [PubMed] [Google Scholar]
- 16.Fuglsang A. Distribution of potential type II restriction sites (palindromes) in prokaryotes. Biochem. Biophys. Res. Commun. 2003;310:280–5. doi: 10.1016/j.bbrc.2003.09.014. doi:10.1016/j.bbrc.2003.09.014. [DOI] [PubMed] [Google Scholar]
- 17.Burge C., Campbell A.M., Karlin S. Over- and under-representation of short oligonucleotides in DNA sequences. Proc. Natl Acad. Sci. USA. 1992;89:1358–62. doi: 10.1073/pnas.89.4.1358. doi:10.1073/pnas.89.4.1358. [DOI] [PMC free article] [PubMed] [Google Scholar]
- 18.Lisnic B., Svetec I.K., Saric H., Nikolic I., Zgaga Z. Palindrome content of the yeast Saccharomyces cerevisiae genome. Curr. Genet. 2005;47:289–97. doi: 10.1007/s00294-005-0573-5. doi:10.1007/s00294-005-0573-5. [DOI] [PubMed] [Google Scholar]
- 19.Lu L., Jia H., Droge P., Li J. The human genome-wide distribution of DNA palindromes. Funct. Integr. Genomics. 2007;7:221–7. doi: 10.1007/s10142-007-0047-6. doi:10.1007/s10142-007-0047-6. [DOI] [PubMed] [Google Scholar]
- 20.Gelfand M., Koonin E.V. Avoidance of palindromic words in bacterial and archaeal genomes: a close connection with restriction enzymes. Nucleic Acids Res. 1997;25:2430–9. doi: 10.1093/nar/25.12.2430. doi:10.1093/nar/25.12.2430. [DOI] [PMC free article] [PubMed] [Google Scholar]
- 21.Bird A. CpG-rich islands and the function of DNA methylation. Nature. 1986;321:209–13. doi: 10.1038/321209a0. doi:10.1038/321209a0. [DOI] [PubMed] [Google Scholar]
- 22.Bhagwat A.S., McClelland M. DNA mismatch correction by Very Short Patch repair may have altered the abundance of oligonucleotides in the E. coli genome. Nucleic Acids Res. 1992;20:1663–8. doi: 10.1093/nar/20.7.1663. doi:10.1093/nar/20.7.1663. [DOI] [PMC free article] [PubMed] [Google Scholar]
- 23.Eisen M., Spellman P., Brown P., Botstein D. Cluster analysis and display of genome-wide expression patterns. Proc. Natl Acad. Sci. USA. 1998;95:14863–8. doi: 10.1073/pnas.95.25.14863. [DOI] [PMC free article] [PubMed] [Google Scholar]
- 24.Rice P., Longden I., Bleasby A. EMBOSS: the European Molecular Biology Open Software Suite. Trends Genet. 2000;16:276–7. doi: 10.1016/s0168-9525(00)02024-2. doi:10.1016/S0168-9525(00)02024-2. [DOI] [PubMed] [Google Scholar]
- 25.Mandrioli M. A new synthesis in epigenetics: towards a unified function of DNA methylation from invertebrates to vertebrates. Cell. Mol. Life Sci. 2007;64:2522–4. doi: 10.1007/s00018-007-7231-7. doi:10.1007/s00018-007-7231-7. [DOI] [PMC free article] [PubMed] [Google Scholar]
- 26.Cliften P., Sudarsanam P., Desikan A., et al. Finding functional features in Saccharomyces genomes by phylogenetic footprinting. Science. 2003;301:71–6. doi: 10.1126/science.1084337. doi:10.1126/science.1084337. [DOI] [PubMed] [Google Scholar]
- 27.Tringe S.G., Rubin E.M. Metagenomics: DNA sequencing of environmental samples. Nat. Rev. Genet. 2005;6:805–14. doi: 10.1038/nrg1709. doi:10.1038/nrg1709. [DOI] [PubMed] [Google Scholar]
- 28.Eisen J.A. Environmental shotgun sequencing: its potential and challenges for studying the hidden world of microbes. PLoS Biol. 2007;5:e82. doi: 10.1371/journal.pbio.0050082. [DOI] [PMC free article] [PubMed] [Google Scholar]
- 29.Karlin S., Ladunga I. Comparisons of eukaryotic genomic sequences. Proc. Natl Acad. Sci. USA. 1994;91:12832–6. doi: 10.1073/pnas.91.26.12832. doi:10.1073/pnas.91.26.12832. [DOI] [PMC free article] [PubMed] [Google Scholar]
- 30.Karlin S., Ladunga I., Blaisdell B.E. Heterogeneity of genomes: measures and values. Proc. Natl Acad. Sci. USA. 1994;91:12837–41. doi: 10.1073/pnas.91.26.12837. doi:10.1073/pnas.91.26.12837. [DOI] [PMC free article] [PubMed] [Google Scholar]
- 31.Teeling H., Meyerdierks A., Bauer M., Amann R., Glockner F.O. Application of tetranucleotide frequencies for the assignment of genomic fragments. Environ. Microbiol. 2004;6:938–47. doi: 10.1111/j.1462-2920.2004.00624.x. doi:10.1111/j.1462-2920.2004.00624.x. [DOI] [PubMed] [Google Scholar]
- 32.Rusch D.B., Halpern A.L., Sutton G., et al. The Sorcerer II Global Ocean Sampling expedition: northwest Atlantic through eastern tropical Pacific. PLoS Biol. 2007;5:e77. doi: 10.1371/journal.pbio.0050077. [DOI] [PMC free article] [PubMed] [Google Scholar]
- 33.Altschul S.F., Gish W., Miller W., Myers E.W., Lipman D.J. Basic local alignment search tool. J. Mol. Biol. 1990;215:403–10. doi: 10.1016/S0022-2836(05)80360-2. [DOI] [PubMed] [Google Scholar]
- 34.Dick G.J., Andersson A.F., Baker B.J., et al. Community-wide analysis of microbial genome sequence signatures. Genome Biol. 2009;10:R85. doi: 10.1186/gb-2009-10-8-r85. [DOI] [PMC free article] [PubMed] [Google Scholar]
- 35.Sandberg R., Winberg G., Branden C.I., Kaske A., Ernberg I., Coster J. Capturing whole-genome characteristics in short sequences using a naive Bayesian classifier. Genome Res. 2001;11:1404–9. doi: 10.1101/gr.186401. doi:10.1101/gr.186401. [DOI] [PMC free article] [PubMed] [Google Scholar]
- 36.McHardy A.C., Martin H.G., Tsirigos A., Hugenholtz P., Rigoutsos I. Accurate phylogenetic classification of variable-length DNA fragments. Nat. Methods. 2007;4:63–72. doi: 10.1038/nmeth976. doi:10.1038/nmeth976. [DOI] [PubMed] [Google Scholar]
Associated Data
This section collects any data citations, data availability statements, or supplementary materials included in this article.


