

Abstract
Osteosarcoma is a genetically complex malignancy, predominantly afflicting the adolescent population and associated still with relatively poor long-term outcomes. Although there has been some improvement in the understanding of osteosarcoma biology, this has not yet translated particularly well into therapeutic advances. By using a whole-genome tiling path array for comparative genomic hybridization analysis, we sought to evaluate DNA copy number changes in 22 osteosarcoma tumor samples. Regions of most frequent gains or losses generated by Genomic Identification of Significant Targets in Cancer analysis were evaluated for genes of interest. Correlation of the copy number data with preexisting expression data for these genes yielded not only targets known to be important in osteosarcoma but also novel targets, notably cyclin E1. Fluorescence in situ hybridization and immunohistochemical analysis confirmed the findings. Overexpression of cyclin E1 has potential prognostic and therapeutic implications that are discussed herein.
Osteosarcoma (OS) is the most prevalent malignancy in adolescence and the most common bone malignancy in humans.1 Peak occurrence is as a high-grade metaphyseal lesion of long bones during the adolescent growth spurt, with a smaller second peak after age 50 years, the latter commonly associated with Paget's disease.2 Although there have been improvements in outcomes during the past 3 decades, patients with recurrent or metastatic disease continue to do very poorly, with <20% long-term survival. Approximately 10% to 20% of patients present with detectable metastases.3,4 Overall, 5-year survival is approximately 65%,5,6 and a frequent necessity for debilitating surgery, in addition to chemotherapy, adds to the morbidity associated with this tumor.
Unlike the soft-tissue sarcomas seen with greatest frequency in childhood, including Ewing's sarcoma and alveolar rhabdomyosarcoma, which are classically associated with singular reproducible cytogenetic aberrations, OS is characterized by a karyotype that typically has a heterogeneous pattern of unbalanced, complex chromosomal abnormalities reflecting genomic instability. The genomic complexity of OS includes the notably more common karyotypic gains at 6p12, 17p11, and 12q13 along with less common gains at Xp, Xq, 5q, 6p, 8q, 17p, and 20q and losses at 2q, 3p, 9, 10p, 12q, 13q, 14q, 15q, 16, 17p, and 18q.7 This complexity has created considerable difficulty in the identification of key genetic events in the pathogenesis and progression of this disease. Previous studies have extensively described the genomic and chromosomal abnormalities in OS (reviewed in the article by Sandberg and Bridge8), with early reports implicating the role of copy number changes on chromosome 19 in OS.9 For the development of novel prognostic markers and therapeutic targets, a better understanding of the underlying genetic events leading to osteosarcomagenesis is required. At this time, prognosis hinges largely on the relatively crude analysis of the presence/absence of metastasis at presentation and the percentage of tumor necrosis after neoadjuvant chemotherapy, as estimated using the Huvos grading system.10
Some insights into OS biogenesis have been gained by studying familial OS predisposition syndromes, such as hereditary retinoblastoma and Li-Fraumeni, Rothmund-Thomson, and Werner syndromes. These predisposition syndromes all arise secondary to germline loss of function mutations in genes important in cell cycle control or DNA integrity, and although they account for few OSs overall, similar mutations occur somatically in sporadic cases also.
Herein, we describe an analysis of copy number alterations in OS using a whole-genome tiling path approach with cross-reference to preexisting expression data and with validation of the results through combined modalities of fluorescence in situ hybridization (FISH) and immunohistochemical analysis.
Materials and Methods
Whole-Genome Tiling Path Array Comparative Genomic Hybridization and Data Analysis
DNA extracted from 22 snap-frozen OSs was analyzed by array comparative genomic hybridization (aCGH). The tumors were obtained from the Children's Oncology Group (n = 9) and from the tumor banks of two of the investigators (J.A.S.: n = 3 and D.M.T.: n = 10).
DNA copy number profiles were generated for each of the 22 OSs using whole-genome tiling path bacterial artificial chromosome (BAC) aCGH as previously described.11 Images of the hybridized arrays were analyzed using softWoRx Tracker Spot Analysis software (Applied Precision Inc., Issaquah, WA), and systematic biases were removed from all array data files using a stepwise normalization procedure.12 SeeGH software was used to combine replicates and visualize all data as log2 ratio plots in karyograms.13 Data were filtered to exclude clones with standard deviations between replicate values >0.1. The clones were then positioned based on the March 2006 (NCBI36/hg18) human genome assembly. aCGH-Smooth14 was used to smooth ratio values and identify copy number breakpoints for each sample as previously described.11 The resulting segments and ratio values were then analyzed using the Genomic Identification of Significant Targets in Cancer method15 to determine regions of significant amplification and deletion across the samples. Analysis was performed using GenePattern software (http://www.broadinstitute.org/cancer/software/genepattern, last accessed August 15, 2010) with default settings with the exception of the join segment size = 2. In addition, known regions of copy number variation in the healthy population16 were removed during the analysis. Samples displaying an average log2 ratio of at least 0.8 for a region were considered to have a high-level amplification.11 Last, the copy number status (gain/amplification, neutral, or loss/deletion) of cell cycle components was determined from the smoothed array ratios as previously described.11
Integration of Copy Number Status and Gene Expression Microarray Data
cDNA expression array data for 8 OS and 19 normal tissue xenograft samples were obtained from the Oncogenomics database of the National Cancer Institute's Pediatric Oncology Branch (http://home.ccr.cancer.gov/oncology/oncogenomics, last accessed August 15, 2010).17 Median normalized expression data were obtained for 218 of the 281 genes in regions of significant amplification, based on our own aCGH data, that had corresponding probes on the expression array. Expression values were compared between the OS and normal samples using the U-test and were computed using the ranksum function in MATLAB (The MathWorks Inc., Natick, MA). Because the direction of gene expression difference was predicted to match the direction of copy number difference, one-tailed P values were calculated. A Benjamini-Hochberg multiple hypothesis testing correction was applied based on the total number of gene expression probes analyzed. Probes with a corrected P ≤ 0.01 and displaying at least twofold overexpression in the OS samples compared with in the normal samples were considered significant. If multiple probes mapped to the same gene, the one with the lowest P value was used. Last, significant genes were displayed as heatmaps using Genesis software.18
An independent gene expression data set linked to therapeutic response was obtained (kindly provided by Dietrich A. Stephan, Translational Genomics Research Institute, Pheonix, AZ).19,20 A cassette of cell cycle genes was generated. Gene and array data were median centered and normalized after log transformation and were analyzed using Spearman's rank correlation and average linkage hierarchical clustering (Cluster v3.0).
CCNE1 Copy Number and Expression Analysis in OS Cell Lines
Affymetrix SNP 6.0 data (Affymetrix Inc., Santa Clara, CA) for the 10 OS cell lines were downloaded from the Wellcome Trust Sanger Institute CGP Data Archive (http://www.sanger.ac.uk/genetics/CGP/Archive, last accessed September 19, 2010). Corresponding mRNA expression data, generated using the Affymetrix U133A platform, were downloaded from the Broad Institute website (http://www.broadinstitute.org/cgi-bin/cancer/datasets.cgi, last accessed September 19, 2010) under the “Sanger Cell Line Project” and were subsequently normalized using the robust multi-array average.21 Partek Genomics Suite (Partek Inc., St. Louis, MO) was used to analyze Affymetrix SNP 6.0 data, and copy number profiles for the cell lines were generated against a reference composed of 72 cytogenetically normal individuals in the HapMap collection. SNP 6.0 data for the HapMap samples were obtained through Affymetrix Inc.
Copy number gains and losses were determined using the Genomic Segmentation algorithm in Partek Genomics Suite. The following parameters were used for the segmentation analysis: default settings for all parameters except for minimum genomic markers = 20, P value threshold for adjacent regions having significantly different means = 1 × 10⁻⁶, and P value threshold for deviation from normal (diploid) copy number = 1 × 10⁻⁶.
For copy number and expression correlation analysis, ratios for copy number and unlogged expression values for gene expression were correlated using Pearson's correlation analysis (GraphPad Software Inc., San Diego, CA). The log2 copy number ratio for CCNE1 for each sample was derived using the average of the log2 ratios of the probes encompassed in the CCNE1 locus. Robust multi-array average normalized log2 intensities were used for gene expression.
Validation of Amplification by FISH and Immunohistochemical Analysis
A selection of genes of biological interest, including CCNE1, VEGF, SHC1, CDK4, and MYC (alias c-myc), all showing amplification by aCGH analysis and with previous evidence of overexpression in xenograft models, were validated by FISH on touch imprints prepared from the same snap-frozen tumors included in the original aCGH analysis.
Corresponding BAC clones were selected from the BAC tiling path aCGH for use in FISH validation (Table 1). FISH probes of each BAC were made according to standard procedures.22 Briefly, BACs were grown up in volume, and the DNA was isolated and purified. For CCNE1, the BAC was labeled in equal amounts with spectrum green and spectrum red fluorophore-labeled dUTPs using nick translation labeling (Abbott Laboratories, Ltd., Dublin, Ireland). For MYC, the probe was labeled with spectrum red. The labeled BAC probes were precipitated and resuspended in hybridization buffer before use in FISH. The spectrum red–labeled TelVysion 19q Telomere probe and ToTelvysion mix 14 (Abbott Molecular Inc.) were applied to confirm CCNE1 gene localization and rule out polysomy, and a control chromosome 8 centromere probe (Abbott Molecular Inc.) was used for MYC. Touch preparations were placed on a hotplate at 85°C for 20 minutes before hybridization for FISH analysis. Slides were treated with spotlight pretreatment solution (Invitrogen, Carlsbad, CA) for 15 minutes at 98°C, followed by immersion in dH2O for 6 minutes at room temperature. Slides were rinsed in dH2O for 3 minutes before being dehydrated twice in 100% ethanol for 2 minutes at room temperature. An appropriate commercial telomere probe was added to each differentially labeled BAC probe, including CCNE1, VEGF, SHC1, CDK4, and MYC. Probe mixtures were placed on a sample slide, cohybridized at 75°C for 4 minutes, and then incubated at 37°C overnight in a Hybrite humidity chamber (Abbott Molecular Inc.). The slides were washed in 0.4× standard saline citrate for 2 minutes at 72°C followed by 1 minute in 2× standard saline citrate at room temperature. DAPI II was applied as a counterstain, and slides were viewed using fluorescent microscopy.
Table 1.
BAC Designations for FISH⁎
| Gene | Corresponding BAC used for FISH | Chromosomal locus of gene |
|---|---|---|
| CCNE1 | RP11-104J24 | chr19: 34, 942, 166-35, 092, 631 |
| SHC1 | RP11-624P9 | chr1: 153, 079, 766-153, 230, 241 |
| CDK4 | RP11-66N19 | chr12: 56, 362, 976-56, 513, 586 |
| VEGFa | RP11-710L16 | chr6: 43, 741, 229-43, 925, 174 |
| MYC | RP11-440N18 | chr8: 128, 665, 938-128, 847, 168 |
All the positions are based on the March 2006 (NCBI36/hg18) human genome assembly.
The criteria for calling amplification by FISH analysis were according to standard practice in molecular cytogenetics, ie, that there were more than three signals observed with the probe of interest in the context of two centromeric probe signals only. Generally, however, the signal number was considerably higher than this.
Separate validation by immunohistochemical analysis using commercial antibodies for CCNE1, MYC, VEGF, Runx2, and CDK4 was performed on TMAs made from distinct cases of OS. This TMA, TMA-A, contained 70 OS cases and was provided by J.S. from Toronto. No clinical data were available for these cases. Serial sections of the paraffin-embedded tissue arrays were cut at 4 μm and were placed on charged slides. The slides were placed in a 60°C oven for 1 hour before antigen retrieval was performed. All the sections except those for Ki-67 staining were subjected to 2 minutes at full pressure in citrate buffer (pH 6.0) (Novocastra Laboratories Ltd., Newcastle upon Tyne, UK) using a Prestige pressure cooker (Meyer Group, Ltd., Wirral, England). Antigen retrieval for the slides selected for Ki-67 staining was achieved using the Ventana BenchMark on-board antigen retrieval system (Ventana Medical Systems Inc., Tucson, AZ). Primary antibodies were applied to tissue sections at the following dilutions: VEGF (Novocastra Laboratories Ltd.), 1:250; MYC (Abcam, Cambridge, UK), 1:400; CCNE1 (Novocastra Laboratories Ltd.); RUNX2 (Abcam), 1:300; CDK4 (Abcam), 1:500; and Ki-67 (Dako, Carpentaria, CA), 1:50.
After application of the primary antibodies, detection of antigenic sites was achieved using the Dako REAL EnVision Detection System (Dako, Glostrup Denmark). Detection of Ki-67 in the tissue array sections was achieved using the Ventana BenchMark Ultraview Kit (Ventana Medical Systems Inc.).
Validation of the immunohistochemical staining was performed by using known positive control tissue for each of the primary antibodies and negative control sections where the primary antibody was omitted from the staining procedure.
An in-house TMA (TMA-B) from 61 local cases of OS with known outcomes and documented Huvos scores was built, and antibodies for CCNE1 and Ki-67 were applied to sections specifically to correlate immunostaining patterns with outcomes.
Evaluation of the immunostaining was as follows: CCNE1 staining was scored as 0 (0%), 1 (<50%), or 2 (≥50%). Percentage of positive nuclei was evaluated. Staining intensity did not actually vary sufficiently to warrant separate assessment. Ki-67 immunostaining was scored as 0 to 4 (0 = 0%; 1 = 1% to 24%; 2 = 25% to 49%; 3 = 50% to 74%; and 4 > 75%). Statistical analysis was then performed using parametric tests, including one-way analysis of variance and two-tailed t tests for the relationship of CCNE1 versus necrosis and also for Ki-67 versus necrosis. In addition, any association between Ki-67 and CCNE1 reactivity was tested using the χ2 test.
Results
Regions displaying significant copy number increases as determined by aCGH analysis are shown in Figure 1A, and those showing decreases in gene dosage are shown in Figure 1B. The genes in these regions are listed in Supplemental Tables S1 and S2 (available at http://jmd.amjpathol.org). We pursued further only targets in high-level amplifications (log2 ratio ≥0.8) because these regions undergo multiple rounds of selection during tumorigenesis and are, thus, likely to contain OS oncogenes. Review of the expression profile of OS xenograft models showed that 43 genes were overexpressed in cancer compared with normal tissue samples (defined as greater than twofold average expression and corrected P < 0.01) (Figure 2). Table 2 lists the genes in regions of significant gain as detected in this work that also showed overexpression in the OS xenograft models. This list includes previously identified targets, such as MYC, but also newly identified target cyclin E1. To confirm that amplification is directly associated with the overexpression of CCNE1, an analysis of paired copy number and gene expression data from a panel of 10 commonly used OS cell lines was performed. Tumor cell lines with copy number increase of CCNE1 also display significantly higher gene expression (Pearson's r = 0.8208, two-tailed P = 0.0036), confirming the direct correlation between gene dosage and mRNA levels (Figure 3).
Figure 1.

Regions showing significant amplification (A) and deletion (B) by aCGH analysis generated by Genomic Identification of Significant Targets in Cancer analysis. Segmented copy number data for 22 OS tumors were analyzed using the Genomic Identification of Significant Targets in Cancer algorithm as detailed in Materials and Methods. The resulting statistical significance of the aberrations detected across the sample set are displayed as false discovery rate q-values (t0 account for multiple-hypothesis testing), as indicated by the red (amplification) and blue (deletion) lines and plotted along the x axis. The significance threshold (q < 0.25) is indicated by the vertical green line, with altered regions passing this threshold deemed significant. Chromosome positions are indicated by the alternating white and black bars on the y axis, with the locations of the identified significant peak regions located in the right margin of each figure.
Figure 2.
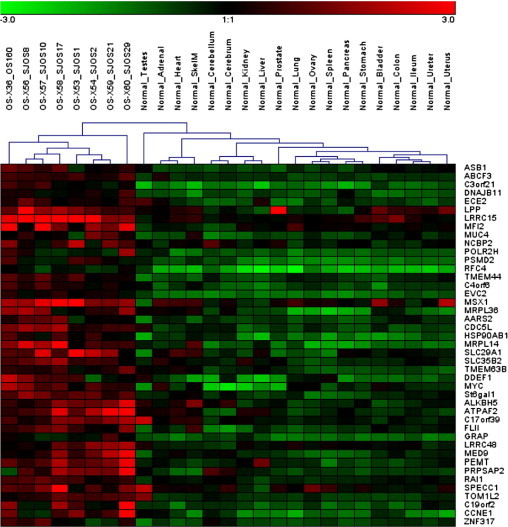
Genes in amplified regions that are overexpressed in mouse OS xenografts compared with normal tissues. Median normalized log2 expression levels for 214 of the 281 genes in regions of significant amplification across the OS tumors were compared between 8 OS and 19 normal tissue xenograft samples, as detailed in Materials and Methods. Genes determined to be overexpressed in the tumor samples (corrected P < 0.01, greater than twofold average expression) are depicted. The 8 samples on the left are OS xenografts and the 19 samples on the right are normal tissue controls, with the organ/tissue of origin indicated on each one individually. The genes differentially expressed are listed from top to bottom along the right edge of the heatmap. Red indicates high relative expression and green indicates low expression of genes.
Table 2.
Genes in Regions of Gain Detected by aCGH but Also Showing Overexpression in OS Xenografts
| Cytoband | GISTIC peak (Mb) | No. of genes in region | Q value | Frequency | No. of high-level amplicons | No. of genes in amplicons | Genes overexpressed in amplicons |
|---|---|---|---|---|---|---|---|
| 1p31.1 | chr1: 80913595-81436461 | 1 | 0.14764 | 0.40909091 | 0 | 0 | NA |
| 2q37.3 | chr2: 236648783-240553953 | 24 | 0.14764 | 0.27272727 | 1 | 1 | ASB1 |
| 3q27.1 | chr3: 182399514-199501827 | 122 | 0.076189 | 0.22727273 | 1 | 14 | RFC4, ABCF3, PSMD2, St6gal1, DNAJB11, LPP, POLR2H, ECE2, MFI2, C3orf21, LRRC15,MUC4, NCBP2, TMEM44 |
| 4p16.2 | chr4: 4198063-9033841 | 38 | 0.18495 | 0.18181818 | 1 | 3 | C4orf6, EVC2, MSX1 |
| 5p15.33 | chr5: 1466967-3126580 | 7 | 0.0052898 | 0.45454545 | 3 | 1 | MRPL36 |
| 6p21.1 | chr6: 44071004-44937411 | 13 | 0.151 | 0.36363636 | 1 | 7 | HSP90AB1, SLC35B2, CDC5L, AARS2, TMEM63B, SLC29A1, MRPL14 |
| 8q21.2 | chr8: 86360351-87104014 | 5 | 0.057605 | 0.31818182 | 1 | 0 | NA |
| 8q24.21 | chr8: 128540245-131301767 | 4 | 0.047871 | 0.40909091 | 1 | 2 | DDEF1, MYC |
| 12q12 | chr12: 37837573-40257330 | 7 | 0.058284 | 0.22727273 | 2 | 0 | NA |
| 17p11.2 | chr17: 17326082-20319393 | 41 | 0.21611 | 0.22727273 | 2 | 12 | ALKBH5, ATPAF2, C17orf39, FLII, RAP, LRRC48, MED9, PEMT, RAI1, SPECC1, TOM1L2, PRPSAP2 |
| 19p13.2 | chr19: 8652074-9173155 | 11 | 0.24861 | 0.22727273 | 1 | 1 | ZNF317 |
| 19q12 | chr19: 34140992-37250591 | 8 | 0.057605 | 0.27272727 | 2 | 2 | C19orf2, CCNE1 |
GISTIC, Genomic Identification of Significant Targets in Cancer; NA, not applicable.
Figure 3.
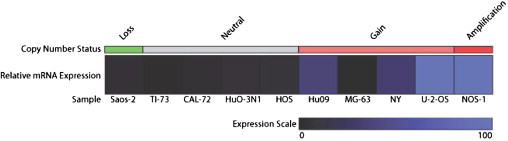
Impact of copy number alterations on the mRNA expression of CCNE1 in OS cell lines. Relative expression values for samples with copy number loss, no copy number change, gain, and amplification are shown in a heatmap generated using Genesis software.18 Copy number status was determined as follows: loss, fewer than two copies; neutral, two copies; gain, more than two copies; and amplification, 5 or more copies. Expression data were normalized and scaled from 0 to 100.
In light of the finding of amplification of CCNE1, separate analysis of cell cycle components represented on the CGH array was conducted, and the results (Figure 4) show that 19 of the 22 OSs (86%) had an alteration in at least one target that could lead to increased cell cycle. Note that the patterns for CCNE1 and CCNE2 are disparate.
Figure 4.
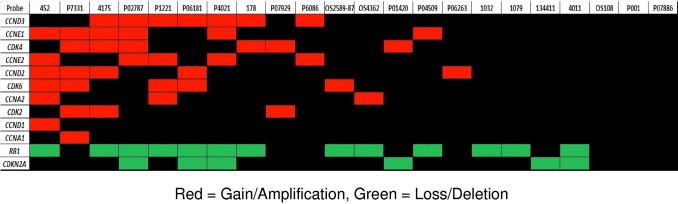
DNA copy number changes in cell cycle components across the 22 OS tumors. The copy number status of a selected panel of genes with well-characterized roles in cell cycle control was determined for each tumor sample, as detailed in Materials and Methods. The resulting alterations thought to promote cell cycle progression (gain of cyclins and CDKs, loss of Rb1 and CDKN2A) are indicated. Nineteen of 22 cases (86%) contained an alteration in at least one of these genes that could potentially result in increased cell cycle. Each vertical column represents a single OS sample, with the corresponding sample identification denoted at the top. Red cells indicate copy number gain; green cells, copy number loss; and black cells, no change.
Mutations in Rb1 are not mutually exclusive with those affecting the E-type cyclins, with seven samples (32%) showing amplification of cyclin E1 and E2 and loss of Rb1, eight samples (36%) showing loss of Rb1 without amplification of E-type cyclins, and three samples (14%) showing amplification of either E-type cyclin without loss of Rb1.
Using an independent test set,19 the relationship between expression levels of components of the cell cycle and therapeutic response to neoadjuvant chemotherapy was examined (Figure 5). No relationship between expression of CCNE1 or CCNE2 and response to chemotherapy (measured by Huvos score) was observed. Markers of S phase (proliferating cell nuclear antigen, thymidine kinase, dihydrofolate reductase, mini-chromosome maintenance proteins, 4, and 5) were negatively correlated with expression of CCND1-3, Rb1, CDK4, and CDK6. In addition, CCNE1 and CCNE2 seem to be expressed in a mostly mutually exclusive pattern, consistent with functional redundancy for these isoforms. CCNE1 and CCNE2 are, in turn, negatively correlated with Rb1 expression. These data suggest that regardless of mutation status, there is a reciprocal relationship between the expression levels of these components of the cell cycle pathway.
Figure 5.
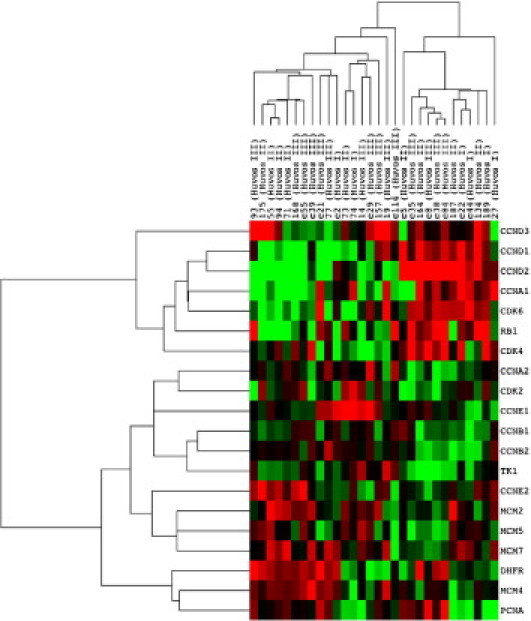
Supervised analysis of cell cycle–related gene expression in primary OS. Genes were selected manually for their role in cell cycle progression and as markers for proliferation. The genes differentially expressed are listed from top to bottom along the right edge of the heatmap. Red indicates overexpression and green indicates relative underexpression of genes.
FISH analysis of touch imprints made from the snap-frozen tumors included in the aCGH analysis confirmed amplification of CCNE1, MYC, CDK4, SHC1, and VEGF in the relevant cases (Figure 6).
Figure 6.
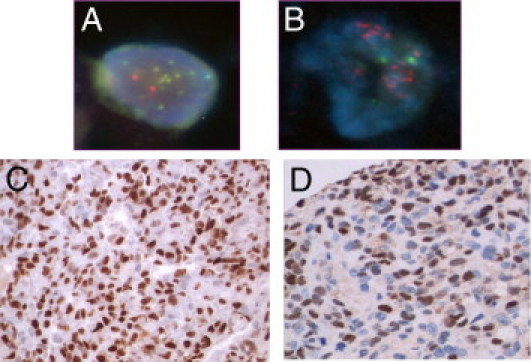
FISH analysis showing amplification of CCNE1 (A) and MYC (B) on touch imprints, with immunohistochemical analysis for CCNE1 (C) and MYC (D) as applied to OS TMA-A.
Validation by immunohistochemical analysis on a TMA containing 70 cases of OS (TMA-A) showed evidence of expression in 54% of cases for CCNE1, 25% for MYC, 21% for CDK4, 20% for Runx2, and 16% for VEGF (Figure 6).
Analysis of immunostaining for CCNE1 and Ki-67 and clinical outcome showed no relationship between Huvos score and immunoreactivity (P = 0.091) for CCNE1 in the 35 cases that were evaluable from TMA-B. Similarly, Ki-67 staining showed no significant correlation with percentage of necrosis in the treated OSs (P = 0.362).
Discussion
The genetics of OS are complex. Insights gained from the rare familial OS predisposition syndromes indicate that loss of cell cycle control is important in OS formation. In particular, the retinoblastoma protein is frequently directly mutated in sporadic OS, and kindreds carrying one mutant allele are reported to have a manyfold greater risk of OS.1 Indeed, 86% of the cases in this cohort showed gross copy number changes involving members of the Rb1 pathway, in addition to which presumably point mutations, epigenetic changes, and smaller genomic aberrations beyond the resolution of aCGH inactivated the remaining alleles.
We identified several amplified genes of interest, including several previously identified as amplified in OS (eg, MYC) (Table 2). The focus of this study was the amplification and associated overexpression of CCNE1, which is a novel finding. The amplification of the CCNE1 locus evident in this OS cohort suggests that, at least in some cases, overexpression of CCNE1 is direct and not simply due to derepression of E2F by other mechanisms.
Up-regulation of CCNE1 has long been reported in Rb1−/− cells, consistent with transcriptional regulation by E2F,23,24 and it is tempting to link the amplification to its role as a negative regulator of pRb1. Inherited mutations in Rb1 confer a 500-fold increased risk of OS. In most human cancer cells, the Rb1 pathway is perturbed through loss of p16/INK4A, overexpression of CCND1, amplification of activating mutations affecting CDK4, or loss of function events affecting pRb1 itself. In this study, expression of D-type cyclins and CDK4 with Rb1 is consistent with a role for inactivation of pRb1 by these proteins.
However, the story is not so simple. In the present samples, overexpression of CCNE was seen in tumors in which Rb1 expression was low, suggesting that, unlike the D-type cyclins and CDK4, that CCNE may have Rb1-independent functions. Although the best-characterized role of CCNE is in interaction with CDK2 to phosphorylate pRb1, in vivo CCNEs are not required for normal phosphorylation of pRb1.25 It is possible that overexpression of CCNE1 might serve as a mechanism for inactivation of other members of the pocket protein family, as CCNE1 reportedly is involved in p107 and p130 phosphorylation.26,27 Apart from the canonical role of CCNE in the activation of CDK2, additional kinase-independent functions of the E cyclins have come to light. These became apparent initially through the observation of embryonic lethality of CCNE1−/−,CCNE2−/− mice, whereas CDK2−/− mice are viable. Mouse embryonic fibroblasts from the CCNE−/− mice are incapable of reentering the cell cycle from quiescence.25 CCNE1, through its interaction with CDT1, is required for the loading of mini-chromosome maintenance protein in replication complexes.28 Other recently discovered kinase-independent functions of CCNE1 include the embryonic lethality of CCNE1−/−, CCNE2−/− mice due to failure of endoreplication in placental trophoblast cells. CCNE−/− cells are resistant to oncogenic transformation, and an additional kinase-independent role of CCNE1 is in the restoration of oncogenic transformation of CCNEnull cells by key oncogenes.29 It has, therefore, been suggested that CCNE overexpression might be an early oncogenic event, facilitating additional steps in the progression of tumors.
CCNE1, but not CCNE2, was overexpressed in this OS cohort. We also observed a trend toward an inverse relationship between CCNE1 and CCNE2 in an independent test set.19 In vertebrates, two forms of cyclin E exist, CCNE1 and CCNE2, phylogenetically equidistant from the CCNE occurring in invertebrates.30 CCNE1 and CCNE2 differ in their patterns of tissue expression, transcriptional regulation, microRNA regulation, and protein processing. They also seem to differ in their roles in endoreplication, which may enhance tumorigenesis through genomic instability.31 This is intriguing in the context of any putative contributory effect of CCNE1 on genomic instability, a classic feature of OS and one for which we found evidence in the cohort of cases with genetic alterations ranging from whole arm gains and losses to ladder-like regions of interspersed high-level amplifications, likely indicative of multiple breakage-fusion-bridge cycles.
CCNE1 and CCNE2 promote oncogenic transformation, and, indeed, CCNE transgenic mice develop malignancies32; however, the expression levels of CCNE1 and CCNE2 in a variety of human cancers tend to be disparate, with CCNE1 more frequently overexpressed. In breast carcinoma, high levels of CCNE1 correlated more closely with the proliferative index than did CCNE2.30 In the present OS cases, we did not find a relationship between Ki-67 immunoreactivity and CCNE1 expression. Amplification at chromosome 19q in the region of CCNE1 and overexpression of CCNE1 in serous ovarian carcinomas were associated with poor response to cisplatin-based chemotherapy.33 These authors also dissociated the putative cisplatin-resistance roles for CCNE1 from a cell cycle effect. Cisplatin is an important component of the cytotoxic therapy for OS. We have not demonstrated any association of CCNE1 expression with chemotherapy response (Figure 5).
In conclusion, OS is a clinically and histologically heterogeneous and genetically complex malignancy, with, from these studies, a substantial proportion of cases showing overexpression of CCNE1. Overexpression of CCNE1 has been associated with early relapse and poor outcome in ovarian cancers, and further exploration of the prognostic implications of CCNE1 up-regulation in OS is warranted.
Acknowledgment
We thank Sarah O'Dowd for her assistance with the immunohistochemical staining.
Footnotes
Supported by the Children's and Women's Research Center and The University of British Columbia, Vancouver, BC, Canada (M.J.O.); the Children's Medical and Research Foundation, Dublin, Ireland (M.J.O.); and a Victorian Cancer Agency Clinician Researcher Fellowship (D.M.T.).
CME Disclosure: None of the authors disclosed any relevant financial relationships.
Supplemental material for this article can be found at http://jmd.amjpathol.org or at doi:10.1016/j.jmoldx.2010.11.020.
Supplementary data
References
- 1.Kansara M., Thomas D.M. Molecular pathogenesis of osteosarcoma. DNA Cell Biol. 2007;26:1–18. doi: 10.1089/dna.2006.0505. [DOI] [PubMed] [Google Scholar]
- 2.Hansen M.F. Genetic and molecular aspects of osteosarcoma. J Musculoskelet Neuronal Interact. 2002;2:554–560. [PubMed] [Google Scholar]
- 3.Meyers P.A., Heller G., Healey J.H., Huvos A., Applewhite A., Sun M., LaQuaglia M. Osteogenic sarcoma with clinically detectable metastasis at initial presentation. J Clin Oncol. 1993;11:449–453. doi: 10.1200/JCO.1993.11.3.449. [DOI] [PubMed] [Google Scholar]
- 4.Meyers P.A., Gorlick R. Osteosarcoma. Pediatr Clin North Am. 1997;44:973–989. doi: 10.1016/s0031-3955(05)70540-x. [DOI] [PubMed] [Google Scholar]
- 5.Greene L.F. AJCC Cancer Staging Manual. Springer-Verlag; New York: 2002. [Google Scholar]
- 6.Lamoureux F., Trichet V., Chipoy C., Blanchard F., Gouin F., Redini F. Recent advances in the management of osteosarcoma and forthcoming therapeutic strategies. Expert Rev Anticancer Ther. 2007;7:169–181. doi: 10.1586/14737140.7.2.169. [DOI] [PubMed] [Google Scholar]
- 7.Lau C.C., Harris C.P., Lu X.Y., Perlaky L., Gogineni S., Chintagumpala M., Hicks J., Johnson M.E., Davino N.A., Huvos A.G., Meyers P.A., Healy J.H., Gorlick R., Rao P.H. Frequent amplification and rearrangement of chromosomal bands 6p12-p21 and 17p11.2 in osteosarcoma. Genes Chromosomes Cancer. 2004;39:11–21. doi: 10.1002/gcc.10291. [DOI] [PubMed] [Google Scholar]
- 8.Sandberg A.A., Bridge J.A. Updates on the cytogenetics and molecular genetics of bone and soft tissue tumors: osteosarcoma and related tumors. Cancer Genet Cytogenet. 2003;145:1–30. [PubMed] [Google Scholar]
- 9.Zielenska M., Bayani J., Pandita A., Toledo S., Marrano P., Andrade J., Petrilli A., Thorner P., Sorenson P., Squire J.A. Comparative genomic hybridization analysis identifies gains of 1p35 approximately p36 and chromosome 19 in osteosarcoma. Cancer Genet Cytogenet. 2001;130:14–21. doi: 10.1016/s0165-4608(01)00461-7. [DOI] [PubMed] [Google Scholar]
- 10.Rosen G., Caparros B., Huvos A.G., Kosloff C., Nirenberg A., Cacavio A., Marcove R.C., Lane J.M., Mehta B., Urban C. Preoperative chemotherapy for osteogenic sarcoma: selection of postoperative adjuvant chemotherapy based on the response of the primary tumor to preoperative chemotherapy. Cancer. 1982;49:1221–1230. doi: 10.1002/1097-0142(19820315)49:6<1221::aid-cncr2820490625>3.0.co;2-e. [DOI] [PubMed] [Google Scholar]
- 11.Lockwood W.W., Chari R., Coe B.P., Girard L., Macaulay C., Lam S., Gazdar A.F., Minna J.D., Lam W.L. DNA amplification is a ubiquitous mechanism of oncogene activation in lung and other cancers. Oncogene. 2008;27:4615–4624. doi: 10.1038/onc.2008.98. [DOI] [PMC free article] [PubMed] [Google Scholar]
- 12.Khojasteh M., Lam W.L., Ward R.K., MacAulay C. A stepwise framework for the normalization of array CGH data. BMC Bioinformatics. 2005;6:274. doi: 10.1186/1471-2105-6-274. [DOI] [PMC free article] [PubMed] [Google Scholar]
- 13.Chi B., deLeeuw R.J., Coe B.P., Ng R.T., MacAulay C., Lam W.L. MD-SeeGH: a platform for integrative analysis of multi-dimensional genomic data. BMC Bioinformatics. 2008;9:243. doi: 10.1186/1471-2105-9-243. [DOI] [PMC free article] [PubMed] [Google Scholar]
- 14.Jong K., Marchiori E., Meijer G., Vaart A.V., Ylstra B. Breakpoint identification and smoothing of array comparative genomic hybridization data. Bioinformatics. 2004;20:3636–3637. doi: 10.1093/bioinformatics/bth355. [DOI] [PubMed] [Google Scholar]
- 15.Beroukhim R., Getz G., Nghiemphu L., Barretina J., Hsueh T., Linhart D., Vivanco I., Lee J.C., Huang J.H., Alexander S., Du J., Kau T., Thomas R.K., Shah K., Soto H., Perner S., Prensner J., Debiasi R.M., Demichelis F., Hatton C., Rubin M.A., Garraway L.A., Nelson S.F., Liau L., Mischel P.S., Cloughesy T.F., Meyerson M., Golub T.A., Lander E.S., Mellinghoff I.K., Sellers W.R. Assessing the significance of chromosomal aberrations in cancer: methodology and application to glioma. Proc Natl Acad Sci U S A. 2007;104:20007–20012. doi: 10.1073/pnas.0710052104. [DOI] [PMC free article] [PubMed] [Google Scholar]
- 16.Wong K.K., deLeeuw R.J., Dosanjh N.S., Kimm L.R., Cheng Z., Horsman D.E., MacAulay C., Ng R.T., Brown C.J., Eichler E.E., Lam W.L. A comprehensive analysis of common copy-number variations in the human genome. Am J Hum Genet. 2007;80:91–104. doi: 10.1086/510560. [DOI] [PMC free article] [PubMed] [Google Scholar]
- 17.Whiteford C.C., Bilke S., Greer B.T., Chen Q., Braunschweig T.A., Cenacchi N., Wei J.S., Smith M.A., Houghton P., Morton C., Reynolds C.P., Lock R., Gorlick R., Khanna C., Thiele C.J., Takikita M., Catchpoole D., Hewitt S.M., Khan J. Credentialing preclinical pediatric xenograft models using gene expression and tissue microarray analysis. Cancer Res. 2007;67:32–40. doi: 10.1158/0008-5472.CAN-06-0610. [DOI] [PubMed] [Google Scholar]
- 18.Sturn A., Quackenbush J., Trajanoski Z. Genesis: cluster analysis of microarray data. Bioinformatics. 2002;18:207–208. doi: 10.1093/bioinformatics/18.1.207. [DOI] [PubMed] [Google Scholar]
- 19.Mintz M.B., Sowers R., Brown K.M., Hilmer S.C., Mazza B., Huvos A.G., Meyers P.A., Lafleur B., McDonough W.S., Henry M.M., Ramsey K.E., Antonescu C.R., Chen W., Healey J.H., Daluski A., Berens M.E., Macdonald T.J., Gorlick R., Stephan D.A. An expression signature classifies chemotherapy-resistant pediatric osteosarcoma. Cancer Res. 2005;65:1748–1754. doi: 10.1158/0008-5472.CAN-04-2463. [DOI] [PubMed] [Google Scholar]
- 20.Kansara M., Tsang M., Kodjabachian L., Sims N.A., Trivett M.K., Ehrich M., Dobrovic A., Slavin J., Choong P.F.M., Simmons P.J., Dawid I.B., Thomas D.M. Wnt inhibitory factor 1 is epigenetically silenced in human osteosarcoma, and targeted disruption accelerates osteosarcomagenesis in mice. J Clin Invest. 2009;119:837–851. doi: 10.1172/JCI37175. [DOI] [PMC free article] [PubMed] [Google Scholar]
- 21.Irizarry R.A., Hobbs B., Collin F., Beazer-Barclay Y.D., Antonellis K.J., Scherf U., Speed T.P. Exploration, normalization, and summaries of high density oligonucleotide array probe level data. Biostatistics. 2003;4:249–264. doi: 10.1093/biostatistics/4.2.249. [DOI] [PubMed] [Google Scholar]
- 22.Morrison L.E., Legator M.S. Multicolour FISH techniques. In: Andreeff M., Pinkel D., editors. Introduction to Fluorescence In Situ Hybridization: Principles and Clinical Applications. Wiley-Liss Inc; New York: 1999. pp. 3–12. [Google Scholar]
- 23.Herrera R.E., Sah V.P., Williams B.O., Makela T.P., Weinberg R.A., Jacks T. Altered cell cycle kinetics, gene expression, and G1 restriction point regulation in Rb-deficient fibroblasts. Mol Cell Biol. 1996;16:2402–2407. doi: 10.1128/mcb.16.5.2402. [DOI] [PMC free article] [PubMed] [Google Scholar]
- 24.Hurford R.K., Jr., Cobrinik D., Lee M.H., Dyson N. pRB and p107/p130 are required for the regulated expression of different sets of E2F responsive genes. Genes Dev. 1997;11:1447–1463. doi: 10.1101/gad.11.11.1447. [DOI] [PubMed] [Google Scholar]
- 25.Geng Y., Yu Q., Sicinska E., Das M., Schneider J.E., Bhattacharya S., Rideout W.M., Bronson R.T., Gardner H., Sicinski P. Cyclin E ablation in the mouse. Cell. 2003;114:431–443. doi: 10.1016/s0092-8674(03)00645-7. [DOI] [PubMed] [Google Scholar]
- 26.Xiao Z.X., Ginsberg D., Ewen M., Livingston D.M. Regulation of the retinoblastoma protein-related protein p107 by G1 cyclin-associated kinases. Proc Natl Acad Sci U S A. 1996;93:4633–4637. doi: 10.1073/pnas.93.10.4633. [DOI] [PMC free article] [PubMed] [Google Scholar]
- 27.Li Y., Graham C., Lacy S., Duncan A.M.V., Whyte P. The adenovirus E1A-associated 130-kD protein is encoded by a member of the retinoblastoma gene family and physically interacts with cyclins A and E. Genes Dev. 1993;7:2366–2377. doi: 10.1101/gad.7.12a.2366. [DOI] [PubMed] [Google Scholar]
- 28.Zhang H. Life without kinase: cyclin E promotes DNA replication licensing and beyond. Mol Cell. 2007:175–176. doi: 10.1016/j.molcel.2007.01.008. [DOI] [PubMed] [Google Scholar]
- 29.Geng Y., Lee Y.M., Welcker M., Swanger J., Zagozdzon A., Winer J.D., Roberts J.M., Kaldis P., Clurman B.E., Sicinski P. Kinase-independent function of cyclin E. Mol Cell. 2007;25:127–139. doi: 10.1016/j.molcel.2006.11.029. [DOI] [PubMed] [Google Scholar]
- 30.Caldon C.E., Musgrove E.A. Distinct and redundant functions of cyclin E1 and cyclin E2 in development and cancer. Cell Div. 2010;5:2. doi: 10.1186/1747-1028-5-2. [DOI] [PMC free article] [PubMed] [Google Scholar]
- 31.Spruck C.H., Won K.A., Reed S.I. Deregulated cyclin E induces chromosome instability. Nature. 1999;401:297–300. doi: 10.1038/45836. [DOI] [PubMed] [Google Scholar]
- 32.Moroy T., Geisen C. Cyclin E. Int J Biochem Cell Biol. 2004;36:1424–1439. doi: 10.1016/j.biocel.2003.12.005. [DOI] [PubMed] [Google Scholar]
- 33.Etemadmoghadam D., deFazio A., Beroukhim R., Mermel C., George J., Getz G., Tothill R., Okamoto A., Raeder M.B., Harnett P., Lade S., Akslen L.A., Tinker A.V., Locandro B., Alsop K., Chiew Y.E., Traficante N., Fereday S., Johnson D., Fox S., Sellers W., Urashima M., Salvesen H.B., Meyerson M., Bowtell D. Integrated genome-wide DNA copy number and expression analysis identifies distinct mechanisms of primary chemoresistance in ovarian carcinomas. Clin Cancer Res. 2009;15:1417–1427. doi: 10.1158/1078-0432.CCR-08-1564. [DOI] [PMC free article] [PubMed] [Google Scholar]
Associated Data
This section collects any data citations, data availability statements, or supplementary materials included in this article.