

Abstract
Starving Myxococcus xanthus bacteria use their motility systems to self-organize into multicellular fruiting bodies, large mounds in which cells differentiate into metabolically inert spores. Despite the identification of the genetic pathways required for aggregation and the use of microcinematography to observe aggregation dynamics in WT and mutant strains, a mechanistic understanding of aggregation is still incomplete. For example, it is not clear why some of the initial aggregates mature into fruiting bodies, whereas others disperse, merge, or split into two. Here, we develop high-throughput image quantification and statistical analysis methods to gain insight into M. xanthus developmental aggregation dynamics. A quantitative metric of features characterizing each aggregate is used to deduce the properties of the aggregates that are correlated with each fate. The analysis shows that small aggregate size but not neighbor-related parameters correlate with aggregate dispersal. Furthermore, close proximity is necessary but not sufficient for aggregate merging. Finally, splitting occurs for those aggregates that are unusually large and elongated. These observations place severe constraints on the underlying aggregation mechanisms and present strong evidence against the role of long-range morphogenic gradients or biased cell exchange in the dispersal, merging, or splitting of transient aggregates. This approach can be expanded and adapted to study self-organization in other cellular systems.
Keywords: development, pattern formation
The Myxococcales is an order of δ-proteobacteria with a unique life cycle (1). During their growth phase, cells move in large swarms, preying on other microorganisms and digesting insoluble macromolecules. When faced with nutritional stress at high density on a solid surface, cells aggregate into a fruiting body and differentiate dormant myxospores. Fruiting bodies vary from simple mounds in Myxococcus xanthus to elaborately branched structures as found in Chrondromyces crocatus. Most of the effort to understand fruiting body morphogenesis has been directed at M. xanthus. Mutational studies have shown that either one of the two surface gliding motility systems directs movement into fruiting bodies with sufficient temporal and spatial coordination (2). Nevertheless, the molecular mechanism of aggregation has remained elusive.
Microcinematography (time-lapse microscopy) has been used to examine fruiting body development of the WT strain DK1622 and several mutants. Morphogenesis begins about 6–8 h after amino acid limitation with a dramatic burst of cell movement (3). Swarms of cells coalesce into small aggregates about three cell layers thicker than the already thick but flat cell mat. These aggregates move across the surface of the cell mat, sometimes dissolving into the mat and other times fusing with other aggregates until a much larger and spatially stable aggregate is formed. These larger aggregates begin recruiting cells from the cell mat below them and are quite large by 13.5 h, the time when the analysis in this paper begins. In WT cells, the vertical growth of the fruiting body is obscured by an extracellular matrix (ECM). pilA (MXAN_5783) mutant DK10410 produces much less ECM material, allowing the visualization of cell movement in the fruiting body throughout much of aggregation. pilA fruiting bodies are extended vertically by adding cellular monolayers to the uppermost surface of the fruiting body. Each tier emanates from one or occasionally, two points in the lower layer and spreads evenly across the surface (3).
Aggregates continue to disperse throughout the aggregation process even as late as 24 h or until sporulation ensues (3). The aggregates disperse one tier at a time beginning with the uppermost tier by the reverse process until all of the cells disperse into the cell mat. Although dispersal is the fate of the majority of disappearing aggregates, some aggregates in close proximity merge when one aggregate moves to join another. During aggregate fusion, it seems as if cells in the lowest level carry the aggregate over the surface. Although these results suggest that the fate of nascent aggregates is determined by internal and/or local processes, the biophysical mechanism is unknown.
Despite extensive use of microcinematography to examine aggregation (3–6), interpretation has been mainly qualitative. A quantitative metric is essential to assess the agreement of experimentally observed aggregation patterns with those produced by mathematical models aiming to reproduce the morphogenesis in silico. Although various groups identified overlapping but distinct sets of model ingredients that lead to aggregation in computational simulations (6–10), further quantification of experimental data is essential to refine these models.
Here, statistical image analysis and feature extraction methods are used to quantitatively characterize time-lapse images containing thousands of nascent aggregates. Aggregates are automatically tracked in space and time to identify their fates. We propose a list of 33 parameters (features) that characterize each nascent aggregate and cluster these features into four major classes. Thereafter, we use statistical image analysis to identify the main features controlling aggregate fate during dispersal, merging, and splitting.
Results
Dynamics of Aggregation as Depicted by Microcinematography.
The most widely used laboratory conditions for initiating M. xanthus development were used (Methods). Under these conditions, the fruiting bodies are so dense that many aggregates are in close proximity with one another, with about 160 fruiting bodies in the field of view (Fig. 1). Within the nascent fruiting body, some cells undergo programmed cell death (PCD), whereas others form myxospores (11, 12).
Fig. 1.

Image sequence describing M. xanthus aggregation dynamics. (A) Selected frames from time-lapse microcinematography (Movie S1). Times are noted in the upper right-hand corner of the frame. Aggregation begins at ∼9 h, and the number of aggregates decreases beginning at about 13.5 h. Lower shows binary images processed for aggregate detection (Methods and SI Text). (B–D) Various fates of transient aggregates during development. (B) Aggregates stay or disperse. (C) Two aggregates merge. (D) One aggregate beginning to split into two.
This work focuses on the dynamics of aggregate formation and fate. Initially, many more aggregates form than survive to become fruiting bodies (Fig. 1A). Over a period of about 24 h, many of the aggregates receded into the cell mat, where the cells disperse to join other aggregates (Fig. 1B). In some cases, aggregates in close proximity merge to form one large fruiting body (Fig. 1C). In rare cases, unusually large aggregates split to form two smaller fruiting bodies (Fig. 1D).
Image Segmentation, Feature Extraction, and Quantification.
For the current analysis, we focused on the properties of transient and stationary aggregates. The first step involved separating each time-lapse image into individual aggregates and surrounding spaces using a combination of standard segmentation algorithms based on Markov random field (MRF) (13) (Methods and SI Text). Segmentation is based on the idea that aggregates are darker in intensity than the surrounding field. A label is applied for each pixel: pixels within aggregates are labeled one, and the remaining pixels are labeled zero. Assuming that labels vary gradually everywhere, except at aggregate boundaries, and that the grayscale image intensity of the original image is related to segmentation, we reduce segmentation to optimization of the energy function, which includes terms penalizing discontinuity and rewarding correlations between grayscale and binary intensity. The segmented images are, thereafter, converted to binary images, with black aggregates surrounded by the white spacing (Fig. 1A Lower).
Segmentation is applied to each time frame image and then linked with subsequent images by detecting overlapping aggregates. This approach allows us to discern the three aggregate fates depicted in Figs. 1 B–D. Statistical analysis of the images was used to decrypt properties of individual aggregates that influence their fate. To this end, an extensive list of features (parameters) was devised that can characterize each aggregate according to its geometry, proximity to other aggregates, and size. A complete list of the 33 features is listed in Table 1. The representative features include distance to nearest neighbor, aggregate area and perimeter, area of the nearest neighbor, total, average, minimal, and maximal areas of surrounding neighbors, solidity, eccentricity, and others. The list also includes features defined as ratios of individual features. All 33 features are automatically identified for each aggregate present in each frame of the time-lapse movie. The list of the features introduced is quite exhaustive and sufficient for our purposes but can, nevertheless, be further extended with new features or mathematical functions of existing features.
Table 1.
Aggregate features used in this study
| No. | Description |
| 1 | Distance to the NN*/average weighted area of neighbors† |
| 2 | Average distance to neighbors |
| 3 | Distance to the NN |
| 4 | Equivalent diameter/distance to the NN |
| 5 | Area/area of the NN |
| 6 | Area/neighboring area |
| 7 | Area/sum of the area of neighbors |
| 8 | Equivalent diameter/average weighted area of neighbors† |
| 9 | Area/maximal area of neighbors |
| 10 | Area/median area of neighbors |
| 11 | Area/average area of neighbors |
| 12 | Area/minimal area of neighbors |
| 13 | Perimeter |
| 14 | Equivalent diameter, 
|
| 15 | Area |
| 16 | Distance to the NN/equivalent diameter |
| 17 | Neighboring area‡ |
| 18 | Sum of distance to neighbors |
| 19 | Weighted sum area of neighbors |
| 20 | Sum of equivalent diameter of neighbors |
| 21 | Sum of area of neighbors |
| 22 | Area of the NN |
| 23 | Minimal area of neighbors |
| 24 | Average weighted area of neighbors |
| 25 | Median area of neighbors |
| 26 | Maximal area of neighbors |
| 27 | Average equivalent diameter of neighbors |
| 28 | Average area of neighbors |
| 29 | Orientation |
| 30 | Equivalent diameter/perimeter |
| 31 | Solidity |
| 32 | Eccentricity |
| 33 | Minor axis length/major axis length |
*Nearest neighbor.
†Weighted sum of all areas of neighbors within a circular neighborhood with one/distance being a weight.
‡Area of circular neighborhood filled with aggregates.
The features indentified in the list are not completely independent and may show a high degree of correlation. To further identify biologically meaningful features of aggregates, we automatically identified the list of 33 features for ∼160 aggregates from the last time frame of the aggregation movie and use these data to compose 33 vectors (one for each feature) containing the values of these feature for each of the aggregates. The Spearman correlation between the features was calculated, and Euclidean distance between correlation coefficients was used to build a binary tree-based clustering of the features. The features divide into four major clusters representing features associated with the aggregate's proximity to neighbors (1–3), various size parameters (4–15), parameters of the aggregate's neighbors (17–28), and image shape and topology (30–33) (Fig. 2). It is interesting to note that aggregate orientation (29) is clustered together with shape-related features. However, feature 16, the ratio of the nearest neighbor distance to the equivalent diameter, clusters separately from both proximity and size.
Fig. 2.

Characterization of M. xanthus aggregate features derived from microscope images. A set of 33 features encompassing multiple aspects of each aggregate was automatically detected for more than 150 aggregates from the last frame of time-lapse movies. These data were used to compute Spearman correlation-based distance between features and cluster these features. Four of the clusters have biological relevance: features associated with aggregate proximity to its neighbors (blue), features related to aggregate size (purple), features associated with neighbors of a given aggregate (red), and features associated with aggregate shape (green). Feature 16 (black) corresponds to the ratio of two features from different clusters (the distance to nearest neighbor divided by aggregate diameter) and clusters separately from both.
Small Aggregate Size, but Not Neighbor-Related Parameters, Correlates with Aggregate Dispersal.
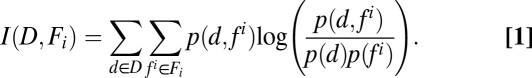
Only about 50% of the aggregates formed by 13.5 h develop into mature fruiting bodies, with the majority of the remaining aggregates simply dispersing into the cell mat. To determine which of the features (or feature classes) have the largest influence on the probability of aggregate dispersal, we computed mutual information (MI), the quantity that measures the mutual dependence between two random variables (14) between aggregate fate (Boolean random variable D with a value d = 1 for dispersed and d = 0 for stable aggregate) and each of the 33 features indentified (random variable Fi) (Eq. 1):
 |
Here,  is the probability distribution of aggregate dispersal and
 is a probability distribution of the given feature (i = 1 … 33), whereas
  is a joint probability distribution between the dispersal and a given feature. When estimating MI, we use normalized histograms to represent the joint and individual probability distribution functions. MI can be represented as (14) (Eq. 2)
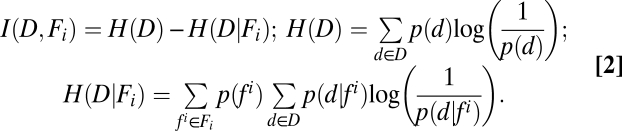 |
H(D) represents uncertainty (entropy) of aggregate fate, whereas 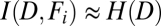 is a conditional uncertainty of the fate given the feature value. If a given feature is a good predictor of the aggregate fate, conditional uncertainty is small, and
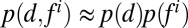 . However, if feature values are independent of fate, then
  and
and  . Therefore, normalized mutual information,
  , can be used to characterize interdependence between each feature and aggregate dispersal, with values near zero indicating low interdependence and values near one indicating high interdependence.
Normalized mutual information for all 33 features unexpectedly revealed that only features associated with aggregate size show high mutual information with dispersal (Fig. 3A). Aggregate area and equivalent diameter show the highest values. Neither proximity to other aggregates nor parameters of their neighbors (such as size) affects aggregate dispersal. Distribution of areas of vanishing or stable aggregates (Fig. 3A Inset) shows a clear separation between the sizes of these aggregates, with an approximate threshold of 6,000 μm2 separating aggregates that are very likely to disperse from those likely to mature into fruiting bodies.
Fig. 3.

Features correlated with aggregate dispersal. (A) Only size-related features are significantly correlated with aggregate dispersal. Inset shows a histogram of aggregate areas at intermediate frame corresponding to 13.5 h for aggregates that remain stable until the end of the movie (green) or disperse (red). The dashed line depicts the threshold area that predicts the aggregate fate. (B) Distance to a neighboring aggregate does not significantly affect aggregate stability. The support vector machine boundary (dashed line) separating stable (green plus signs) or dispersing (red asterisks) aggregates runs nearly parallel to the distance axis. (C) Single size-related features serve as an accurate (∼10% error) predictor of aggregate dispersal. Support vector machine analysis shows that combining additional features does not improve prediction accuracy. Each point corresponds to the error rate obtained from combining n features with the highest mutual information (A).
To determine whether features in addition to size (area) increase our ability to predict aggregate fate, pair-wise combinations of features were considered (e.g., aggregate area and another feature from a different cluster). Fig. 3B shows a representative scattered plot using a combination of aggregate area with nearest neighbor distance (NND). These data were used to train a support vector machine (Methods) (15) to determine linear boundaries separating stable and vanishing aggregates in this plane. The resulting line runs nearly parallel to the y axis, indicating that NND has little effect on aggregate dispersal. The data were separated into two unequal parts; 75% of the data was used to train support vector machine (SVM), and the remaining 25% was used to estimate the error rate of such predictions. The error rate is defined as the percentage of cases (both false positive and false negative) for which dispersal is not correctly predicted by a threshold model. The error rate for a 2D SVM model (Fig. 3B) is 10.8 ± 6.16% and is not significantly different from that predicted by the area alone (11.7 ± 4.95%). Similar results are obtained when other neighbor-related, proximity-related, or shape-related features are combined with aggregate area.
To examine combinations of more than two features, the features are placed in order of decreasing mutual information with dispersal (data in Fig. 3A) and then combined (top n features for n = 1 … 33). For each combination, SVM is used to predict the hyperplane boundary between stable and dispersing aggregates, and the error rate for each predicted boundary is computed. The results indicate that combining two or more features does not increase prediction accuracy. We, therefore, conclude that aggregate size is the only feature significantly affecting its dispersal.
Close Proximity Is Necessary but Not Sufficient for Aggregate Merging.
To determine which features enhance the ability of an aggregate to merge with its neighbor, expressions similar to those in Eqs. 1 and 2 were used to compute the normalized MI between aggregates merging and the list of 33 features (Fig. 4A). Only proximity-related features such as distance to the nearest neighbor have significant codependence with merging. Other factors, such aggregate size or nearest neighbor size, show little predictive power. Fig. 4A Inset shows a normalized distribution of nearest neighbor distances for aggregates that merge and those that do not. The results indicate that merging can only happen if aggregate separation (measured at 13.5 h development) is smaller than a certain threshold (∼150 μm). However, only 28% of aggregates with centers spaced closer than this threshold will merge, and the remaining 72% will remain separate. Thus, nearest neighbor proximity is required for merging but is not sufficient. Further analysis (Fig. S1) indicates that merging aggregates show no statistically significant motility to their partners compared with the motility exhibited by nonmerging aggregates.
Fig. 4.

Features affecting aggregate merging and splitting. (A) Distance-related features have the highest mutual information regarding whether an aggregate merges with another. Inset shows a histogram of nearest neighbor distance at 13.5 h for aggregates that merge (purple) or do not merge (green) by the end of the movie. Close proximity to another aggregate is necessary but not sufficient for merging. (B) Aggregate splitting is affected by the aggregate shape/eccentricity and size. Most aggregates have a circular base. Oblong aggregates often resolve into smaller ones. Aggregate perimeter (feature 13 clustering with size) also shows high mutual information with splitting and is large for eccentric aggregates. Inset shows a histogram of aggregate eccentricity measured at 13.5 h for aggregates that split (purple) or do not split (green) by the end of the movie. High eccentricity of an aggregate is a good predictor of splitting.
Aggregate Size and Eccentricity Affect Its Ability to Split.
In relatively infrequent instances, a single aggregate at 13.5 h development later splits into two smaller aggregated (Fig. 1D). To determine which features are associated with aggregate splitting, normalized MI (Eqs. 1 and 2) was computed between splitting and aggregate features. As shown in Fig. 4B, both aggregate size (e.g., area) and shape (e.g., eccentricity and ratio of minor to major axis of the corresponding ellipse) show significant codependence with splitting. Fig. 4B Inset shows that splitting occurs only with eccentric aggregates (eccentricity above ∼0.8). Splitting is also correlated with the aggregates’ size—perimeter or area (Fig. 1D). We expect that the combination of eccentricity and aggregate size will be an even better predictor of aggregate splitting; however, because of the rareness of splitting, there is insufficient data to test this hypothesis.
Discussion
Statistical Image Analysis to Discover Aggregation Metrics.
Time-lapse imaging of M. xanthus WT cell aggregation revealed three unusual aggregate fates: dispersal, fusion, and splitting. Quantitative analysis of these data is expected to predict features correlated with each type of fate. Here, we developed a quantitative metric consisting of 33 features that measure various morphological and spatial parameters of the aggregate as well as its neighbors. Some of these features are mathematically interdependent, such as aggregate's area (A; feature 15) and aggregate effective diameter ( ; feature 14). Other features are strongly correlated in a nonlinear fashion [e.g., average area of neighbors (feature 28) and average effective diameter of neighbors (feature 27)]. Hierarchical clustering was then used to separate the features into groups using the final frame of each movie based solely on the spatial distribution of mature fruiting bodies. The clustering resulted in four classes of features: those associated with properties of the aggregate itself (shape and size) and those associated with the aggregate's surroundings (proximity to neighbors and neighbor size-related features).
Next, we examine which of the features measured at the time when aggregates initially formed (13.5 h) would correlate with their eventual fate at the end of fruiting body formation (about 48 h). The results show that each of the three fates is most correlated with features in a different cluster. Size is the primary factor controlling dispersal. Proximity is the primary factor controlling fusion, and shape is the primary factor regulating aggregate splitting. Notably, the final cluster (proximity with neighbors) did not correlate with any fate. This negative result allows us to argue against the use of diffusible molecules to signal between aggregates.
Aggregate Disappearance Is Independent of Long-Distance Signaling.
Despite decades of research, the biophysical mechanisms that mediate M. xanthus developmental aggregation remain obscure. Although the M. xanthus genome contains eight chemosensory gene clusters (16) and one of these mediates chemotaxis to certain lipids (17–20), conclusive proof that cells follow an attractant gradient during aggregation is lacking. Mathematical modeling has been an important tool to identify the minimal sets of interactions that can lead to aggregation in silico (6, 7, 9, 10, 21). However, comparison between modeling and experimental aggregation has been primarily qualitative. Moreover, existing models pay relatively little attention to the 2D distribution of aggregates or the fates of transient aggregates such as splitting, merging, and dispersal. For instance, the traffic jam model of aggregation in which aggregation is driven by cell density-dependent motility inhibition grossly underestimates aggregate disappearance (6, 9).
Three possible scenarios determining whether aggregates mature into a fruiting body or disperse can be envisioned. First, in a chemotactic model for aggregation, cells from smaller aggregates might join larger aggregates because of a stronger attractant gradient. Second, cells could leave and join aggregates in random fashion but stay longer in the larger aggregates (21). As a result, larger aggregates will grow at the expense of their smaller neighbors, analogous to Oswald ripening in solutions (22). Third, insufficient cell influx because of closely spaced aggregation foci competing for a limited number of cells may lead to aggregate destabilization (10). Importantly, all three scenarios relate aggregate dispersal to factors extrinsic to the aggregate itself (i.e., size and proximity of the neighbors). The analysis presented here (Fig. 3) shows that proximity with other aggregates is not the major feature aborting their development, thereby disproving all of the above scenarios. We show that the only intrinsic aggregate property that initiates dispersal is small size.
The reason that development ceases in small aggregates is a matter of speculation. How can the size of the aggregate affect the behavior of its cells? One possibility is that the small aggregates fail to differentiate into the cell types to progress the developmental program farther, namely those able to undergo PCD and sporulation. We note that developing M. xanthus cells produce a third cell type, the peripheral rod, which shows little ability to aggregate (23, 24). Peripheral rods express early but not late developmental genes (4, 23). Cross sections of fruiting bodies show that peripheral rods are found only in the lower layers (25). Perhaps aggregates that abort development contain primarily peripheral rods or vegetative cells that are unable to further differentiate.
Short-range quorum-sensing signals within the aggregate could explain how the transient size of an aggregate behaves independently of neighboring aggregates. Such signaling could be facilitated by direct cell contact or a diffusing signal that is slow or has a very short half-life. (The diffusion constant can be estimated from an average distance between aggregates ∼150 μm over the time course of aggregate disappearance of roughly 3 h to be less than 2 μm2/s—a value much smaller than that of typical morphogens or chemoattractants.) There are two known candidates for such signals, C-signal and E-signal. C-signal mutants fail to aggregate; whenever aggregates of any size are produced, the aggregates disperse (3). These results suggest that the C-signal is required to stabilize growing aggregates. C-signaling increases throughout development (26, 27). C-signaling is enhanced by end to end contact between cells (28) and is expected to be especially high in larger fruiting bodies. In contrast, E-signal mutants aggregate (but fail to sporulate), suggesting that E-signal functions to destabilize aggregation. E-signal is likely to be a lipid containing the fatty acid iso 15:0 and is likely produced in lipid bodies, the major metabolic product of early development (25). Although the mechanism of E-signaling remains unknown, lipids would not be expected to diffuse very far and could serve as a short-range signal. Lipid body synthesis increases throughout the aggregation period and occurs only within fruiting bodies (25). The stability of aggregates could be determined by the interplay between both signals.
Analysis of merging aggregates provides further evidence against the presence of chemoattractant gradients guiding cells into aggregates. If long-range horizontal gradients of a chemoattractant emanate from a fruiting body, we would expect stronger gradients around larger aggregates, and therefore, the size of the aggregate or size of its nearest neighbor would be a significant factor in merging. This expectation differs from the results in Fig. 4A, where the spacing between aggregates is the only significant factor affecting their merging. Furthermore, the aggregates that merge move to statistically similar extents compared with stable aggregates, thereby showing no detectable bias for persistent motility towards their partners (Fig. S1).
Concluding Remarks.
Self-organization in microbial communities, such as M. xanthus fruiting body development, is a complex emergent behavior resulting from coordinated interactions of thousands of cells controlled on multiple levels. Mechanistic understanding of such coordination is not evident from qualitative observations and needs to be supplemented with quantitative approaches. One approach, in silico modeling of self-organization, has been used extensively to decrypt aggregation mechanisms (6, 7, 9, 10, 21). Here, we develop another quantitative approach, high-throughput statistical analysis of time-lapse images. A quantitative metric of features characterizing each aggregate is used to characterize the late stages of aggregation. The results present strong evidence against the role of long-range chemoattractant gradients or biased cell exchange in the dispersal of transient aggregates. These observations place severe constraints on underlying biophysical mechanisms of aggregation and suggest the presence of short-range signaling within an aggregate.
Despite our focus on M. xanthus developmental aggregation, the statistical image processing framework developed here can be further extended and adapted to study self-organization in other bacteria or unicellular eukaryotes. We argue that this framework is essential to quantitatively compare experimental patterns with their in silico counterparts as well as statistically assess biological hypotheses on self-organization dynamics.
Methods
Cell Growth and Development.
M. xanthus WT strain DK1622 (29) was grown at 32 °C in casitone-yeast extract (CYE) broth (1.0% Bacto Casitone, 0.5% Difco yeast extract, 10 mM 3-[N-morpholino] propanesulfonic acid, pH 7.6, 0.1% MgSO4) with vigorous shaking. To induce development, cells grown to a density of 5 × 10⁸ cells mL−1 in CYE broth were pelleted by centrifugation and resuspended at a density of 5 × 10⁹ cell mL−1 in sterile distilled water; 20-μL spots were plated on tris-phosphate-magnesium (TPM) agar (10 mM Tris·HCl, 8 mM MgSO4, 1 mM K2HPO4-KH2PO4, 1.5% Difco agar, pH 7.6) and allowed to dry. Cell spots were filmed using a Wild Heerbrugg M7 S dissecting microscope at room temperature. Photographs were taken every 5 min as .jpg files with a Spot Insight 2 camera using SPOT software v4.5 (Diagnostic Instruments).
Image Processing and Statistical Analysis.
The time-lapse images were processed in three stages: segmentation, aggregate linkage, and data analysis. The image processing was performed with Matlab using the Image Processing Toolbox (IPT) and in-house functions as briefly described below. More detailed methods are available in SI Text.
The segmentation stage aimed to separate aggregates from one another and from the interaggregate spacing background is based on their grayscale intensities. The processing starts (Fig S2) with illumination correction to make the background intensity even throughout the image. After a crude segmentation, a smooth surface is fitted to the background (30) and then subtracted from the original data to get the illumination-corrected image. Subsequent segmentation was based on consecutive application of an MRF segmentation algorithm and morphological operations. MRF segmentation was solved using an approximate algorithm based on belief propagation as in ref. 13. The initial segmentation by MRF contains multiple aggregates that are very small as well as aggregates that are connected by narrow segments. To solve this problem, we applied IPT functions imopen, with parameters to remove connections less than 11 pixels across, and bwareaopen, with parameters to ignore aggregates and background regions with fewer than a threshold number of pixels (50 and 300 pixels, respectively). As a result, we removed some false detection and false connection. Because these operations may also remove the true targets, we used the resulting segmentation as an initial condition and performed a second-iteration MRF segmentation. In the final adjustment step, bwareaopen functions (with a threshold of 300 pixels for both aggregate and background patches) were used to remove small objects. We have found that such two-step processes work reliably to detect aggregates at the late stages of aggregation. To ensure that segmentation errors do not significantly affect our analysis, a starting frame was chosen so that the variation in the numbers of aggregates was limited frame to frame (the running variance with 15 frames and no more than five aggregates). The chosen time of the starting frame corresponds to ∼13.5 h development and depicts a time at which quasistable aggregates reliably detectable by the proposed algorithm are formed.
The aggregate linkage stage is aimed to track frame by frame aggregate movement, shrinkage, and expansion. We began with the aggregates detected at the starting frame, and we numbered and traced them until they disappeared or until the end of the movie. Aggregates on two continuous frames are then linked based on displacement of the aggregate center being smaller than 23 μm (10 pixels) and overlap in aggregate pixels being larger than 10%. The process was repeated until the last frame of the movie. This process automatically detects newly emerging aggregates and the aggregates that disperse, merge, or split (Fig. S3).
Data analysis begins with automatic extraction of the features of each aggregate (Table 1 and Fig. S4). The IPT function regionprops computes several aggregate properties. Algebraic manipulations of its outputs lead to all 33 features of each aggregate for each frame. Having features and fate labels for all aggregates, we used information theory and machine learning approaches to connect features and fate (14). Normalized mutual information,  , was used to find single features that are highly interdependent with aggregate fate (Eqs. 1 and 2). SVM analysis (based on Matlab svmtrain and svmclassify commands) was used to test whether multiple feature combinations can better predict the fate of an aggregate (15).
Supplementary Material
Acknowledgments
The authors are grateful to Heidi Kaplan and Roy Welch for useful comments and discussion. This work was supported by National Science Foundation Grants MCB-0742976 (to L.J.S.) and MCB-0845919 (to O.A.I.).
Footnotes
The authors declare no conflict of interest.
*This Direct Submission article had a prearranged editor.
This article contains supporting information online at www.pnas.org/lookup/suppl/doi:10.1073/pnas.1018383108/-/DCSupplemental.
References
- 1.Shimkets LJ, Dworkin M, Reichenbach H. The Myxobacteria. In: Dworkin M, Falkow S, Rosenberg E, Schleifer K-H, Stackebrandt E, editors. The Prokaryotes. A Handbook on the Biology of Bacteria. Vol. 7. New York: Springer; 2007. pp. 31–115. [Google Scholar]
- 2.Bonner PJ, Black WP, Yang Z, Shimkets LJ. FibA and PilA act cooperatively during fruiting body formation of Myxococcus xanthus. Mol Microbiol. 2006;61:1283–1293. doi: 10.1111/j.1365-2958.2006.05298.x. [DOI] [PubMed] [Google Scholar]
- 3.Curtis PD, Taylor RG, Welch RD, Shimkets LJ. Spatial organization of Myxococcus xanthus during fruiting body formation. J Bacteriol. 2007;189:9126–9130. doi: 10.1128/JB.01008-07. [DOI] [PMC free article] [PubMed] [Google Scholar]
- 4.Julien B, Kaiser AD, Garza A. Spatial control of cell differentiation in Myxococcus xanthus. Proc Natl Acad Sci USA. 2000;97:9098–9103. doi: 10.1073/pnas.97.16.9098. [DOI] [PMC free article] [PubMed] [Google Scholar]
- 5.Kaiser D, Welch R. Dynamics of fruiting body morphogenesis. J Bacteriol. 2004;186:919–927. doi: 10.1128/JB.186.4.919-927.2004. [DOI] [PMC free article] [PubMed] [Google Scholar]
- 6.Sliusarenko O, Zusman DR, Oster G. Aggregation during fruiting body formation in Myxococcus xanthus is driven by reducing cell movement. J Bacteriol. 2007;189:611–619. doi: 10.1128/JB.01206-06. [DOI] [PMC free article] [PubMed] [Google Scholar]
- 7.Othmer HG, Stevens A. Aggregation, blowup, and collapse: The ABC's of taxis in reinforced random walks. SIAM J Appl Math. 1997;57:1044–1081. [Google Scholar]
- 8.Igoshin OA, Goldbeter A, Kaiser D, Oster G. A biochemical oscillator explains several aspects of Myxococcus xanthus behavior during development. Proc Natl Acad Sci USA. 2004;101:15760–15765. doi: 10.1073/pnas.0407111101. [DOI] [PMC free article] [PubMed] [Google Scholar]
- 9.Sozinova O, Jiang Y, Kaiser D, Alber M. A three-dimensional model of myxobacterial aggregation by contact-mediated interactions. Proc Natl Acad Sci USA. 2005;102:11308–11312. doi: 10.1073/pnas.0504259102. [DOI] [PMC free article] [PubMed] [Google Scholar]
- 10.Holmes AB, Kalvala S, Whitworth DE. Spatial simulations of myxobacterial development. PLoS Comput Biol. 2010;6:e1000686. doi: 10.1371/journal.pcbi.1000686. [DOI] [PMC free article] [PubMed] [Google Scholar]
- 11.Wireman JW, Dworkin M. Morphogenesis and developmental interactions in myxobacteria. Science. 1975;189:516–523. doi: 10.1126/science.806967. [DOI] [PubMed] [Google Scholar]
- 12.Nariya H, Inouye M. MazF, an mRNA interferase, mediates programmed cell death during multicellular Myxococcus development. Cell. 2008;132:55–66. doi: 10.1016/j.cell.2007.11.044. [DOI] [PubMed] [Google Scholar]
- 13.Felzenszwalb PF, Huttenlocher DP. Efficient belief propagation for early vision. Int J Comput Vis. 2006;70:41–54. [Google Scholar]
- 14.Cover TM, Thomas JA. Elements of Information Theory. New York: Wiley Interscience; 2006. [Google Scholar]
- 15.Burges CJC. A tutorial on Support Vector Machines for pattern recognition. Data Min Knowl Discov. 1998;2:121–167. [Google Scholar]
- 16.Zusman DR, Scott AE, Yang Z, Kirby JR. Chemosensory pathways, motility and development in Myxococcus xanthus. Nat Rev Microbiol. 2007;5:862–872. doi: 10.1038/nrmicro1770. [DOI] [PubMed] [Google Scholar]
- 17.Kearns DB, Bonner PJ, Smith DR, Shimkets LJ. An extracellular matrix-associated zinc metalloprotease is required for dilauroyl phosphatidylethanolamine chemotactic excitation in Myxococcus xanthus. J Bacteriol. 2002;184:1678–1684. doi: 10.1128/JB.184.6.1678-1684.2002. [DOI] [PMC free article] [PubMed] [Google Scholar]
- 18.Kearns DB, Campbell BD, Shimkets LJ. Myxococcus xanthus fibril appendages are essential for excitation by a phospholipid attractant. Proc Natl Acad Sci USA. 2000;97:11505–11510. doi: 10.1073/pnas.210448597. [DOI] [PMC free article] [PubMed] [Google Scholar]
- 19.Kearns DB, Shimkets LJ. Chemotaxis in a gliding bacterium. Proc Natl Acad Sci USA. 1998;95:11957–11962. doi: 10.1073/pnas.95.20.11957. [DOI] [PMC free article] [PubMed] [Google Scholar]
- 20.Kearns DB, et al. Identification of a developmental chemoattractant in Myxococcus xanthus through metabolic engineering. Proc Natl Acad Sci USA. 2001;98:13990–13994. doi: 10.1073/pnas.251484598. [DOI] [PMC free article] [PubMed] [Google Scholar]
- 21.Igoshin OA, Welch R, Kaiser D, Oster G. Waves and aggregation patterns in myxobacteria. Proc Natl Acad Sci USA. 2004;101:4256–4261. doi: 10.1073/pnas.0400704101. [DOI] [PMC free article] [PubMed] [Google Scholar]
- 22.Hubbard AT. Encyclopedia of Surface and Colloid Science. New York: Marcel Dekker; 2002. [Google Scholar]
- 23.O'Connor KA, Zusman DR. Behavior of peripheral rods and their role in the life cycle of Myxococcus xanthus. J Bacteriol. 1991;173:3342–3355. doi: 10.1128/jb.173.11.3342-3355.1991. [DOI] [PMC free article] [PubMed] [Google Scholar]
- 24.O'Connor KA, Zusman DR. Development in Myxococcus xanthus involves differentiation into two cell types, peripheral rods and spores. J Bacteriol. 1991;173:3318–3333. doi: 10.1128/jb.173.11.3318-3333.1991. [DOI] [PMC free article] [PubMed] [Google Scholar]
- 25.Hoiczyk E, et al. Lipid body formation plays a central role in cell fate determination during developmental differentiation of Myxococcus xanthus. Mol Microbiol. 2009;74:497–517. doi: 10.1111/j.1365-2958.2009.06879.x. [DOI] [PMC free article] [PubMed] [Google Scholar]
- 26.Li S, Lee BU, Shimkets LJ. csgA expression entrains Myxococcus xanthus development. Genes Dev. 1992;6:401–410. doi: 10.1101/gad.6.3.401. [DOI] [PubMed] [Google Scholar]
- 27.Kruse T, Lobedanz S, Berthelsen NM, Søgaard-Andersen L. C-signal: A cell surface-associated morphogen that induces and co-ordinates multicellular fruiting body morphogenesis and sporulation in Myxococcus xanthus. Mol Microbiol. 2001;40:156–168. doi: 10.1046/j.1365-2958.2001.02365.x. [DOI] [PubMed] [Google Scholar]
- 28.Kim SK, Kaiser D. Cell alignment required in differentiation of Myxococcus xanthus. Science. 1990;249:926–928. doi: 10.1126/science.2118274. [DOI] [PubMed] [Google Scholar]
- 29.Kaiser D. Social gliding is correlated with the presence of pili in Myxococcus xanthus. Proc Natl Acad Sci USA. 1979;76:5952–5956. doi: 10.1073/pnas.76.11.5952. [DOI] [PMC free article] [PubMed] [Google Scholar]
- 30.D'Errico J. Surface Fitting using gridfit. 2005. available at Matlab Central, http://www.mathworks.com/matlabcentral/fileexchange/8998.
Associated Data
This section collects any data citations, data availability statements, or supplementary materials included in this article.