Abstract
A multi-parametric model predictive control (mpMPC) algorithm for subcutaneous insulin delivery for individuals with type 1 diabetes mellitus (T1DM) that is computationally efficient, robust to variations in insulin sensitivity, and involves minimal burden for the user is proposed. System identification was achieved through impulse response tests feasible for ambulatory conditions on the UVa/Padova simulator adult subjects with T1DM. An alternative means of system identification using readily available clinical parameters was also investigated. A safety constraint was included explicitly in the algorithm formulation using clinical parameters typical of those available to an attending physician. Closed-loop simulations were carried out with daily consumption of 200 g carbohydrate. Controller robustness was assessed by subject/model mismatch scenarios addressing daily, simultaneous variation in insulin sensitivity and meal size with the addition of Gaussian white noise with a standard deviation of 10%. A second-order-plus-time-delay transfer function model fit the validation data with a mean (coefficient of variation) root-mean-square-error (RMSE) of 26 mg/dL (19%) for a 3 h prediction horizon. The resulting control law maintained a low risk Low Blood Glucose Index without any information about carbohydrate consumption for 90% of the subjects. Low-order linear models with clinically meaningful parameters thus provided sufficient information for a model predictive control algorithm to control glycemia. The use of clinical knowledge as a safety constraint can reduce hypoglycemic events, and this same knowledge can further improve glycemic control when used explicitly as the controller model. The resulting mpMPC algorithm was sufficiently compact to be implemented on a simple electronic device.
Keywords: Biomedical control, Insulin delivery, Multi-parametric model predictive control, Type 1 diabetes mellitus
1. Introduction
People with type 1 diabetes mellitus (T1DM) may have a life expectancy ten years less than their normal glucose tolerant counterparts due to complications resulting from chronic hyperglycemia, such as cardiovascular disease and strokes [1]. Hyperglycemia is an elevated blood glucose (BG) concentration, with a threshold defined as BG greater than 180 mg/dL [2]. Aggressive treatment with intensive insulin therapy (IIT), involving up to a total of 12 manual capillary glucose measurements and insulin injections per day, reduces hyperglycemia and can lead to a reduction in the prevalence of these complications [2]. IIT also increases the risk of hypoglycemic events and increases the burden on the caregiver and/or patient administering the therapy [3]. Hypoglycemia is any lower than normal BG; symptoms of hypoglycemia, such as tachycardia and nausea, occur at around 50–70 mg/dL [4,5].
The attraction of an efficient closed-loop device is thus threefold: increased life expectancy, decreased hypoglycemia, and reduction in the burden of administering effective therapy. Innovations in real-time continuous glucose monitoring (CGM) sensors and continuous subcutaneous insulin infusion (CSII) pumps mean that the components necessary for a closed-loop device suitable for use in ambulatory conditions are maturing [6], leaving the control algorithm as the limiting factor in development.
CGM sensors and CSII pumps use the subcutaneous (SC) route for glucose measurement and insulin delivery, respectively. Other routes, such as intravenous and intraperitoneal [7,8], offer reductions in lag time [9], but are associated with an increase in the risk of infection at the site of insertion [10,7]. The lag time associated with SC insulin infusion is an obstacle for a control algorithm: absorption of glucose into the blood from carbohydrate (CHO) raises BG faster than simultaneously injected SC insulin can lower it. Insulin delivery rates may also be limited by the physical limitations of the CSII pump and safety constraints driven by clinical parameters [11]. A controller framework known to be suitable for systems with large lag times and constraints is model predictive control (MPC); this control algorithm has been proposed as a candidate controller architecture for insulin delivery [12–14] and has been implemented in manual closed-loop trials overnight [15]. Central to each of these MPC implementations has been a dynamic model of the effects of subcutaneous insulin on glycemia.
The metabolic processes underlying insulin action involve complex interactions of hormones [16], which lead to significant variation in insulin sensitivity [17–20]. Insulin absorption variability is less than insulin action variability [21], but can be affected by biofilms and inflammation. Gut glucose absorption is highly dependent upon the composition of a meal [22]. Tracer studies involving radioactive isotopes have been reported in order to characterize subcutaneous insulin and gut glucose absorption [22–24]; such models may be representative of the variation inherent in a population, but are not practical for use in an MPC algorithm because adapting these models to an individual subject would require the repetition of an expensive experiment. The use of data driven, empirical models based only on data collected from ambulatory subjects is a more practical method for development of a personalized model; auto-regressive exogenous input models have been presented in literature [25,26]. The main caveat of developing models from data obtained from ambulatory subjects is that typically both model inputs—SC insulin and oral CHO—occur simultaneously, which gives an identifiability problem; the “best” empirical models can therefore have physically counterintuitive characteristics, such as an incorrect sign for a process gain [27]. Classic process control techniques, such as impulse response tests, have been executed in clinical trials in which insulin boluses and meals were separated by 3 h, and support the notion that a simple model—with a gain, a time constant, and a time delay—can capture the critical bandwidth behavior of glucose–insulin interactions [28].
Physicians are calculating “gains” through interactions with their patients with T1DM, and these clinical parameters are the standard of care in endocrinology practices. The “correction factor” (CF) is the lowering effect of BG from administering one unit of rapid-acting insulin; the “insulin-to-carbohydrate ratio” (ICR) is the amount of carbohydrate offset by one unit of rapid-acting insulin. These parameters are used to guide insulin dosing decisions and are often refined throughout the life of the person with T1DM [29]. Due to this refinement process, the parameters obtained are considered reliable and should be included as a safety constraint in a closed-loop control algorithm [11].
Constrained MPC can necessitate the on-line solution of a quadratic program. This on-line optimization can be replaced with a single set of a priori optimizations via multi-parametric programming; the on-line problem is reduced to the evaluation of an affine function obtained from a lookup table [30]. This reformulation is valuable in any application where on-line computation should be minimized, due to low computational power, or in order to extend battery life by minimizing computation, or to minimize the foot-print on a chip. Multi-parametric MPC (mpMPC) has been evaluated in several biomedical applications [31], and has been investigated for use with intravenous insulin delivery in an intensive care unit in silico [32].
This study was designed to show the feasibility of using simple models, clinical parameters, and mpMPC for control of glycemia via the SC route. Elements of modeling for control were, for the first time, unified with clinical parameters derived by physicians. The resulting models and safety constraints were used to develop a novel mpMPC control algorithm for glucose control via subcutaneous insulin delivery. Closed-loop simulations were performed on two clinically verified virtual subject cohorts.
2. Methods
2.1. Virtual subject cohorts
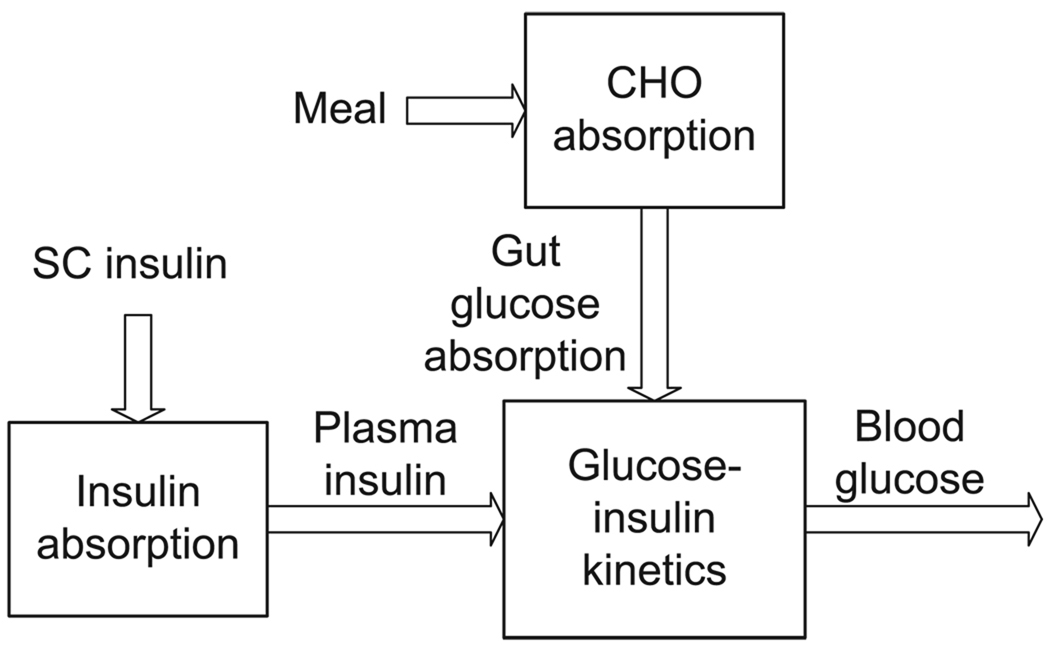
Two clinically validated simulation models were used to represent a virtual subject with T1DM. Both models are semi-physiological, semi-empirical, and represent the effects of SC insulin and oral CHO on BG. The models are divided into three compartments as shown in Fig. 1: gut absorption of glucose from oral CHO, absorption of SC insulin into the plasma, and their effects via a glucose-insulin kinetic model on BG.
Fig. 1.
General compartmental division of virtual subject models used by Hovorka and coworkers [23] and the UVA/Padova simulator [33].
The first cohort of virtual subjects was based on the model of Hovorka et al. [23], with modifications to the insulin absorption model by Wilinska et al. [24]; four subjects were derived by using a multiplier κj on the plasma insulin concentration I(t) in the insulin sensitivity state equations of the model [23]:
| (1) |
where subscripts i and j represent state i and subject j, respectively, x is the insulin sensitivity state, ka and kb are rate constants, and κj takes values of 0.5, 0.75, 0.25, and 1. This cohort will be referred to as the Hovorka cohort.
The second cohort of virtual subjects was based on the cumulative work of scholars at the Universities of Virginia and Padova [34–36], which has been accepted by the Food and Drug Administration (FDA) as a substitute for animal trials [33]. Ten virtual subjects representative of the variation found in an adult population with T1DM were available. This cohort will be referred to as the UVa/Padova cohort.
2.2. Model development
Identification of parameters for first-order-plus-time-delay-with-integrator transfer function models for describing the effects of SC insulin and oral CHO on BG from impulse response tests has been proposed [28,37]. Impulse response data for 1, 2, 5, and 10 U insulin boluses and 25, 50, 75, and 100 g CHO meals were obtained from each virtual subject; the data used for parameter estimation spanned 6 h for the bolus insulin model and 3 h for the meal model. Six models were developed. The general form of models A–C was
| (2) |
where s is the Laplace variable, Y the deviation BG, U the deviation insulin input amount, D the CHO input amount, K, τ, and θ are the model gain, time constant, and time delay, respectively. Subscripts B and M represent the bolus insulin component of the model (bolus model) and meal CHO component of the model (meal model), respectively. The integrator element is included because over the timeframe of interest, the simulated subject has integrating characteristics; in vivo, integrator characteristics are more prominent in the impulse response [38]. Deviation variables are taken about nominal steady-state conditions corresponding to the lowest risk [39]; the nominal BG was 110 mg/dL, the nominal insulin delivery rate was that required to maintain the nominal BG, the nominal disturbance value was zero. For model A, the heuristics used to estimate each parameter were as follows:
K was the ratio of greatest deviation from nominal of Y to the input size U;
θ was defined as y(t = θ) = 0.03Ku, where u is the units of insulin input for the bolus insulin model, or the g CHO for the meal CHO model, and y is the glucose deviation from nominal in mg/dL. The threshold of 3% of final response for θ was chosen as it is just beyond the noise level in CGMs [40];
τ was defined as y(t = τ + θ) = 0.632Ku [41].
For model B, mean values were taken for τ and θ across all subjects in that particular cohort. Recognizing the units of KB as mg/dL per U, KM as mg/dL per g CHO, CF as mg/dL per U, and ICR as g CHO per U, the following relationships between clinical parameters and model gains were defined:
| (3) |
| (4) |
For model C, the gains were thus determined from the clinical parameters, CF and ICR, that are available with each virtual subject.
Due to the integrating element, models A–C have a pole at zero, yielding an unstable model. For stability, a set of second-order models that approximate the critical bandwidth behavior of models A–C were derived; the criteria for the second-order models were defined as
| (5) |
| (6) |
where y† is the second-order model output, t† is the time at which the output of each of the first-order integrating models A–C would be equal to its proposed second-order partner (models D–F). The threshold of 90% of final output was chosen so that the bulk of the steady-state response was duplicated within the timescale of interest; other thresholds could be chosen but were not investigated in this proof-of-concept study. To meet the criteria defined in Eqs. (5) and (6), a nonlinear optimization was performed to obtain a transformed model gain and an additional time constant, denoted with subscript t in the following equations:
| (7) |
Models A–F are compared in Table 1.
Table 1.
A comparison of features of models A–F.
| Model | Integrating | Second order |
|---|---|---|
| Personalized | A | D |
| Mean dynamics | B | E |
| Clinical parameters | C | F |
The models were then discretized and converted into the state space:
| (8) |
| (9) |
where k is the sample index, calculated from t = kΔt where Δt is the sampling period, and θu and θd correspond to θB and θM, respectively, after rounding to the nearest sample index. x is the state vector of dimension n-by-1, y the measurement scalar, u the manipulated variable, insulin, and d the disturbance variable, CHO.
2.3. Controller formulation
The optimization objective was to minimize tracking error Y over prediction horizon NP, spanning 6 h and minimize control moves ΔU over control horizon NM, spanning 30 min. The cost function for this purpose was
| (10) |
where ΔU is an NM-by-1 vector of decision variables Δuj, Y is a NP-by-1 vector of predicted tracking error, and Qy and R and matrices denoting penalties on tracking error and control moves, respectively. Assuming a set-point of 110 mg/dL, which corresponds to the nominal BG, the tracking error, Y, is given by
| (11) |
where matrices T, SU, and SD are calculated from matrices A, B, and Bd. SE is a NP-by-1 unit vector. U is of dimension NP, and is the absolute value of the control variable in the future:
| (12) |
D is an (NA+1)-by-1 vector of disturbances from the present up to NA steps in the future, where NA is the announcement horizon. Three disturbance modeling scenarios were considered.
Unannounced meal. No estimation of the meal size was made. The disturbance model was not used. This is pure feedback (FB) control.
Measured meal. The meal CHO content was measured at the time of ingestion. In this case, NA = 0. This is feedback/feedforward (FF/FB) control.
Announced meal. The meal CHO content was measured 30 min before ingestion. In this case, NA = 6 with a five minute sample time. This is also FB/FF control, with an augmentation of the FF component to look further into the future.
As can be seen from the definition of D, “measured” and “announced” meals are fundamentally the same, with “measured” meals being an “announced” meal with zero lead time.
The error model was an output additive disturbance, defined as
| (13) |
where ym,k is the measurement at the current sample k, and yk is the uncorrected, infinite step ahead model prediction.
Two constraint cases were considered.
Physical constraints only.
Physical constraints and insulin-on-board (IOB) safety constraints [11].
2.3.1. Physical constraints
Basic physical constraints were based determined from bounds on insulin delivery rates
| (14) |
where ID is the absolute insulin delivery rate, subscript basal is the nominal value, and subscript max is the maximum insulin flow rate possible.
2.3.2. IOB constraints
Calculation of the IOB constraint [11] begins by considering the history of delivered insulin and calculating the remaining active insulin
| (15) |
where IOBk is the active insulin at sample k, NH is the oldest delivery of insulin considered, and vector fh is the fraction of insulin remaining active after h samples [42]. The IOB rate constraint was calculated using an allowance for clinical parameters, less the active IOB, given by
| (16) |
where UIOB,k is the maximum insulin delivery rate at sample k, ICF,k is the insulin allowed based on CF, and IICR,k is the insulin allowed based on ICR. An allowance for insulin based on ICR was not given if the meal was unannounced.
Additionally, the nominal insulin infusion rate was always allowed:
| (17) |
The final IOB rate constraint was therefore
| (18) |
2.4. Formulation of the multi-parametric program
The cost function in Eq. (10) can be reformulated by completing the square [30,43] into a more compact form suitable for solution as a multi-parametric program giving
| (19) |
| (20) |
where the vector of optimization variables, zk, is a function of the parameter vector, pk, and the manipulated variable vector ΔUk, defined as
| (21) |
and S is obtained from
| (22) |
The vector pk is called the parameter vector because in the context of parametric programming, this is traditionally the name given to the set of variables (or parameters) over whose range optimal solutions are sought.
The multi-parametric programming problem as defined by Eqs. (19) and (20) was solved using the Multi-Parametric Toolbox [44] and YALMIP [45]. The parameter vector, pk included the state vector, xk, the last control move, uk, the current error, ek, the meal measurement and announcement vector, dk, and the IOB constraint, uIOB,k. The maxima and minima of each component of interest in pk were:
| (23) |
| (24) |
| (25) |
| (26) |
| (27) |
The solution is the form of lookup table defined in the state space; the optimal control law was determined by searching the lookup table for the entry j satisfying the associated vector of inequalities
| (28) |
where Hj and Kj define the limits of the validity of optimality of entry j. The associated affine function is evaluated using
| (29) |
where Fj and Gj correspond to entry j in the lookup table for optimal control given parameter vector pk.
3. Results and discussion
3.1. Model development
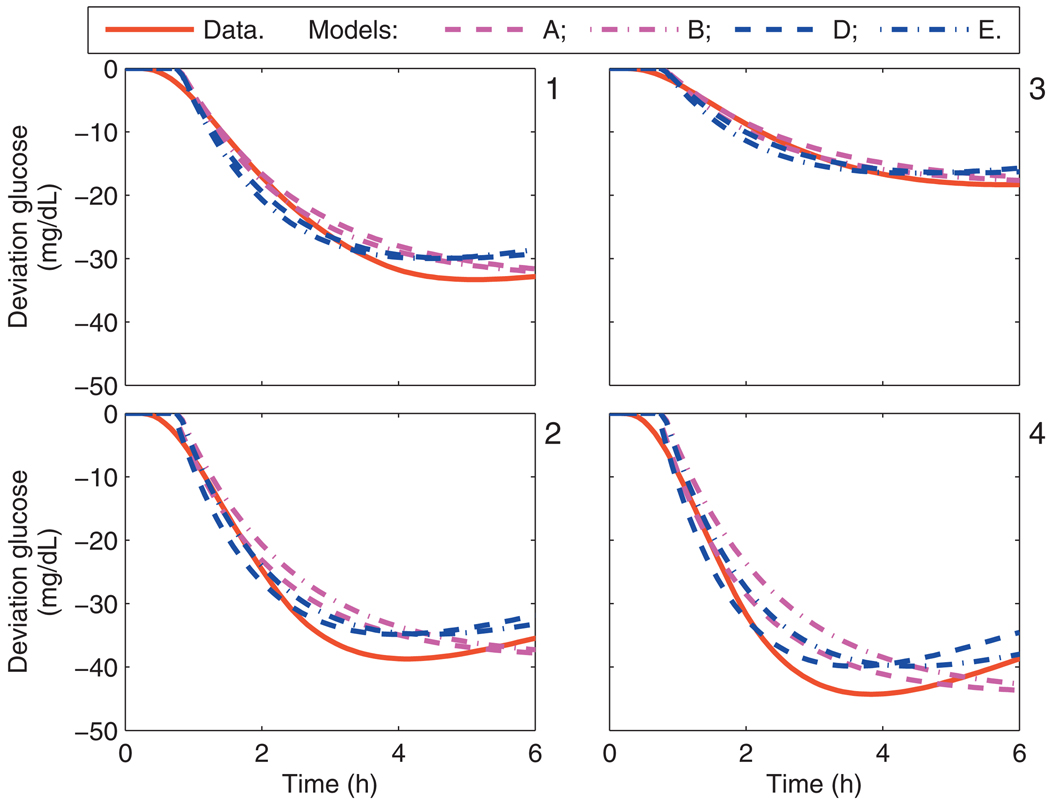
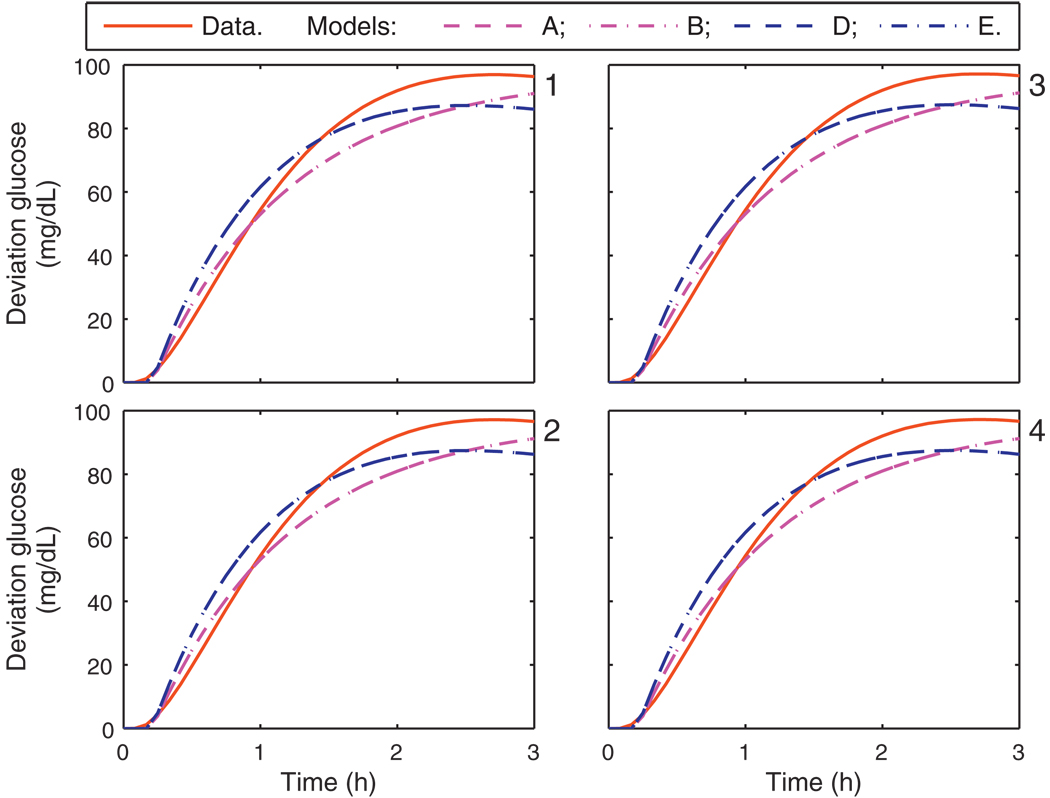
Comparison of each of the models A–F with the subject data was performed. For the Hovorka cohort, the critical bandwidth frequencies were captured in each of the personalized models, i.e., models A, B, D, and E. The calibration data from the Hovorka cohort and each model’s response to a 1 U insulin bolus is shown in Fig. 2; models C and F, which have gains based upon clinical parameters, do not capture the asymptotic behavior as well as models A, B, D, and E. The model response to a meal is similar for all Hovorka subjects, as shown in Fig. 3.
Fig. 2.
Calibration data and the uncorrected model response from models A, B, D, and E, due to a 1 U bolus. Panels 1–4 correspond to the Hovorka subjects 1–4.
Fig. 3.
Calibration data and the uncorrected model response from models A, B, D, and E, due to a 25 g CHO meal. Panels 1–4 correspond to the Hovorka subjects 1–4.
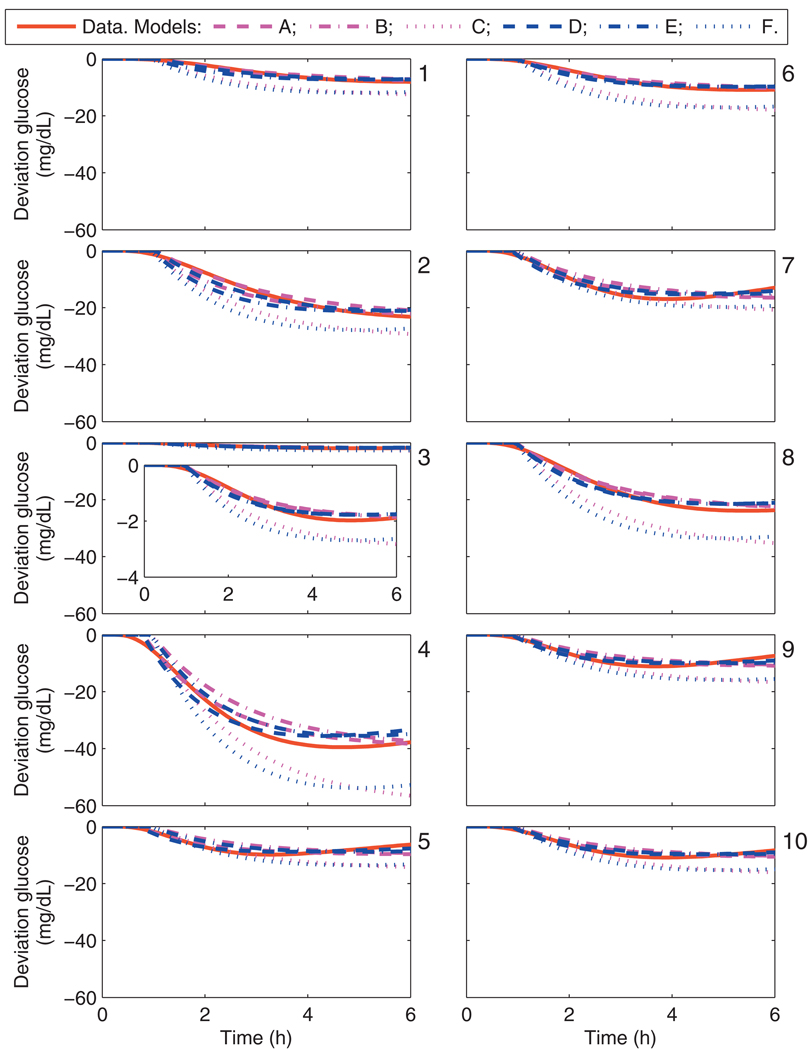
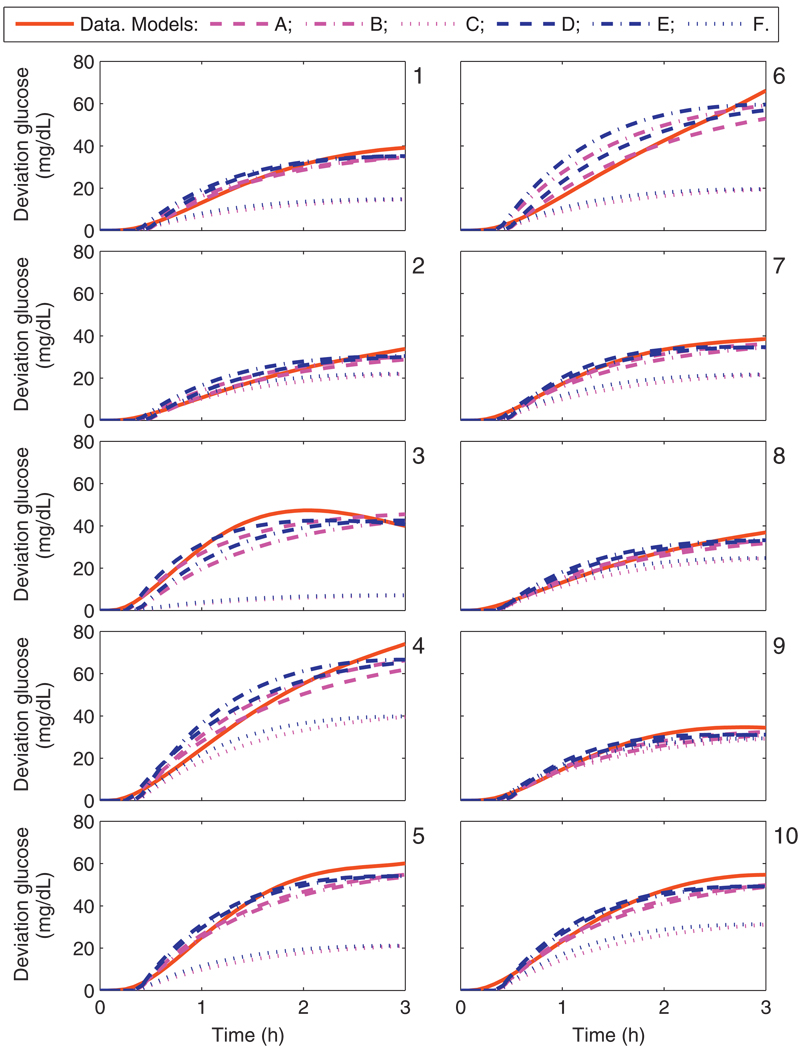
The calibration data from UVa/Padova cohort and each model’s response to a 1 U bolus is shown in Fig. 4; from an asymptotic perspective over the window of interest, models C and F do not capture the hypothesized gains. The data and model fits from a 25 g CHO meal for the UVa/Padova cohort are shown in Fig. 5. The lag time for each model is similar to the lag time of the data in all cases.
Fig. 4.
Calibration data and the uncorrected model response from models A–F due to a 1 U bolus. Panels 1–10 correspond to the UVa/Padova adult subjects 1–10.
Fig. 5.
Calibration data and the uncorrected model response from models A–F due to a 25 g CHO meal. Panels 1–10 correspond to the UVa/Padova adult subjects 1–10.
The model parameters identified for model 1 are summarized in Table 2 for the Hovorka cohort and Table 3 for the UVa/Padova cohort. Comparison of the bolus model gains, KB across cohorts shows that the Hovorka cohort are much more sensitive to insulin than the UVa/Padova cohort. There is an order of magnitude difference in the CF of UVa/Padova adult subjects 3 and 4 indicating a wide range of insulin sensitivity in the cohort; this difference is maintained in the corresponding gain, KB, of these subjects. The variation of τ and θ is significantly less than the variation of K, indicating that the gains, K, are the most important parameter in accounting for inter-subject variation.
Table 2.
Parameters for models A and D identified from the Hovorka cohort using impulses of 1 U insulin and 25 g CHO.
| Subject | Bolus model |
Meal model |
||||||||
|---|---|---|---|---|---|---|---|---|---|---|
| −KB ([mg/dL]/U) | τB (min) | θB (min) | −KBt ([mg/dL]/[U/min]) | τBt(min) | KM ([mg/dL]/g CHO) | τM (min) | θM (min) | KMt ([mg/dL]/[g CHO/min) | τMt (min) | |
| 1 | 33.3 | 105 | 40 | 31,400 | 766 | 3.88 | 60 | 10 | 2090 | 438 |
| 2 | 38.7 | 85 | 35 | 29,600 | 620 | 3.89 | 60 | 10 | 2100 | 438 |
| 3 | 18.4 | 115 | 40 | 19,000 | 839 | 3.89 | 60 | 10 | 2100 | 438 |
| 4 | 44.3 | 75 | 35 | 29,900 | 547 | 3.89 | 60 | 10 | 2100 | 438 |
| Mean | 33.7 | 95 | 37.5 | 27,500 | 693 | 3.88 | 60 | 10 | 2100 | 438 |
| S.D. | 11.2 | 18.3 | 2.89 | 5740 | 133 | 0.00525 | 0 | 0 | 2.83 | 0 |
Table 3.
Parameters for models A, D, and F identified from the UVa/Padova cohort using impulses of 1 U insulin and 25 g CHO.
| Subject | Bolus model |
Meal model |
Clinical parameters |
||||||||||
|---|---|---|---|---|---|---|---|---|---|---|---|---|---|
| −KB ([mg/dL]/U) |
τB (min) |
θB (min) |
−KBt ([mg/dL]/[U/min]) |
τBt (min) |
KM ([mg/dL]/g CHO) |
τM (min) |
θM (min) |
KMt ([mg/dL]/g CHO/min) |
τMt (min) |
CF ([mg/dL]/U) |
ICR (g CHO/U) |
−KB/KM (g CHO/U) |
|
| 1 | 8.09 | 135 | 60 | 9820 | 984 | 1.57 | 70 | 25 | 986 | 510 | 13.2 | 20.1 | 5.17 |
| 2 | 23.6 | 135 | 55 | 28,600 | 984 | 1.35 | 80 | 25 | 973 | 583 | 31 | 31.5 | 17.4 |
| 3 | 1.98 | 110 | 50 | 1950 | 802 | 1.89 | 50 | 15 | 851 | 365 | 2.99 | 9.32 | 1.04 |
| 4 | 39.5 | 90 | 40 | 32,000 | 656 | 2.96 | 90 | 15 | 2400 | 656 | 59.9 | 33.9 | 13.3 |
| 5 | 9.86 | 75 | 35 | 66,600 | 547 | 2.4 | 65 | 20 | 1410 | 474 | 15.1 | 16 | 4.1 |
| 6 | 10.9 | 120 | 50 | 11,800 | 875 | 2.65 | 95 | 25 | 2260 | 693 | 19 | 21.8 | 4.13 |
| 7 | 17 | 85 | 45 | 13,000 | 620 | 1.54 | 55 | 25 | 763 | 401 | 22 | 22.8 | 11 |
| 8 | 23.9 | 110 | 50 | 23,600 | 802 | 1.48 | 80 | 20 | 1060 | 583 | 37.4 | 33.9 | 16.2 |
| 9 | 11.1 | 80 | 45 | 80,100 | 583 | 1.39 | 55 | 25 | 686 | 401 | 17.6 | 13.5 | 8.03 |
| 10 | 10.9 | 85 | 45 | 83,200 | 620 | 2.19 | 65 | 20 | 1280 | 474 | 17 | 12.2 | 4.97 |
| Mean | 15.7 | 103 | 47.5 | 14,400 | 747 | 1.94 | 70.5 | 21.5 | 1270 | 514 | 23.5 | 21.5 | 8.54 |
| S.D. | 10.8 | 22.5 | 7.17 | 10,100 | 164 | 0.576 | 15.4 | 4.12 | 602 | 112 | 15.9 | 9.06 | 5.64 |
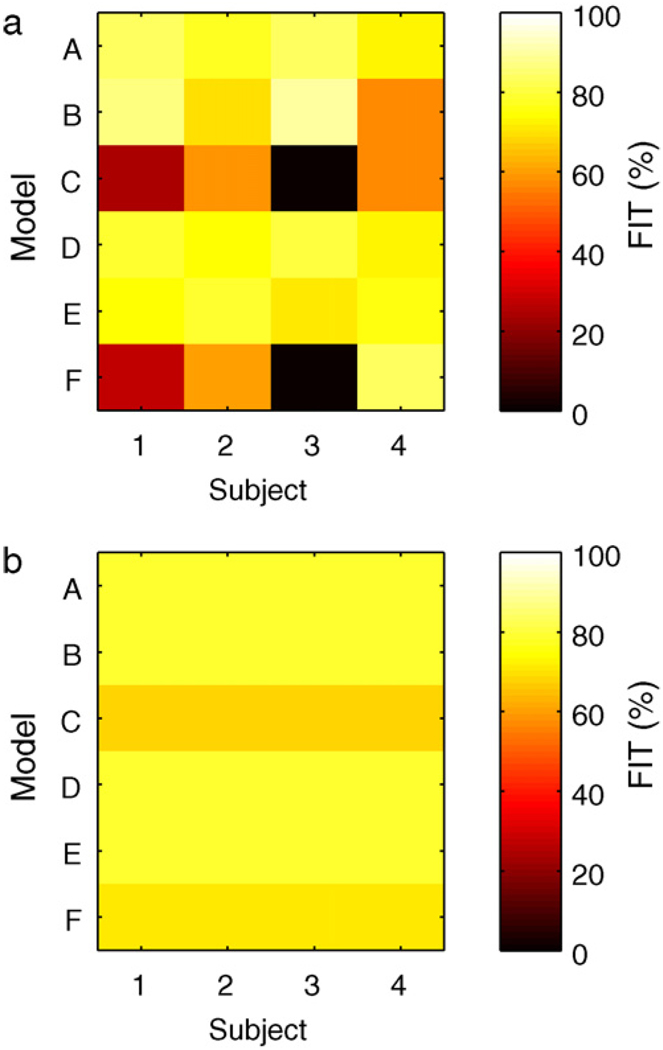
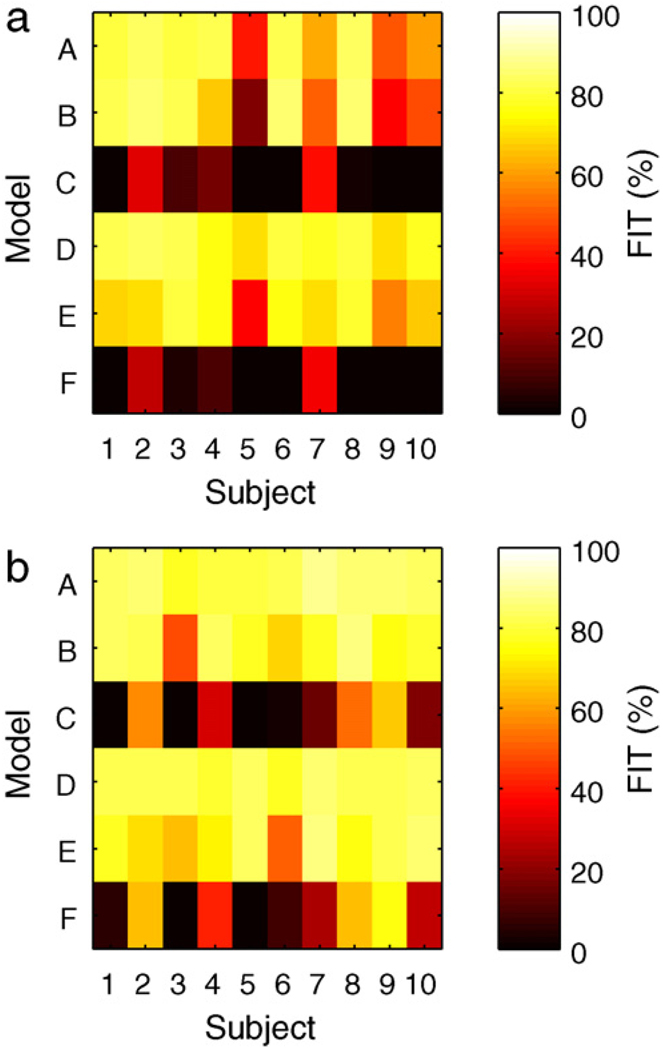
A quantitative analysis of the model calibration is given in Figs. 6 and 7 using the FIT metric, defined as
| (30) |
where g is the measurement value, ĝ the uncorrected model estimate, and ḡ the mean measurement value. A score of 100 implies perfect fit, a score of zero implies predicting the mean measurement value would have equivalent performance. The models with gains based on clinical parameters perform poorly compared with models using gains obtained from impulse response tests.
Fig. 6.
The FIT metric for Hovorka subjects 1–4 for each model identified from the impulse response data. Left: bolus response. Right: meal response.
Fig. 7.
The FIT metric for UVa/Padova adult subjects 1–10 for each model identified from the impulse response data. Left: bolus response. Right: meal response.
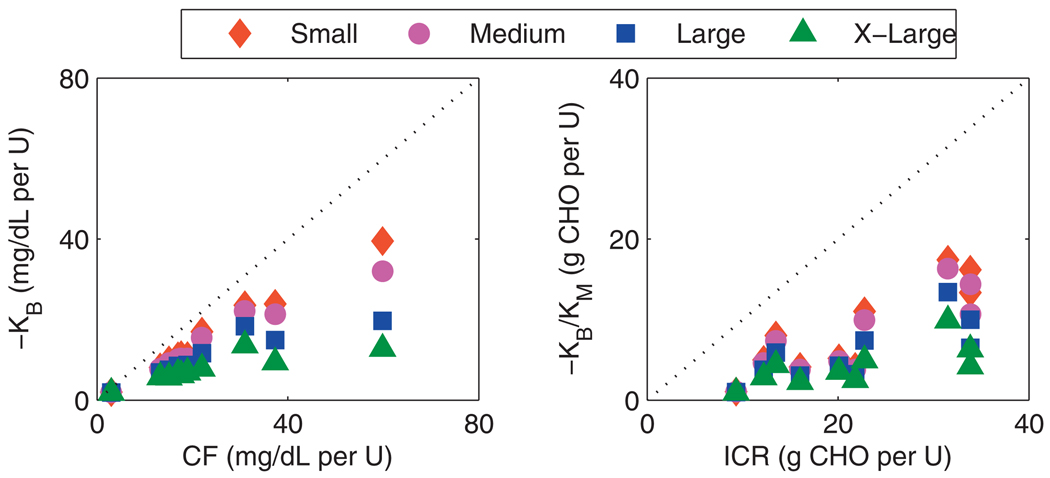
The model gains and clinical parameters are compared in Fig. 8 for the UVa/Padova cohort. An increase in the size of the input excitation decreases the value of the model gain obtained, indicating nonlinearities. The trend is that the model gains have the strongest correlation with the clinical parameters when the input excitation is small. The implication is that the size of the impulse used in identification should be of a similar magnitude to those impulses, i.e., meals, expected in daily life. The clinical parameters assigned to an individual with T1DM are a reflection of this.
Fig. 8.
Clinical parameters from UVa/Padova cohort compared with identified model gains. Series descriptors denote excitation size; small: 1 U, 25 g CHO; medium: 2 U, 50 g CHO; large: 5 U, 75 g CHO; x-large: 10 U, 100 g CHO. Left: correction factor. Right: insulin-to-carbohydrate ratio.
3.2. Controller performance
The control law was formulated using a prediction horizon of 6 h because this length of time was used to model insulin. The sample time was chosen as 5min, which is a common measurement frequency among CGM sensors in use. The control horizon was 30 min. Integrating states can be problematic for mpMPC, unless a larger search region is specified, which increases the size of the lookup table and thus may defeat the goal of minimizing the footprint on a chip. Thus, SOPTD models were preferable to FOPTDI models for control and the FOPTDI models were not used any further. This was reasonable from a modeling perspective because there was not significant loss of model performance when applying the empirical transformation. Additionally, the FOPTDI remain the best starting point because the parameters have clinical/physical meaning. Because the performances of models D and E were clinically similar, results from models D and F are shown in the following results. Extensive simulations showed that Qy/R = 0.1 was a reasonable trade-off between robustness to uncertainty and avoiding a sluggish response. Closed-loop simulations were performed assuming a daily meal plan of 200 g CHO, divided into three meals of 50, 85, 65 g CHO ingested at 7 a.m., noon, and 7p.m.
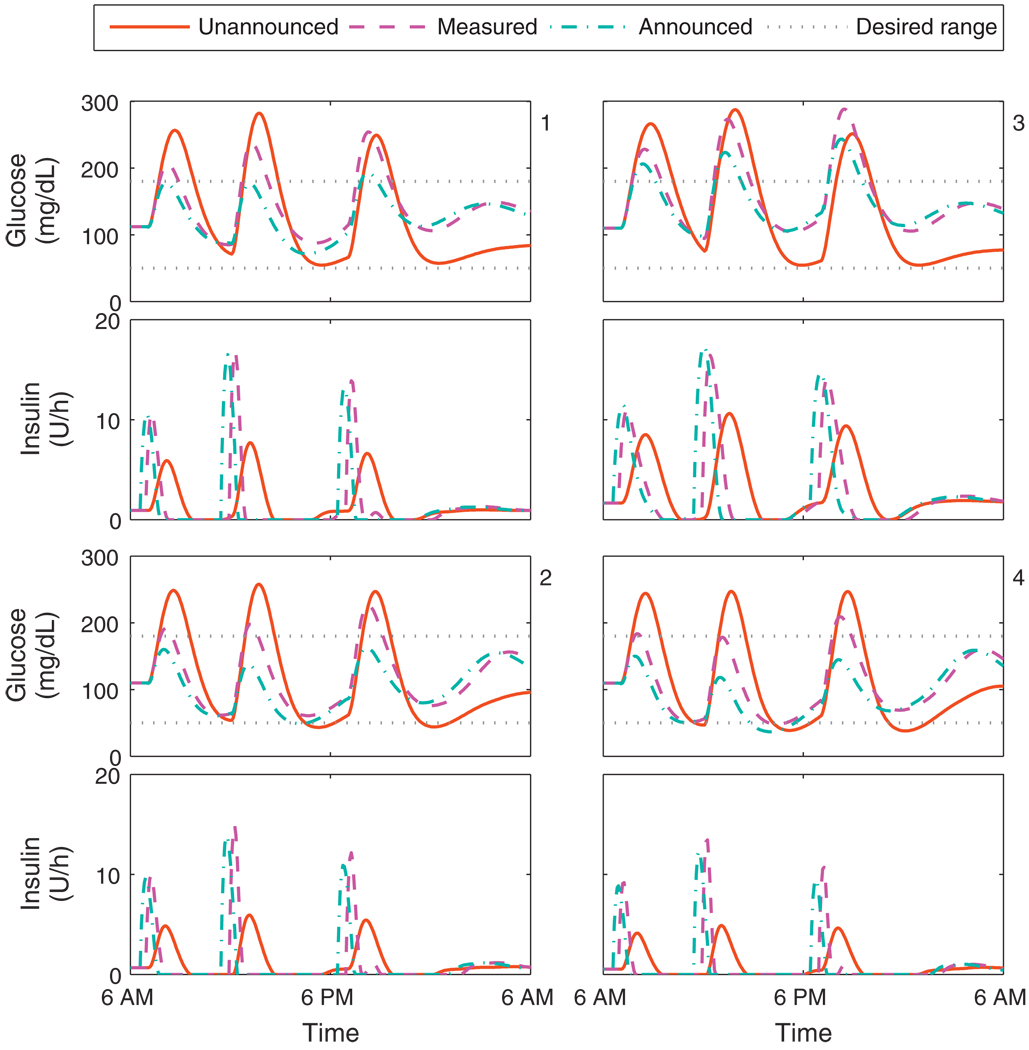
Fig. 9 shows the closed-loop responses for the Hovorka cohort with a controller based on Model D. Performance characteristics associated with the three methods of controlling for disturbances are similar across all subjects. Unannounced meals of this size lead to unacceptable low postprandial BG. The use of a disturbance model reduces the peak BG levels after CHO ingestion, while also generally increasing the BG minima. Meal announcement further reduces the peak BG levels, but at the cost of further decreasing the postprandial BG. The control algorithm delivers some insulin upon announcement of the meal. This delivery of insulin over several steps is a shift from the basal-bolus paradigm, and thus cannot be considered as a pre-meal bolus; indeed, the control algorithm makes no distinction between the two. The model and controller performance on the Hovorka subjects indicates that the system has only mild nonlinearities; as implemented, the variation in BG could be reduced with a modest reduction in daily CHO consumption, and the low postprandial BG could be avoided at the cost of higher peak BG by increasing the set-point. Indeed, dietary restriction and consistency are considered key to control of diabetes mellitus [46]. Meal announcement was not investigated any further due to decrease in BG minima associated with this controller performance and the practical implications of knowing meal CHO before meal time.
Fig. 9.
Closed-loop results for the Hovorka cohort. Meal plan is 50, 85, and 65 g CHO at 7 a.m., noon, and 7 p.m. Control algorithms compared are the unannounced, measured, and announced meal scenarios, using model D. Panels 1–4 correspond to the Hovorka subjects 1–4.
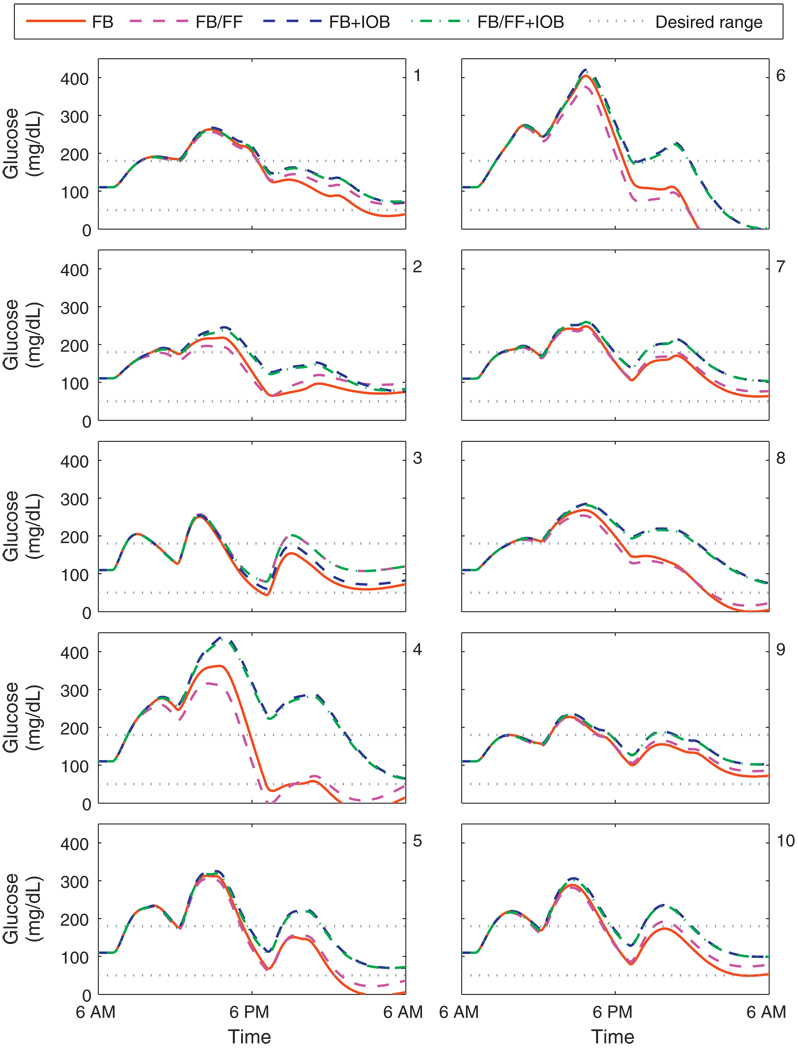
Fig. 10 shows the closed-loop responses for the UVa/Padova cohort with a controller based on Model D. Both unknown meals and measured meals were considered, along with the inclusion of the IOB constraint based on clinical parameters. The performance of an unconstrained controller with unknown meals is satisfactory for subjects 2, 7, and 9. Subjects 1, 3, and 10 require meal measurement to avoid hypoglycemia subjects 4, 5, and 8 require an IOB safety constraint to avoid hypoglycemia. The failure of the safety constraint for subject 6 indicates that the clinical parameters are not appropriately prescribed. This highlights the importance of hypoglycemia alarming and fault detection, which is in itself an active area of research for insulin delivery systems [47–49]. For subject 6, the associated clinical parameters were doubled to improve insulin dosing decisions in the following simulations. In this study, we have not investigated adaptive control; excellent strategies have been developed and could be applied to this control schema. For determining if a model is still valid, fault detection methods could be applied [50] to recommend obtaining a new model. Run-to-run methods [51] could be used to reset the nominal conditions used should insulin requirements change significantly. Iterative learning control [52] and run-to-run control [53] could also be used to determine a dynamic set-point, based on prior performance.
Fig. 10.
Closed-loop results for the UVa/Padova cohort. Meal plan is 50, 85, and 65 g CHO at 7 a.m., noon, and 7 p.m. Control algorithms compared are the unannounced (FB) and measured (FB/FF) meal scenarios, with and without the IOB constraint, using model D. Panels 1–10 correspond to the UVa/Padova adult subjects 1–10.
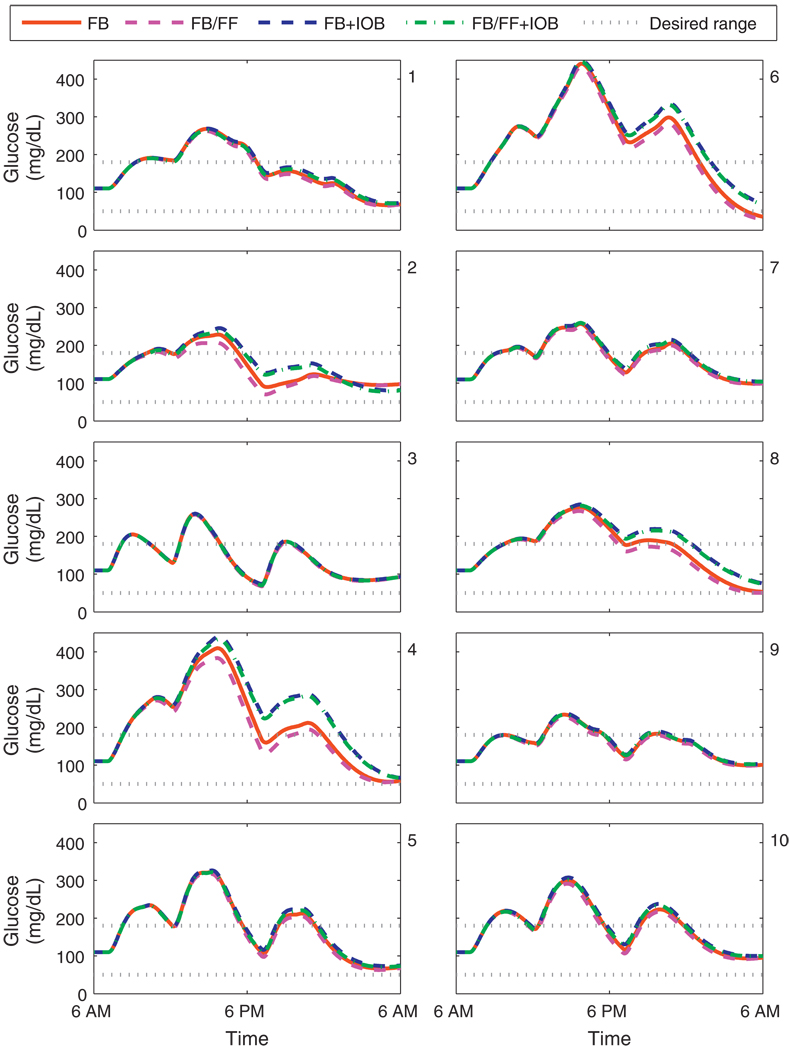
Fig. 11 shows the closed-loop responses for the UVa/Padova cohort with a controller based on Model F. Subjects 4 and 8 need the safety constraint to avoid hypoglycemia. For subjects 1, 3, 5, 7, 9, and 10, glycemic control is clinically identical with or without the safety constraint; the convergence of controller performance in this manner indicates that the model contains the same information used in the safety constraint in an optimal manner. The glucose trajectories for subject 6 show improved performance with modified clinical parameters; hypoglycemia is avoided with the IOB constraint. Although model D provided a better prediction of open-loop data than model F, the controller based upon model F performs better in a closed-loop scenario. This is because performance for open-loop prediction was measured in a least-squares sense, where as performance for closed-loop control is measured in terms of safety. By considering the safety margins implicitly in the model, rather than explicitly in the constraint, improved performance without the IOB constraint occurs.
Fig. 11.
Closed-loop results for the UVa/Padova cohort. Meal plan is 50, 85, and 65 g CHO at 7 a.m., noon, and 7 p.m. Control algorithms compared are the unannounced (FB) and measured (FB/FF) meal scenarios, with and without the IOB constraint, using model F. Panels 1–10 correspond to the UVa/Padova adult subjects 1–10.
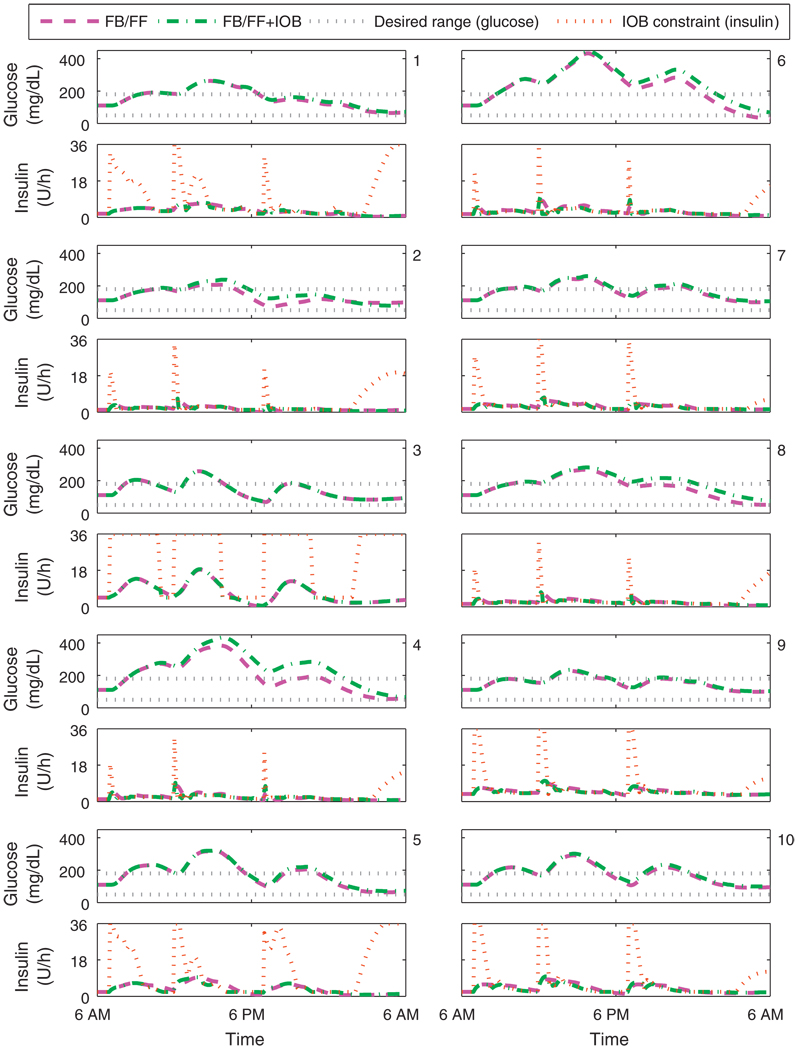
Fig. 12 shows the value of the upper limit on the rate constraint for the UVa/Padova cohort. The rate constraint increases with deviation from nominal and when meals are announced; the rate constraint also increases when insulin delivery is less than basal as active insulin decays. The insulin delivery rate from the controller without the IOB constraint frequently exceeds that of the controller with the IOB constraint.
Fig. 12.
Closed-loop results for the UVa/Padova cohort. Meal plan is 50, 85, and 65 g CHO at 7 a.m., noon, and 7 p.m. The control algorithms both consider measured meals (FB/FF), one has the IOB constraint, using model F. The IOB safety constraint for one controller is shown in the insulin delivery panels. Panels 1–10 correspond to the UVa/Padova adult subjects 1–10.
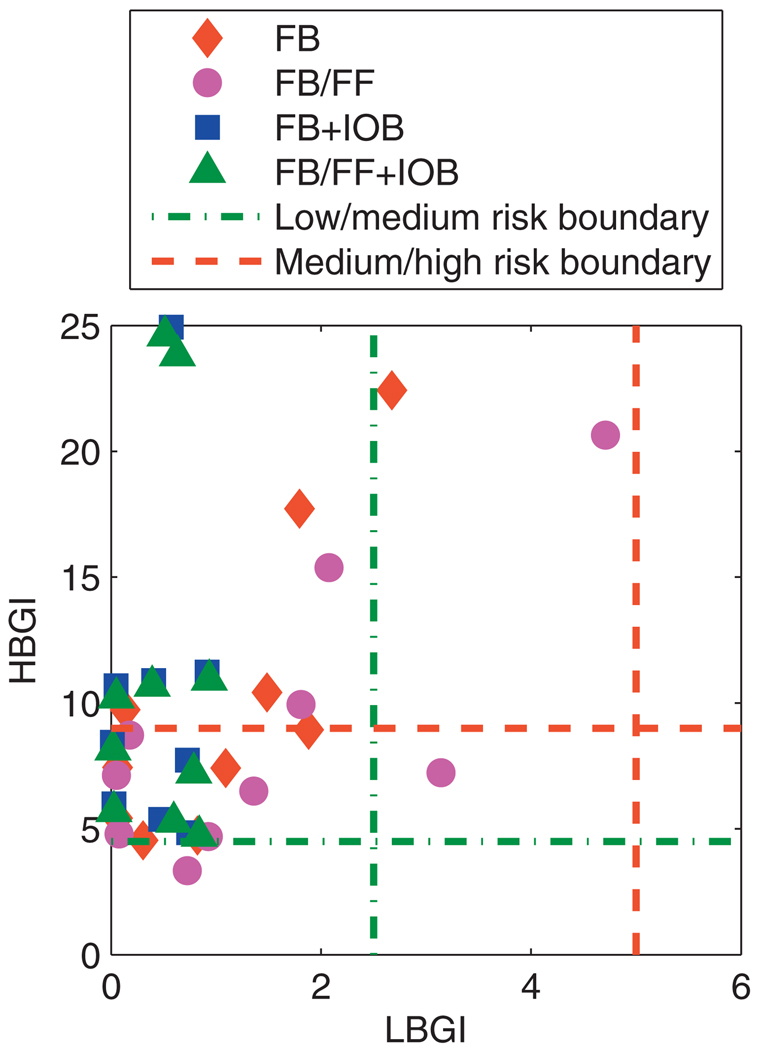
The critical challenge for a control algorithm is robustness under uncertainty. Uncertainty in meal CHO content and subject insulin sensitivity were addressed. Each subject was simulated for 30 days; daily variation of insulin sensitivity was considered by parameter variation drawn from a normal distribution with standard deviation of 10%, and CHO content of each meal was assumed to vary following a normal distribution with standard deviation of 10%; these distributions were chosen to capture the expected variation in insulin sensitivity [54] and meal size estimates [55] observed in the literature. The low blood glucose index (LBGI) and high blood glucose index (HBGI) were calculated to summarize glycemic control for each day [39,56]. Calculation of LBGI and HBGI involves normalization of BG into risk space, to account for the asymmetry of the hazard associated with deviations from nominal. Threshold levels distinguishing low, medium, and high risk of hyperglycemic and hypoglycemic events have been associated with HBGI and LBGI, respectively; these thresholds relate to the risk of deleterious consequences associated with BG that is not at euglycemic levels.
A summary analysis of all BG data for the 30 days of simulations is shown in Fig. 13. In all instances, controller performance avoids a high risk of hypoglycemia; with the IOB constraint formulation, the risk of hypoglycemia was classified as “low” [39].
Fig. 13.
Mean values of the daily LBGI and HBGI obtained over 30 days for the UVa/Padova cohort. Control algorithms compared are the unannounced (FB) and measured (FB/FF) meal scenarios, with and without the IOB constraint, using model F.
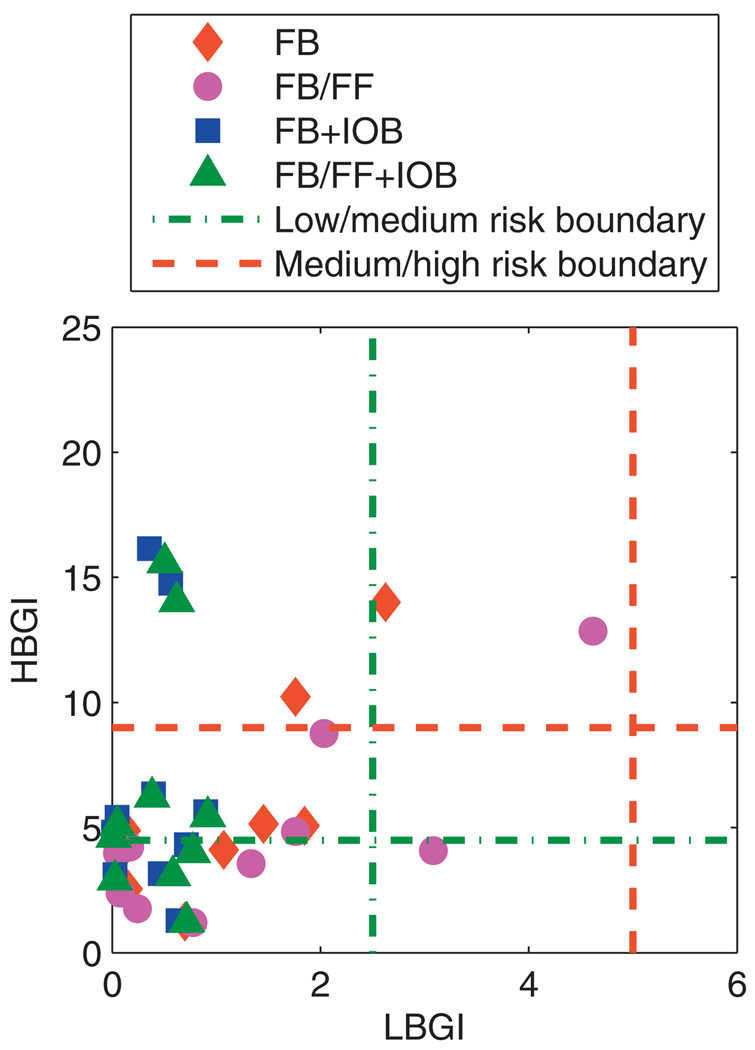
Due to the inevitable hyperglycemia that occurs postprandially with unrestricted CHO consumption, glycemic control was assessed by relaxing requirements on a 3 h postprandial period, which has precedent in the literature [57]. The LBGI and HBGI analysis was repeated for the closed-loop glucose trajectories, excluding the postprandial period, as shown in Fig. 14. There was a significant reduction in HBGI, with most data points falling below the “low” risk threshold, and those points above the “high” risk threshold were significantly reduced.
Fig. 14.
Mean values of the daily LBGI and HBGI obtained over 30 days for the UVa/Padova cohort excluding the postprandial period. Control algorithms compared are the unannounced (FB) and measured (FB/FF) meal scenarios, with and without the IOB constraint, using model F.
The threshold levels for interpreting LBGI and HBGI were developed before CGM sensors became available; the paucity of data available meant that a measurement showing hyperglycemia could reasonably be interpreted as a sustained hyperglycemic event. The glucose trajectories shown in Fig. 11 indicate that the hyperglycemia caused by daily CHO consumption of 200 g CHO is not sustained indefinitely; euglycemia is always restored overnight. Therefore, to interpret the HBGI results as meaning high risk may be overstating the problem.
3.3. Controller implementation
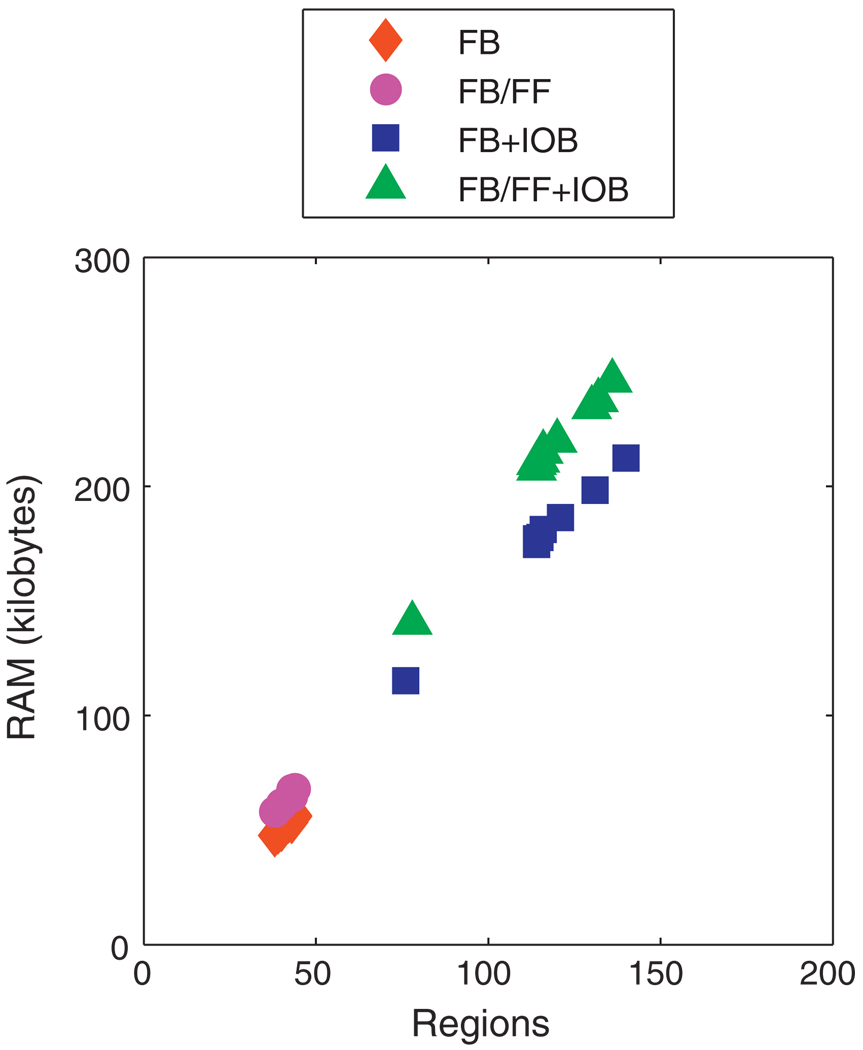
In order to retain the practical benefits of solving a multi-parametric program offline, the lookup table should be of a size that lends itself to portability on simple devices. Fig. 15 shows the size of the controllers for each subject that were implemented in the robustness simulations. All the controllers were of a reasonable size given modern portable computational devices. The size of the lookup table depends upon the complexity of the model, the cost function, and the constraint formulation. The increase in complexity from additional parameters in the program from measured meals leads to a modest increase in size; the increase in complexity due to the IOB constraint is more significant, but does not make the lookup table size a computational burden or memory issue.
Fig. 15.
Size of control law for UVa/Padova cohort based on model F for unannounced (FB) and measured (FB/FF) meals with and without the IOB constraint.
4. Conclusions
Low order transfer function models can have physically meaningful parameters and the necessary degrees of freedom to characterize the principle characteristics of clinically validated models of SC insulin effects on BG. The identification procedure for parameters for such models used only ambulatory data and would be relatively inexpensive to implement. Clinical parameters served a similar function in characterizing the most important information and could be used as the basis of models useful for control derived from a minimum amount of data.
MPC provided an intuitive framework for a complex optimization problem, whereby tuning handles do not become too complicated for a non-specialist to understand. The robustness of the proposed control algorithm was demonstrated through physiologically significant changes in insulin sensitivity and mismatches between subject estimated and ingested CHO. The safety constraints implemented improved performance by reducing the occurrence of hypoglycemia. Using simple models and only the most important constraints led to a sufficiently compactly posed multi-parametric programming problem that was suitable for implementation on a simple computational device—”MPC-on-a-chip”.
Acknowledgments
Financial support from the Juvenile Diabetes Research Foundation (JDRF) grants 22-2009-796, and 22-2009-797, Institute for Collaborative Biotechnologies (ICB) grant DAAD 19-03-D-004 from the US Army Research Office, and National Institutes of Health (NIH) grant R01-DK085628 are gratefully acknowledged. MWP would also like to thank Urban Mäder for his helpful comments. The UVa patent foundation is gratefully acknowledged for the use of the metabolic simulator.
Abbreviations
- BG
blood glucose
- CGM
continuous glucose monitoring
- CF
correction factor
- CHO
carbohydrate
- CSII
continuous subcutaneous insulin infusion
- FDA
Food and Drug Administration
- ICR
insulin-to-carbohydrate ratio
- IIT
intensive insulin therapy
- IV
intravenous
- SC
subcutaneous
- T1DM
type 1 diabetes mellitus
Contributor Information
M.W. Percival, Email: percival@engineering.ucsb.edu.
Y. Wang, Email: kewangyq@engineering.ucsb.edu.
B. Grosman, Email: grosmanb@engineering.ucsb.edu.
E. Dassau, Email: dassau@engineering.ucsb.edu.
H. Zisser, Email: hzisser@sansum.org.
L. Jovanovič, Email: vljovanovic@sansum.org.
F.J. Doyle, III, Email: doyle@engineering.ucsb.edu.
References
- 1.Franco OH, Steyerberg EW, Hu FB, Mackenbach J, Nusselder W. Associations of diabetes mellitus with total life expectancy and life expectancy with and without cardiovascular disease. Arch. Intern. Med. 2007;167(11):1145–1151. doi: 10.1001/archinte.167.11.1145. [DOI] [PubMed] [Google Scholar]
- 2.Diabetes Control and Complications Trials Research Group. The effect of intensive treatment of diabetes on the development and progression of long-term complications in insulin-dependent diabetes mellitus. N. Engl. J. Med. 1993;329:977–986. doi: 10.1056/NEJM199309303291401. [DOI] [PubMed] [Google Scholar]
- 3.Diabetes Control and Complications Trials Research Group. The relationship of glycemic exposure HbA1c to the risk of development and progression of retinopathy in the diabetes control and complications trial. Diabetes. 1995;44(8):968–983. [PubMed] [Google Scholar]
- 4.Amiel SA, Sherwin RS, Simonson DC, Tamborlane WV. Effect of intensive insulin the rapy on glycemic thresholds for counterregulatory hormone release. Diabetes. 1988;37(7):901–907. doi: 10.2337/diab.37.7.901. [DOI] [PubMed] [Google Scholar]
- 5.Cryer PE. Preventing hypoglycaemia: what is the appropriate glucose alert value? Diabetologia. 2009;52(1):35–37. doi: 10.1007/s00125-008-1205-7. [DOI] [PubMed] [Google Scholar]
- 6.Bequette BW. A critical assessment of algorithms and challenges in the development of a closed-loop artificial pancreas. Diabetes Technol. Ther. 2005;7(1):28–47. doi: 10.1089/dia.2005.7.28. [DOI] [PubMed] [Google Scholar]
- 7.Renard E. Insulin delivery route for the artificial pancreas: subcutaneous intraperitoneal, or intravenous? pros and cons. J. Diabetes Sci. Technol. 2008;2(4):735–738. doi: 10.1177/193229680800200429. [DOI] [PMC free article] [PubMed] [Google Scholar]
- 8.Renard E, Place J, Cantwell M, Chevassus H, Palerm CC. Closed-loop insulin delivery using a subcutaneous glucose sensor and intraperitoneal insulin delivery: feasibility study testing a new model for the artificial pancreas. Diabetes Care. 2010;33(1):121–127. doi: 10.2337/dc09-1080. [DOI] [PMC free article] [PubMed] [Google Scholar]
- 9.Hovorka R. Continuous glucose monitoring and closed-loop systems. Diabet. Med. 2006;23(1):1–12. doi: 10.1111/j.1464-5491.2005.01672.x. [DOI] [PubMed] [Google Scholar]
- 10.Parker R, Doyle F, III, Peppas N. The intravenous route to blood glucose control. IEEE Eng. Med. Biol. 2001;20(1):65–73. doi: 10.1109/51.897829. [DOI] [PubMed] [Google Scholar]
- 11.Ellingsen C, Dassau E, Zisser H, Grosman B, Percival MW, Jovanovič L, Doyle FJ., III Safety constraints in an artificial pancreatic β cell: an implementation of model predictive control with insulin on board. J. Diabetes Sci. Technol. 2009;3(3):536–544. doi: 10.1177/193229680900300319. [DOI] [PMC free article] [PubMed] [Google Scholar]
- 12.Parker RS, Doyle FJ, III, Peppas NA. A model-based algorithm for blood glucose control in type I diabetic patients. IEEE Trans. Biomed. Eng. 1999;46(2):148–157. doi: 10.1109/10.740877. [DOI] [PubMed] [Google Scholar]
- 13.Hovorka R, Canonico V, Chassin LJ, Haueter U, Massi-Benedetti M, Federici MO, Pieber TR, Schaller HC, Schaupp L, Vering T, Wilinska ME. Nonlinear model predictive control of glucose concentration in subjects with type 1 diabetes. Physiol. Meas. 2004;25(4):905–920. doi: 10.1088/0967-3334/25/4/010. [DOI] [PubMed] [Google Scholar]
- 14.Magni L, Raimondo DR, Bossi L, Dalla Man C, de Nicolao G, Kovatchev B, Cobelli C. Model predictive control of type 1 diabetes: an in silico trial. J. Diabetes Sci. Technol. 2007;1(6):804–815. doi: 10.1177/193229680700100603. [DOI] [PMC free article] [PubMed] [Google Scholar]
- 15.Hovorka R, Allen JM, Elleri D, Chassin LJ, Harris J, Xing D, Kollman C, Hovorka T, Larsen AMF, Nodale M, Palma AD, Wilinska ME, Acerini CL, Dunger DB. Manual closed-loop insulin delivery in children and adolescents with type 1 diabetes: a phase 2 randomised crossover trial. Lancet. 2010;375(9716):743–751. doi: 10.1016/S0140-6736(09)61998-X. [DOI] [PubMed] [Google Scholar]
- 16.Nelson DN, Cox MM. Principles of Biochemistry. 4th edition. New York, NY: Freeman; 2005. [Google Scholar]
- 17.Tatò F, Tatò S, Beyer J, Schrezenmeir J. Circadian variation of basal and post-prandial insulin sensitivity in healthy individuals and patients with type-1 diabetes. Diabetes Res. 1991;17(1):13–24. [PubMed] [Google Scholar]
- 18.Allen NHP, Kerr D, Smythe PJ, Martin N, Osola K, Thompson C. Insulin sensitivity after phototherapy for seasonal affective disorder. Lancet. 1992;339(8800):1065–1066. [PubMed] [Google Scholar]
- 19.Hopkins D. Exercise-induced and other daytime hypoglycemic events in patients with diabetes: prevention and treatment. Diabetes Res. Clin. Pract. 2004;65 Suppl 1:S35–S39. doi: 10.1016/j.diabres.2004.07.009. [DOI] [PubMed] [Google Scholar]
- 20.Scheiner G, Boyer BA. Characteristics of basal insulin requirements by age and gender in type-1 diabetes patients using insulin pump therapy. Diabetes Res. Clin. Pract. 2005;69(1):14–21. doi: 10.1016/j.diabres.2004.11.005. [DOI] [PubMed] [Google Scholar]
- 21.Heinemann L. Variability of insulin absorption and insulin action. Diabetes Technol. Ther. 2002;4(5):673–682. doi: 10.1089/152091502320798312. [DOI] [PubMed] [Google Scholar]
- 22.Dalla Man C, Camilleri M, Cobelli C. A system model of oral glucose absorption: validation on gold standard data. IEEE Trans. Biomed. Eng. 2006;53(12):2472–2478. doi: 10.1109/TBME.2006.883792. [DOI] [PubMed] [Google Scholar]
- 23.Hovorka R, Shojaee-Moradie F, Carroll PV, Chassin LJ, Gowrie IJ, Jackson NC, Tudor RS, Umpleby AM, Jones RH. Partitioning glucose distribution/transport, disposal, and endogenous production during IVGTT. Am. J. Physiol. Endocrinol. Metab. 2002;282(5):E992–E1007. doi: 10.1152/ajpendo.00304.2001. [DOI] [PubMed] [Google Scholar]
- 24.Wilinska ME, Chassin LJ, Schaller HC, Schaupp L, Pieber TR, Hovorka R. Insulin kinetics in type-1 diabetes: continuous and bolus delivery of rapid acting insulin. IEEE Trans. Biomed. Eng. 2005;52(1):3–12. doi: 10.1109/TBME.2004.839639. [DOI] [PubMed] [Google Scholar]
- 25.Oruklu ME, Cinar A, Quinn L, Smith D. Estimation of future glucose concentrations with subject-specific recursive linear models. Diabetes Technol. Ther. 2009;11(4):243–253. doi: 10.1089/dia.2008.0065. [DOI] [PMC free article] [PubMed] [Google Scholar]
- 26.Finan DA, Zisser H, Jovanovič L, Bevier WC, Seborg DE. Practical issues in the identification of empirical models from simulated type 1 diabetes data. Diabetes Technol. Ther. 2007;9(5):438–450. doi: 10.1089/dia.2007.0202. [DOI] [PubMed] [Google Scholar]
- 27.Finan DA, Palerm CC, Doyle FJ, III, Seborg DE, Zisser H, Bevier WC, Jovanovič L. Effect of input excitation on the quality of empirical dynamic models for type 1 diabetes. AIChE J. 2009;55(5):1135–1146. [Google Scholar]
- 28.Percival MW, Bevier WC, Wang Y, Dassau E, Zisser HC, Jovanovič L, Doyle FJ., III Modeling the effects of subcutaneous insulin administration and carbohydrate consumption on blood glucose. J. Diabetes Sci. Technol. 2010;4(5):1214–1228. doi: 10.1177/193229681000400522. [DOI] [PMC free article] [PubMed] [Google Scholar]
- 29.Zisser H, Jovanovič L, Doyle F, III, Ospina P, Owens C. Run-to-run control of meal-related insulin dosing. Diabetes Technol. Ther. 2005;7(1):48–57. doi: 10.1089/dia.2005.7.48. [DOI] [PubMed] [Google Scholar]
- 30.Bemporad A, Morari M, Dua V, Pistikopoulos EN. The explicit linear quadratic regulator for constrained systems. Automatica. 2002;38(1):3–20. [Google Scholar]
- 31.Dua P, Pistikopoulos EN. Modelling and control of drug delivery systems. Comput. Chem. Eng. 2005;29(11–12):2290–2296. [Google Scholar]
- 32.Dua P, Doyle FJ, III, Pistikopoulos EN. Model-based blood glucose control for type 1 diabetes via parametric programming. IEEE Trans. Biomed. Eng. 2006;53(8):1478–1491. doi: 10.1109/TBME.2006.878075. [DOI] [PubMed] [Google Scholar]
- 33.Kovatchev BP, Breton M, Man CD, Cobelli C. In silico preclinical trials: a proof of concept in closed-loop control of type 1 diabetes. J. Diabetes Sci. Technol. 2009;3(1):44–55. doi: 10.1177/193229680900300106. [DOI] [PMC free article] [PubMed] [Google Scholar]
- 34.Cobelli C, Ruggeri A. Evaluation of portal/peripheral route and of algorithms for insulin delivery in the closed-loop control of glucose in diabetes—a modeling study. IEEE Trans. Biomed. Eng. 1983;30(2):93–103. doi: 10.1109/tbme.1983.325203. [DOI] [PubMed] [Google Scholar]
- 35.Vicini P, Sparacino G, Caumo A, Cobelli C. Estimation of endogenous glucose production after a glucose perturbation by nonparametric stochastic deconvolution. Comput. Methods Programs Biomed. 1997;52(3):147–156. doi: 10.1016/s0169-2607(96)01784-1. [DOI] [PubMed] [Google Scholar]
- 36.Dalla Man C, Rizza RA, Cobelli C. Meal simulation model of the glucose-insulin system. IEEE Trans. Biomed. Eng. 2007;54(10):1740–1749. doi: 10.1109/TBME.2007.893506. [DOI] [PubMed] [Google Scholar]
- 37.Percival MW, Dassau E, Zisser H, Jovanovič L, Doyle FJ., III Practical approach to design and implementation of a control algorithm in an artificial pancreatic beta cell. Ind. Eng. Chem. Res. 2009;48(13):6059–6067. [Google Scholar]
- 38.Percival MW, Grosman B, Dassau E, Zisser H, Jovanovič L, Doyle FJ., III Am. Diabetes Assoc. 2009 doi: 10.1016/j.jprocont.2010.10.003. 69th Scientific Sessions. [DOI] [PMC free article] [PubMed] [Google Scholar]
- 39.Kovatchev BP, Cox DJ, Gonder-Frederick LA, Young-Hyman D, Schlundt D, Clarke W. Assessment of risk for severe hypoglycemia among adults with IDDM: validation of the low blood glucose index. Diabetes Care. 1998;21(11):1870–1875. doi: 10.2337/diacare.21.11.1870. [DOI] [PubMed] [Google Scholar]
- 40.Marchetti G, Barolo M, Jovanovič L, Zisser H, Seborg DE. A feedforward-feedback glucose control strategy for type 1 diabetes mellitus. J. Process Control. 2008;18(2):149–162. doi: 10.1016/j.jprocont.2007.07.008. [DOI] [PMC free article] [PubMed] [Google Scholar]
- 41.Seborg DE, Edgar TF, Mellichamp DA. Process Dynamics and Control. 2nd edition. Hoboken, NJ: John Wiley & Sons; 2004. [Google Scholar]
- 42.Walsh J, Roberts R. Pumping Insulin. 4th edition. San Diego, CA: Torrey Pines Press; 2006. [Google Scholar]
- 43.Grancharova A, Johansen TA, Kocijan J. Explicit model predictive control of gas-liquid separation plant via orthogonal search tree partitioning. Comput. Chem. Eng. 2004;28(12):2481–2491. [Google Scholar]
- 44.Kvasnica M, Grieder P, Baotic M, Morari M. Multi-parametric toolbox (MPT) Hybrid Syst.: Comput. Control. 2004;2993:448–462. [Google Scholar]
- 45.Löfberg J. YALMIP: a toolbox for modeling and optimization in MATLAB. IEEE Int. Symp. Comp. Aided Contr. Syst. Des. 2004;1:284–289. [Google Scholar]
- 46.Bantle JP. The dietary treatment of diabetes mellitus. Med. Clin. North Am. 1988;72(6):1285–1299. doi: 10.1016/s0025-7125(16)30707-6. [DOI] [PubMed] [Google Scholar]
- 47.Cameron F, Niemeyer G, Gundy-Burlet K, Buckingham B. Statistical hypoglycemia prediction. J. Diabetes Sci. Technol. 2008;2(4):612–621. doi: 10.1177/193229680800200412. [DOI] [PMC free article] [PubMed] [Google Scholar]
- 48.Buckingham B, Cobry E, Clinton P, Gage V, Caswell K, Kunselman E, Cameron F, Chase HP. Preventing hypoglycemia using predictive alarm algorithms and insulin pump suspension. Diabetes Technol. Ther. 2009;11(2):93–97. doi: 10.1089/dia.2008.0032. [DOI] [PMC free article] [PubMed] [Google Scholar]
- 49.Dassau E, Cameron F, Lee H, Bequette BW, Zisser H, Jovanovič L, Chase HP, Wilson DM, Buckingham BA, Doyle FJ., III Realtime hypoglycemia prediction suite using continuous glucose monitoring (CGM), a safety net for the artificial pancreas. Diabetes Care. 2010;33(6):1249–1254. doi: 10.2337/dc09-1487. [DOI] [PMC free article] [PubMed] [Google Scholar]
- 50.Finan DA, Zisser H, Jovanovič L, Bevier W, Seborg DE. Automatic detection of stress states in type 1 diabetes subjects in ambulatory conditions. Ind. Eng. Chem. Res. 2010;49(17):7843–7848. doi: 10.1021/ie901891c. [DOI] [PMC free article] [PubMed] [Google Scholar]
- 51.Palerm CC, Zisser H, Doyle III LJFJ. A run-to-run control strategy to adjust basal insulin infusion rates in type 1 diabetes. J. Process Control. 2008;18(3–4):258–265. doi: 10.1016/j.jprocont.2007.07.010. [DOI] [PMC free article] [PubMed] [Google Scholar]
- 52.Wang Y, Dassau E, Doyle FJ., III Closed-loop control of artificial pancreatic β-cell in type 1 diabetes mellitus using model predictive iterative learning control. IEEE Trans. Biomed. Eng. 2010;57(2):211–219. doi: 10.1109/TBME.2009.2024409. [DOI] [PubMed] [Google Scholar]
- 53.Magni L, Forgione M, Toffanin C, Man CD, Kovatchev B, Nicolao GD, Cobelli C. Run-to-run tuning of model predictive control for type 1 diabetes subjects: in silico trial. J. Diabetes Sci. Technol. 2009;3(5):1091–1098. doi: 10.1177/193229680900300512. [DOI] [PMC free article] [PubMed] [Google Scholar]
- 54.Jovanovič L. Insulin therapy and algorithms for treating type 1 diabetes mellitus, in: Optimizing insulin therapy in patients with diabetes. CME Activity jointly sponsored by Washington Hospital Center and MedStar Research Institute. 2002:13–19. [Google Scholar]
- 55.Wansink B, Chandon P. Meal size, not body size, explains errors in estimating the calorie content of meals. Ann. Intern. Med. 2006;145(5):326–332. doi: 10.7326/0003-4819-145-5-200609050-00005. [DOI] [PubMed] [Google Scholar]
- 56.Kovatchev BP, Cox DJ, Gonder-Frederick L, Clarke WL. Methods for quantifying self-monitoring blood glucose profiles exemplified by an examination of blood glucose patterns in patients with type 1 and type 2 diabetes. Diabetes Technol. Ther. 2002;4(3):295–303. doi: 10.1089/152091502760098438. [DOI] [PubMed] [Google Scholar]
- 57.Chassin LJ, Wilinska ME, Hovorka R. Grading system to assess clinical performance of closed-loop glucose control. Diabetes Technol. Ther. 2005;7(1):72–82. doi: 10.1089/dia.2005.7.72. [DOI] [PubMed] [Google Scholar]


