Abstract
Marked aneuploidy and loss of multiple chromosomes are hallmarks of cancer, but whether these events are only present in malignant cells is not known. In prior work, we showed that approximately half of spontaneous autosomal mutants isolated directly from normal kidney epithelium arose from loss of a marker chromosome 8 containing the wild type Aprt gene. Chromosome loss was detected by loss of heterozygosity (LOH) for all chromosome 8 polymorphic loci examined (Turker et al, Aging Cell, 6:73-86, 2007). To determine whether loss of chromosome 8 reflected a larger mitotic event, LOH was examined for polymorphic loci on 11 non-selected chromosomes in Aprt mutants that lost the selected chromosome 8 homologue. LOH events were detected for one or more non-selected chromosomes in 38% of these mutants. The additional LOH events also reflected apparent chromosome loss based on the molecular analysis. Metaphase spreads from mutants that lost chromosome 8 were markedly aneuploid and chromosome painting revealed reduced levels for any chromosome shown to be lost with the LOH analysis. In contrast, LOH on non-selected chromosomes was infrequent in Aprt mutants exhibiting intragenic events or mitotic recombination for chromosome 8, and marked aneuploidy was absent. These observations suggest that the mechanism leading to chromosome loss in somatic mammalian cells is often not a simple non-disjunction event and instead could result from a single catastrophic event. They also suggest that cells with characteristics of malignancy are present in normal appearing tissue.
INTRODUCTION
Many cancers exhibit aneuploid karyotypes often accompanied by chromosomal instability (CIN), which is characterized by evolving karyotypes (Storchova and Pellman 2004). Aneuploidy and CIN are not identical, however, because some tumors exhibit stable aneuploid karytoypes, whereas the CIN phenotype requires karyotypic instability due to high rates of chromosome loss and gain (Geigl, et al. 2008).
A model to explain the formation of CIN-related aneuploid cells is based on genetic deficiencies that reduce expression of genes required for appropriate chromosome segregation (King 2008; Ricke, et al. 2008). Models to explain chromosome loss without CIN are based on physical problems that occur during mitosis. For example, elevated numbers of centrosomes can cause individual chromosomes to attach to more than one spindle pole (termed a merotelic attachment), which delay chromosome transit through mitosis and result in aneuploidy in viable daughter cells (Ganem, et al. 2009; Silkworth, et al. 2009), and reductive divisions that create quasi-diploid daughter cells demonstrate aneuploidy in non-malignant cells (Duncan, et al. 2009) Recently, viable progeny of multipolar divisions have been observed (Duncan, et al. 2010) suggesting a mechanism to generate mutant cells that are markedly aneuploid despite being derived from normal cells without an underlying genetic deficiency.
We use the mouse kidney as a model for autosomal mutation in vivo. Autosomal mutations include intragenic events (e.g., base pair substitution or epigenetic silencing), interstitial deletions, chromosome loss, and mitotic recombination (Turker 2003). Aprt mutant cells are isolated from kidneys of Aprt heterozygous mice, expanded, and examined to determine the nature of the underlying mutation on chromosome 8, which contains Aprt (Turker, et al. 2007). Chromosome loss, as defined by loss of heterozygosity (LOH) for all polymorphic loci examined on chromosome 8, is the most common mutational event in the mouse kidney epithelium, being present in approximately 50% of all mutants. To determine whether loss of chromosome 8 reflected a larger mitotic event, these Aprt mutants were examined in more detail. We demonstrate that LOH on additional chromosomes is relatively common in Aprt mutants exhibiting loss of chromosome 8 and that these additional LOH events also reflect chromosome loss. Moreover these mutants are markedly aneuploid, in contrast to intragenic and mitotic recombinant mutants.
MATERIALS AND METHODS
Mouse Strain
The Aprt knockout allele (Engle, et al. 1996) has been backcrossed more than 35 generations into the C57BL/6 background. F1 hybrid mice (B6D2F1) heterozygous for the Aprt locus were derived as described previously (Ponomareva, et al. 2002). Clonally derived cells were isolated for this study from a total of 57 mice.
Isolation of Aprt mutant and non-mutant kidney clones
The Aprt mutant clones examined for this study were isolated either during a prior study of the effects of aging on autosomal mutation (Turker, et al. 2007) or from un-irradiated control mice from a study of the mutagenic effects of Fe ions (Turker, et al. 2009). B6D2F1 hybrid mice (C57BL/6 X DBA/2) were used for those studies. Aprt mutant cells were selected with 2′6-diaminopurine (DAP) from kidneys of mice heterozygous for Aprt (i.e., Aprt +/−) according to an established protocol (Ponomareva, et al. 2002). Briefly, mouse kidneys were enzymatically digested (Liberase, Roche) and plated in DAP medium (80 μg /ml in DMEM and 15% FBS) with medium changed once a week. Randomly chosen, non-mutant (i.e., non-DAP selected) clones were isolated specifically for this study from B6D2F1 mice. Each primary kidney clone (mutant or non-mutant) was isolated with a cloning cylinder after 5 to 6 weeks of growth, trypsinized, and the cells plated in a single well of a 24-well plate in DMEM supplemented with 15% fetal bovine serum. The cells were allowed sufficient time to become confluent, and then split into two wells. A process of 1:2 splits was continued until a sufficient cell number was available to plate into a 25 cm2 flask, where the cells were maintained until they became confluent in the flask, at which time DNA was isolated. One additional split was performed if the cells were also to be used for a cytogenetic analysis (see below).
Molecular analysis
DNA was isolated from Aprt mutant clones using a conventional “salting out” method (Miller, et al. 1988). To identify the mutational event that led to loss of Aprt expression, the DNA preparation from each mutant cell was examined for retention or loss of heterozygosity (LOH) by amplifying 13 polymorphic microsatellite loci on chromosome 8 (Invitrogen, Carlsbad, CA) (Figure 1A) including a microsatellite sequence located immediately upstream of Aprt (Turker, et al. 1999). LOH analyses were also performed for one polymorphic locus on each of 11 additional chromosomes (D2Mit356, D3Mit29, D5Mit161, D6Mit243, D7Mit246, D9Mit191, D11Mit136, D12Mit136, D13Mit66, D14Mit165, and D15Mit159), and in some instances for 4 or 5 additional polymorphic loci on chromosomes 6, 7, 12, and/or 14. Each LOH analysis was conducted at the Plant-Microbe Genomics Facility at Ohio State University. That facility uses an ABI Prism 3700 DNA analyser to separate fluorescently labelled PCR products.
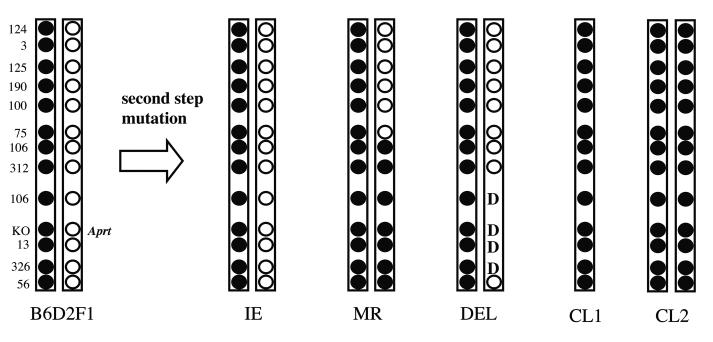
Figure 1. Patterns of loss of heterozygosity (LOH) reveal different mutational events.
The left side of this figure shows the relative locations of polymorphic loci on mouse chromosome 8, which differ between the C57BL/6 (filled circles) and DBA2 (open circles) mouse strains and were used to determine the specific mutation present in each Aprt mutant examined in this study. The B6 (C57BL/6) derived chromosome contains a knockout (KO) Aprt allele that is non-functional. The D2 (DBA/2) derived chromosome contains an expressed, wild type Aprt allele, which is the target of DAP selection (i.e. loss of expression of this Aprt allele allows a cell to grow in the presence of DAP in the culture medium). The numbers on the left side identify the chromosome 8 microsatellite loci that were examined in this study. The PCR-based molecular analysis for loss or retention of heterozygosity for polymorphic microsatellite sequences on mouse chromosome 8 in the Aprt mutant cells yields LOH patterns that can be used to classify each mutational event into one of four different categories. These are intragenic events (IE), mitotic recombination (MR), interstitial deletion of Aprt (“D” represents deleted loci), and chromosome loss without (CL1) or with (CL2) duplication of the remaining homologue. Multilocus interstitial deletions do not occur spontaneously in mouse kidney cells.
Chromosomal analysis
Kidney cell clones were expanded as described above. The cells were treated with colcemid (Invitrogen) (0.03 μg/ml) for 3 – 5 hours in the T25 flask when 50-70% confluent. After colcemid treatment the cells were trypsinized, centrifuged (188g, 5 min) and resuspended in 4 ml of prewarmed (37°C) 0.075 M KCl and incubated at 37°C for 10 min. After incubation 4 drops of freshly prepared fixative (Methanol: Acetic Acid, 3:1) were added and the pellets washed twice in 4 ml of fixative and collected by centrifugation (1000 rpm, 10 min). The pellets were resuspended in 500 μl of fixative, retained in fixative for overnight or longer, and 1-2 drops of cell suspension dropped from 3 – 5 inches onto precleaned slide (Fisher). The slides were dried overnight at room temperature. For chromosome counting the slides were treated with Wright-Giemsa stain (Fisher Scientific Company L.L.C., Kalamazoo, MI) according to manufacturer protocol. The whole mouse chromosome biotin labeling kit (Cambio, Cambridge, UK) was used for chromosome painting. The Cy3 detection kit (Cambio, Cambridge, UK) was used for detection of the biotin labeled chromosomes. Biotin specific chromosome labeling and Cy3 biotin detection were done according to the manufacturer's protocol.
Statistical Analysis
The proportion of LOH events on the genome-wide screen were compared using an exact unconditional test (Agresti 2002) with p-values computed using EXTSIG v1.3 by Brown et al (1999). The proportion of painted chromosomes that were identified as lost or retained with the LOH analysis was compared with a two sample independent T-test.
RESULTS
Analysis of genome-wide LOH events on non-selected chromosomes in Aprt mutant kidney cells
The wild type Aprt homologue is inherited from the DBA/2 parent and the Aprt knockout allele is inherited from the C57BL/6 parent in the B6D2F1 Aprt−/− mouse strain used in this study. The pattern of loss of heterozygosity (LOH) for loci on the chromosome 8 homologue inherited from the DBA/2 parent in mutant cells can reflect several mutational events including intragenic events (a.k.a., point mutations or epigenetic silencing), mitotic recombination, interstitial deletions and chromosome loss (See Figure 1). Chromosome loss could occur from direct loss of a chromosome (CL1) or loss with reduplication of the remaining homologue (CL2). Approximately 50% of Aprt mutant cells isolated from the mouse kidney demonstrate loss of the chromosome 8 homologue that bears the wild type Aprt locus, as detected by LOH for all DBA/2 chromosome 8 loci (Figure 1 and Table 1), whereas approximately half this percentage exhibit mitotic recombination between the chromosome 8 homologues or exhibit small intragenic events. Spontaneous multilocus deletions are exceptionally rare in mouse kidney cells (Turker, et al. 2007).
Table 1.
Physical location (in Cm) of polymorphic markers used in the study.
| Locus | Location |
|---|---|
| D8Mit124 | 7.6 |
| D8Mit3 | 12.9 |
| D8Mit125 | 21.1 |
| D8Mit190 | 22.1 |
| D8Mit100 | 29.7 |
| D8Mit75 | 39.3 |
| D8Mit106 | 39.6 |
| D8Mit312 | 47.1 |
| D8Mit166 | 57.8 |
| Aprt | 71.9 |
| D8Mit13 | 72.2 |
| D8Mit326 | 74.7 |
| D8Mit56 | 76.1 |
| D6Mit179 | 2.2 |
| D6Mit243 | 32.7 |
| D6Mit107 | 52.3 |
| D6Mit254 | 59.3 |
| D6Mit15 | 77.7 |
| D7Mit57 | 9.9 |
| D7Mit246 | 17.4 |
| D7Mit145 | 32.8 |
| D7Mit31 | 49.1 |
| D7Mit238 | 63.8 |
| D7Mit334 | 64.5 |
| D12Mit1 | 8.2 |
| D12Mit136 | 13 |
| D12Mit285 | 23.4 |
| D12Mit214 | 37.9 |
| D12Mit101 | 51.6 |
| D12Mit19 | 62.1 |
| D14Mit11 | 6.3 |
| D14Mit120 | 20.9 |
| D14Mit203 | 37.2 |
| D14Mit35 | 42.5 |
| D14Mit165 | 56.2 |
| D14Mit170 | 59.2 |
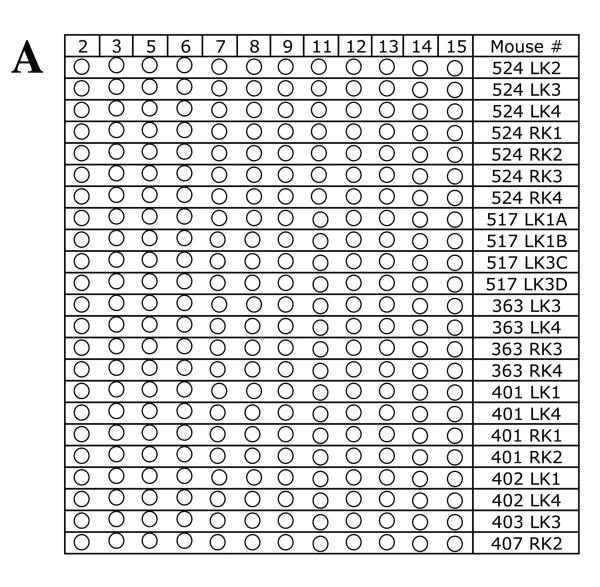
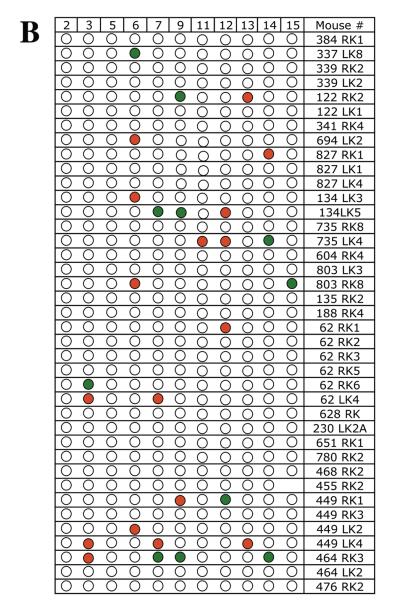
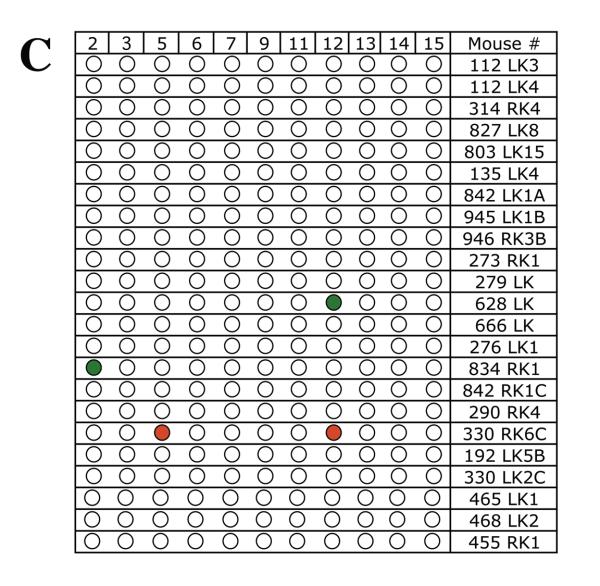
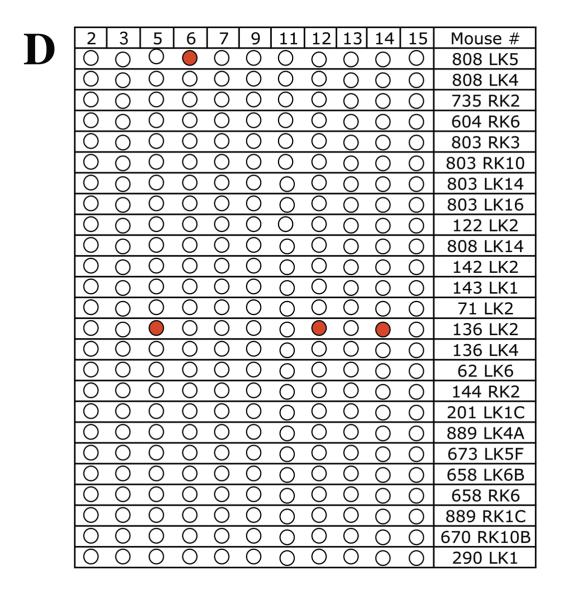
To determine whether chromosome 8 was lost independent of other mutational events or whether these mutant cells sustained multiple chromosome loss events, LOH was examined for a polymorphic locus on each of 11 additional mouse chromosomes in 39 Aprt mutant clones exhibiting loss of chromosome 8. A similar analysis was performed for 25 Aprt mutant clones exhibiting intragenic events at the Aprt locus, 23 Aprt mutant clones arising via mitotic recombination, and 23 non-mutant (i.e., non-selected) clones. The results from the LOH analysis are shown in Figure 2 (A-D) and summarized in Table 2. No LOH events were detected in the 23 non-selected clones examined (Figure 2A), including a microsatellite locus just upstream of Aprt on chromosome 8. In comparison, 15 of 39 (38%) Aprt mutant clones arising via loss of chromosome 8 exhibited additional LOH events for one or more of the 11 chromosomes screened (p <0.001) (Figure 2B); two or more additional chromosomes were affected in 9 of these case. One mutant cell (464 RK3) exhibited LOH for four additional chromosomes. LOH events on non-selected chromosomes were significantly less common in Aprt mutants exhibiting mitotic recombination (3 of 23, 13%; p=0.032) (Figure 2C) or intragenic events (2 of 25, 8%; p=0.006) (Figure 2D).
Figure 2. Genome-wide scans for LOH in non-mutant and Aprt mutant kidney clones.
LOH was examined for one polymorphic locus per each of 11 chromosomes (2,3, 5, 6, 7, 9, 11, 12, 13, 14, 15) in A, non-selected (i.e, non-mutant clones) (locus on chromosome 8 also examined); B, Aprt mutants exhibiting loss of chromosome 8; C, Aprt mutants exhibiting intragenic events; and D, Aprt mutants exhibiting mitotic recombination. For each clone, “Clone #” indicates mouse tag number, left or right kidney (LK or RK) and clone number. Red circle indicates loss of a DBA/2 locus and green circle indicates loss of C57BL/6 locus. Open circles indicate retention of heterozygosity.
Table 2.
LOH events on additional chromosomesa in Aprt mutants isolated from mouse kidneys.
| Aprt mutationb | clones w/LOHc | total LOH eventsd |
|---|---|---|
| Non-mutant (NM) | 0/23 (0%) | 0/252 (0%) |
| Chromosome loss (CL) | 15/39 (38%) | 28/428 (6.5%) |
| Mitotic recombination (MR) | 3/23 (13%) | 4/253 (1.6%) |
| Intragenic event (IE) | 2/25 (8%) | 4/275 (1.5%) |
| Statistical comparison (p values)e | ||
| NM vs. CL | <0.001 | <0.001 |
| MR vs. CL | 0.032 | 0.003 |
| IE vs. CL | 0.006 | 0.001 |
| NM vs. MR | 0.155 | 0.109 |
| NM vs. IE | 0.358 | 0.121 |
| MR vs. IE | 0.721 | 1.000 |
One polymorphic locus for each of 11 additional chromosomes (2, 3, 5, 6, 7, 9, 11, 12, 13, 14, and 15) was examined for LOH.
The mutational event on chromosome 8 that led to loss of Aprt expression in mutant clones; non-mutant clones were isolated, without selection, from mouse kidneys.
The number of clones with one of more LOH events divided by the number of clones examined.
The number of loci exhibiting LOH divided by the number of loci examined. Data from chromosome 8 are excluded.
Statistical comparisons using exact unconditional test. Significant differences are bolded.
Further analysis of genome-wide LOH in Aprt mutant cells
The genomic LOH data were also examined to determine the percentage of LOH events for all loci screened on the non-selected chromosomes (i.e., excluding those LOH events occurring on chromosome 8). To do so, the number of LOH events detected was divided by the total number of loci screened for each class of Aprt mutant (Table 2). For example, 249 loci were screened for the 39 Aprt mutant clones exhibiting loss of chromosome 8, and 28 LOH events were observed (6.5%). Of note, the 28 LOH events detected on the 11 additional screened chromosomes were due to loss of either DBA/2 inherited alleles (17 instances) or C57BL/6 alleles (11 instances). This is in contrast to the biased loss of DBA/2 alleles on chromosome 8, which was required for generation of the selected Aprt null cells. Moreover, at least one LOH event was observed for 9 of the 11 chromosomes surveyed and loss of either the DBA/2 or C57BL/6 inherited homologues was observed for 6 chromosomes (chromosomes 3, 6, 7, 9, 12, and 14) in independent mutants (See Figure 2B). These results demonstrate that a parental strain bias does not exist for the non-selected genomic LOH events.
In contrast, additional LOH events were uncommon in intragenic and mitotic recombination Aprt mutants. Only 4 genomic LOH events, from a total of 275 loci screened (1.5%), were observed for Aprt mutants exhibiting intragenic events and only 4 genomic LOH events, from a total of 253 loci scored (1.6%), were observed for Aprt mutants exhibiting mitotic recombination involving the chromosome 8 homologues (Table 2). The percentages were significantly lower than those observed for Aprt mutants exhibiting loss of chromosome 8 (p=0.001 and p=0.003, respectively, for intragenic and mitotic recombination mutants). These results suggest that intragenic and mitotic recombination events are most often singular in nature because the rest of the genome is apparently unaffected.
Genome wide LOH reflects additional chromosome loss events
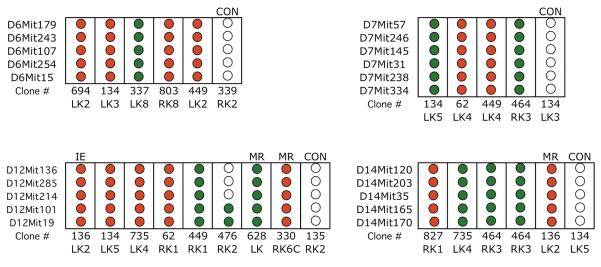
The additional LOH events in the Aprt mutants exhibiting loss of chromosome 8 could be due to other chromosome loss events, mitotic recombination, interstitial deletion, or a combination of these events. To distinguish these possibilities, additional polymorphic loci were examined for non-selected chromosomes that revealed LOH with the genome wide scan. In every case, chromosome loss apparently occurred on the non-selected chromosome because LOH was observed for all polymorphic loci examined (Figure 3; Table 2 provides location of these loci). Interestingly, mitotic recombination was detected in two cases in which LOH was not observed for that chromosome in the initial genome wide screen (Figure 3 shows one example). Moreover, the LOH events in the intragenic and mitotic recombination mutants were also due to chromosome loss (Figure 3).
Figure 3. Detailed LOH analysis for non-targeted chromosomes.
LOH events for chromosomes 6, 7, 12, or 14, detected in the genome-wide screen shown in Figure 2, were examined with additional polymorphic loci for these chromosomes. Unless indicated otherwise (MR, mitotic recombination; IE, intragenic event; CON, control; see Figure 1), the Aprt mutant clones examined exhibited loss of chromosome 8. Control clones (CON) were chosen from those that did not exhibit an LOH event for the chromosome examined in the initial screen (Figure 2) though examples of MR were detected in some controls (see mutant 476RK2, chromosome 12 analysis for example). “Clone #” indicates mouse tag number, left or right kidney (LK or RK) and clone number. Red circle indicates loss of a DBA/2 locus and green circle indicates loss of C57BL/6 locus. Open circles indicate retention of heterozygosity.
Chromosome counts in Aprt mutant cells
An analysis of chromosome number in a subset of the Aprt mutant clones was conducted to determine if a relation exists between chromosome loss, as defined by the LOH analysis, and aneuploidy beyond that expected from simple chromosome loss. As a control for growth in cell culture, a non-selected Aprt heterozygous clone (Aprt+/−) used in other studies (Turker, et al. 2009) was examined at two time points. The first was two passages after the initial T25 flask was obtained, at which time the culture was predominantly diploid, and the second was 19 passages later, at which time the culture contained roughly equal numbers of diploid and tetraploid cells (Table 3). Therefore, growth in culture could affect ploidy levels, but was insufficient to yield aneuploid cultures.
Table 3.
Chromosome counts in Aprt mutants.
| Clonea | Mutationb | Ploidyc | Median Chromosome #d |
|---|---|---|---|
| 4a (2 passages) | NS | D | 40 |
| 4a (19 passages) | NS | D/T | 40/80 |
| 465RK1 | IN | D/T | 39/75 |
| 468RK1 | IN | D/T | 40/80 |
| 483RK2 | IN | ND/NT | 37/72 |
| 468LK2 | MR | D/T | 40/80 |
| 465LK1 | MR | D/T | 39/79 |
| 476RK1 | MR | D/T | 40/80 |
| 468RK2 | CL | NT | 72 |
| 464RK3 | CL | A/A | 30/59 |
| 449RK1 | CL | A | 59 |
| 449RK3 | CL | A | 54 |
| 449LK2 | CL | ND/NT | 37/72 |
| 449LK4 | CL | A | 52 |
| 476RK2 | CL | A/A | 35/64 |
Each mutant clone is designated by the tag number of the mouse, the kidney it was derived from (right or left) and the clone number (e.g., the third mutant clone picked from a kidney is given the number 3). The non-mutant clone 4a was designated from a different numbering system. This clone was examined at 2 and 19 passages after it was established (see text).
NS, non-selected; IE, intragenic event; MR, mitotic recombination; CL, chromosome loss.
D, diploid; T, tetraploid, A, aneuploid; ND, near diploid; NT, near tetraploid.
Median value for chromosome number in each clone.
All Aprt mutant cultures were examined at two to three passages after their initial confluency in T25 flasks. The chromosome numbers from three intragenic mutants and three mitotic recombination mutants contained mostly diploid and tetraploid cells, though the cells of one clone (483RK2) were considered near diploid (peak of 37 chromosomes) and near tetraploid (peak of 72 chromosomes). In contrast, markedly aneuploid peaks were observed in five of seven mutants exhibiting loss of one or more chromosomes. The remaining two mutants exhibited near tetraploid peaks, which in one case also included a near diploid peak (clone 449LK2) (Table 3). The near tetraploid mutant, 468RK2, apparently falls into a different category than the other mutants (see below). Interestingly, one mutant (464RK3) yielded a large percentage of cells (39%) with a hypodiploid peak of 30 chromosomes per cell, which suggests that these cells are constantly generated and/or are viable.
Chromosome painting in Aprt mutant cells
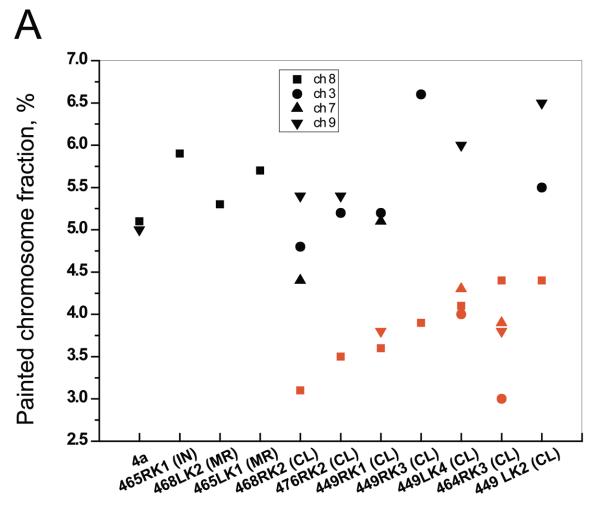
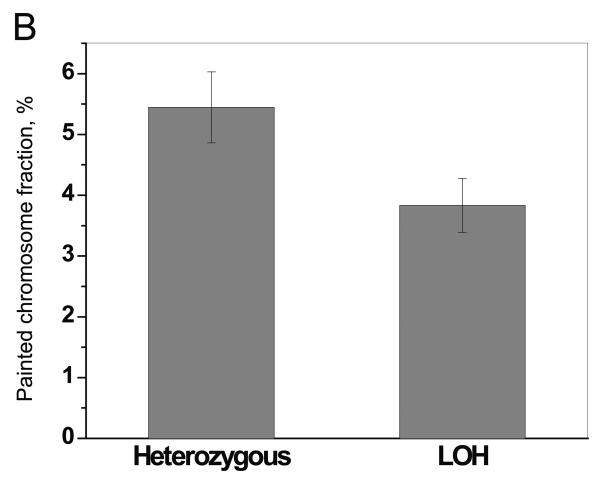
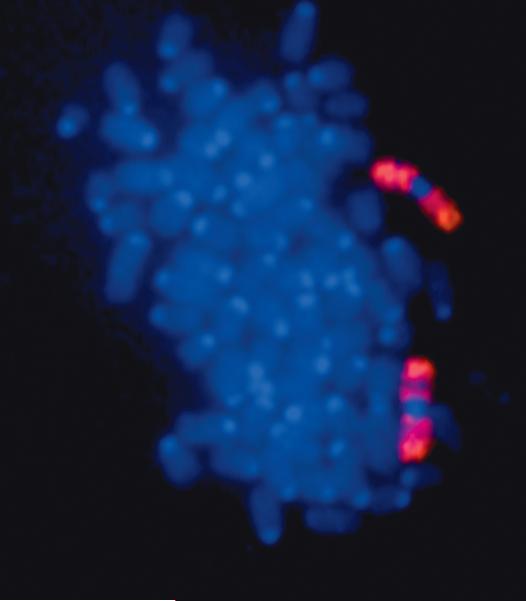
To distinguish between the two chromosome loss models shown in Figure 1, chromosome 8 painting was performed for the non-selected 4a clone, 7 mutants exhibiting chromosome loss, and 3 additional mutant clones (Table 4 and Figure 4). Chromosome 8 represented 5.0% to 5.9% of all chromosomes in the 4a cells and mutants that did not loss chromosomes, as compared with 3.1% to 4.4% in mutants exhibiting loss of one or more chromosomes. Painting for chromosomes 3, 7 and/or 9 was also performed for these mutants regardless of whether or not they exhibited loss or retention of heterozygosity. Although near overlap was observed when comparing different mutant clones, the results displayed in Figure 4A demonstrate clearly that within a given chromosome loss mutant the fraction of those chromosomes exhibiting LOH in the molecular analysis was always lower than the fraction of chromosomes that were still heterozygous. The painting results from Figure 4A were combined and show a clear difference between the LOH-defined lost and heterozygous chromosome groups (p <0.0001) (Figure 4B). One chromosome loss mutant (468RK2) retained the C57BL/6 chromosome 8 homologue as a Robertsonian translocation isochromosome (Figure 5).
Table 4.
Chromosome painting analysis.
| Clonea | Chrom. Lost b | % Chr. 8c | % Chr. 3c | % Chr. 7c | % Chr. 9c |
|---|---|---|---|---|---|
| 4a | None | 5.1% | 5.0% | ||
| 465RK1 | None | 5.9% | |||
| 465LK1 | None | 5.7% | |||
| 468LK2 | None | 5.3% | |||
| 468RK2 | 8 | 3.1% | 4.8% | 4.4% | 5.4% |
| 449RK3 | 8 | 3.9% | 6.6% | ||
| 476RK2 | 8 | 3.5% | 5.2% | 5.4% | |
| 449LK2 | 8; 6 | 4.4% | 5.5% | 6.5% | |
| 449LK4 | 8, 3, 7, 12 | 4.0% | 4.0% | 4.3% | 6.0% |
| 449RK1 | 8. 9, 12 | 3.6% | 5.2% | ||
| 464RK3 | 8, 3, 7, 9, 14 | 4.4% | 3.0% | 3.9% | 3.8% |
Each mutant clone is designated by the tag number of the mouse, the kidney it was derived from (right or left) and the clone number (e.g., the third mutant clone picked from a kidney is given the number 3). The non-mutant clone 4a was designated from a different numbering system.
Chromosome lost based on LOH analysis.
The percentages for chromosome 3, 7, 8, and 9 were calculated from the painting analysis. Each value represents the number of painted chromosomes observed divided by the total number of chromosomes counted.
Figure 4. Chromosome painting.
A. Metaphase spreads were painted to reveal chromosomes 3 (●), 7 (▲) , 8 (■), or 9 (▼). Black symbols are for heterozygous chromosomes and red symbols are for chromosomes identified as missing all chromosome 8 material from one parent in the initial LOH analysis. “Painted chromosome fraction, %” represents the number of painted chromosomes relative to the total number of chromosomes counted. B. All data from Figure 4A were pooled to compare the results from those chromosomes exhibiting extensive LOH in the PCR-based screening and those retaining chromosome homologues from the C57BL/6 and DBA/2 parents.
Figure 5. Robertsonian translocation for chromosome 8.
Representative metaphase spread from chromosome loss mutant 468RK2 painted for chromosome 8 revealing a Robertsonian translocation.
DISCUSSION
The mutational assay used for this study can detect all types of autosomal mutations (Turker 2003), but requires selection of mutants in culture from a cell suspension obtained from enzymatically-digested kidneys. This requirement raises the question of the origin of the Aprt mutant cells, either in the animal or in culture. The best argument for an in vivo origin is that the isolated kidney cells are exposed to the selective agent (DAP) before they have time to undergo replication and division in culture (Martin, et al. 1985). Considering that two rounds of replication are required for de novo mutation, formation of Aprt mutant cells in culture is unlikely. Additional evidence of an in vivo origin comes from prior work showing radiation-specific mutational signatures (Ponomareva, et al. 2002; Turker, et al. 2009) in Aprt mutant cells isolated from irradiated mice many months after the mice were irradiated. Thus, most or all of the Aprt mutant cells isolated and examined in this study arose in the animal.
A related consideration is whether the LOH events reflecting loss of non-selected chromosomes occurred in vivo or in culture. The LOH assay detects loss of polymorphic alleles in the Aprt mutant clones. If the mutations giving rise to these LOH events occurred very early during clonal expansion in cell culture (i.e., during the first one or two cell divisions after the cells were removed from a kidney and plated in culture), they could be revealed as partial loss of a polymorphic allele. LOH events occurring later during clonal expansion would simply not be present in a sufficient number of cells to be detected with the assay used. Essentially all of the LOH events detected with the genome-wide scan were due to complete loss of one of the two polymorphic loci, suggesting strongly that they occurred in the intact kidney prior to plating the dispersed cells from the kidney in culture. An alternative possibility is that clonal evolution occurs in culture with a selective advantage for certain chromosome loss events, but the wide variety of chromosomes that were affected (all 11 surveyed when considering all of the data) and the lack of any events in the non-selected clones argue against this possibility. Finally, the observation of aneuploidy in the Aprt mutants exhibiting loss of one or more chromosomes, but not in the other mutants (see below), is also evidence that these events occurred in vivo.
The presence of cells in normal kidneys with loss of multiple chromosomes is due either to sequential, independent events or one-time occurrences that lead to loss of multiple chromosomes in affected progenitor clones. The first scenario is unlikely. The Aprt mutant frequency in the kidneys of Aprt+/− mice is approximately 1 × 10⁻⁴, with approximately half of these mutant cells arising from chromosome loss events (Turker, et al. 2007). Thus, the approximate frequency of cells that have lost chromosome 8 in the mouse kidney is 5 × 10⁻⁵. Assuming that each mouse chromosome can be lost at approximately this frequency, the frequency of cells with loss of chromosome 8 and independent loss of a second chromosome would be approximately 4.5 × 10⁻⁸ (5 × 10⁻⁵ multiplied by 5 × 10⁻⁵ multiplied by 18; the latter number is the additional autosomes that could be affected). The predicted frequency of mutant cells that undergo independent loss of three or more chromosomes would drop well below 10−10. However, our results demonstrated that more than one-third of all Aprt mutant clones exhibiting loss of chromosome 8 also lost one or more additional chromosomes, leading to an approximate frequency of 1.8 × 10⁻⁵ for mouse kidney cells with loss of chromosome 8 and one or more additional chromosomes. Three mutants (134LK5, 735LK4, and 449LK2) lost four chromosomes including chromosome 8 and one mutant (464RK3) lost five chromosomes (Figure 2B). Simply stated, these numbers are inconsistent with sequential independent events in normal kidney epithelial cells, but are consistent with a single, dramatic mutational event. A caveat for this conclusion is that loss of one chromosome could increase the chance of sequential losses of additional chromosomes, which could be considered a manifestation of the CIN phenotype, but work with mouse kidney cells heterozygous for both Aprt and Tk failed to reveal an increased frequency of Tk mutation in Aprt mutants exhibiting loss of chromosome 8 or an increased frequency of Aprt mutation in Tk mutants exhibiting loss of chromosome 11 (unpublished).
The alternative hypothesis of a single event leading to loss of multiple chromosomes is consistent with several observations. The first is chromosome number in mutants exhibiting loss of one or more chromosomes, as evaluated by Giemsa staining. Chromosome number could change as a result of cell growth in culture, as shown by the presence of two chromosome peaks in many of the Aprt mutants. However, a significant difference between the mutants exhibiting loss of chromosomes and the other mutants was that only the former were markedly aneuploid. Data from the unselected 4a cell line and Aprt mutant clones exhibiting intragenic events or mitotic recombination demonstrate that tetraploid cells can form in culture, but that this change does not lead to widespread aneuploidy. Thus, the aneuploid karyotypes: 1) distinguishes mutants that loss of one or more chromosomes, 2) demonstrates a relation between aneuploidy and the mechanism(s) leading to chromosome loss, and 3) suggests strongly that this relation began in vivo. Additional aneuploid peaks would have arisen in culture, but would still reflect an event that initially occurred in situ. Whether aneuploidy is a result of CIN or can lead to CIN in the mutants examined here is not known at this time. More work is required to resolve these issues.
Chromosome painting was used to address whether loss of a homologue, as defined by the LOH analysis, was accompanied by duplication of the remaining homologue. The data clearly distinguished the LOH-defined chromosomes as being present at lower levels than those that were still heterozygous. The relative percentages of the remaining homologues were higher than predicted for simple chromosome loss (i.e., 2.5%), which is consistent with suggestions that the presence of two homologues per diploid genome provides a selective advantage after loss of a homologue (Ganem, et al. 2007). Alternatively, though not exclusively, these percentages could simply be related to aneuploid karyotypes. Regardless, the chromosome painting results are consistent with an initial chromosome loss event occurring independent of a duplication of the remaining homolog, and in light of the data showing loss of multiple chromosomes suggest a dramatic mutational event.
As noted in the Introduction, either somatic deficiencies for genes required for appropriate chromosome segregation or physical problems such as excess centrosomes could lead to aneuploid states in mammalian somatic cells. We have shown elsewhere that chromosome loss is common in normal mouse kidney epithelium (Turker, et al. 2007), which suggests strongly that these events do not require underlying genetic deficiencies. Here we showed that: 1) multiple chromosomes are often affected within a given mutant clone, 2) chromosome loss does not occur concomitant with reduplication of the remaining homologue and 3) aneuploidy beyond that expected from simple chromosome loss is present in the mutants exhibiting loss of one or more chromosomes. A speculative model that links these data and recent literature is that the mutants exhibiting chromosome loss are derived from a tetraploid precursor. Tetraploidization has been suggested as a precursor to aneuploidy in preneoplastic lesions such as Barrett's esophagus and ulcerative colitis (Rajagopalan and Lengauer 2004). Approximately 7% of the cells in the kidneys of B6D2F1 mice are tetraploid, as shown by cytogenetic work on very short term primary cultures (Turker, et al. 2004). Thus, a potential mechanism for multiple chromosomes being lost simultaneously in the mouse kidney is imperfect ploidy reduction, which is consistent with recent observations made with tetraploid yeast (Gerstein, et al. 2008) and mouse fusion-derived tetraploid hepatocytes (Duncan, et al. 2009). Recent work with spontaneously occurring tetraploid mouse hepatocytes demonstrates that multipolar mitotic spindles can occur and result in viable and aneuploid progeny (Duncan, et al. 2010). Such a mechanism is consistent with our results, though clearly more work is required to demonstrate this pathway.
A final consideration from this study is the limited number of mitotic recombinant and intragenic Aprt mutants exhibiting loss of non-selected chromosomes (see Figure 2C and D). The frequency of loss of non-selected chromosomes in these mutants was significantly less than in the mutants exhibiting loss of chromosome 8, but cells with these mixed classes of mutational events were occasionally detected nonetheless. Unfortunately, we do not have frozen aliquots of these cells to determine if they are also aneuploid, which would help determine if the chromosome loss events arose via similar mechanisms to the mutants discussed above. However, mitotic recombination events were observed in some mutants that lost chromosomes, which suggests that different classes of mutational events can occur in cells that are aneuploid.
In conclusion, we showed that approximately one third of Aprt mutant cells isolated directly from the mouse kidney and exhibiting loss of chromosome 8 also exhibit LOH for polymorphic loci on other chromosomes, that these LOH events reflect additional chromosome loss events, and that they appear to have originated as direct loss of one homologue without immediate reduplication of the remaining homologue. We further showed that mutant clones exhibiting loss of multiple chromosomes are highly aneuploid suggesting a relation between the mechanism leading to chromosome loss and the aneuploid karyotype and that cells with aneuploid karyotypes can arise and survive in the normal kidney epithelium. Whether the presence of these aneuploid cells in the kidney has any long-term consequences leading to cancer or other mutation driven diseases such as polycystic kidney disease (Koptides and Deltas 2000) remains to be determined.
ACKNOWLEDGEMENTS
This study was supported by NIH grant DK074742 and NASA grants T-403X, NNJ0HC72I and NNX10AC12G. Marissa Connolly was supported by a CROET summer fellowship. We thank Dr. Markus Grompe for helpful discussions and Drs. Harvey Mohrenweiser, Andrew Duncan, and Maura Pieretti for critical readings of the manuscript.
REFERENCES
- Agresti A. Categorical Data Analysis. 2nd ed. Wiley; New York: 2002. [Google Scholar]
- Duncan AW, Hickey RD, Paulk NK, Culberson AJ, Olson SB, Finegold MJ, Grompe M. Ploidy reductions in murine fusion-derived hepatocytes. PLoS Genet. 2009;5(2):e1000385. doi: 10.1371/journal.pgen.1000385. [DOI] [PMC free article] [PubMed] [Google Scholar]
- Duncan AW, Taylor MH, Hickey RD, Hanlon Newell AE, Lenzi ML, Olson SB, Finegold MJ, Grompe M. The ploidy conveyor of mature hepatocytes as a source of genetic variation. Nature. 2010;467:707–10. doi: 10.1038/nature09414. [DOI] [PMC free article] [PubMed] [Google Scholar]
- Engle SJ, Stockelman MG, Chen J, Boivin G, Yum M-N, Davies PM, Ying MY, Sahota A, Simmonds HA, Stambrook PJ. Adenine phosphoribosyltransferase-deficient mice develop 2,8-dihydroxyadenine nephrolithiasis. Proc Natl Acad Sci USA. 1996;93:5307–5312. doi: 10.1073/pnas.93.11.5307. and others. [DOI] [PMC free article] [PubMed] [Google Scholar]
- Ganem NJ, Godinho SA, Pellman D. A mechanism linking extra centrosomes to chromosomal instability. Nature. 2009;460(7252):278–82. doi: 10.1038/nature08136. [DOI] [PMC free article] [PubMed] [Google Scholar]
- Ganem NJ, Storchova Z, Pellman D. Tetraploidy, aneuploidy and cancer. Curr Opin Genet Dev. 2007;17(2):157–62. doi: 10.1016/j.gde.2007.02.011. [DOI] [PubMed] [Google Scholar]
- Geigl JB, Obenauf AC, Schwarzbraun T, Speicher MR. Defining ‘chromosomal instability’. Trends Genet. 2008;24(2):64–9. doi: 10.1016/j.tig.2007.11.006. [DOI] [PubMed] [Google Scholar]
- Gerstein AC, McBride RM, Otto SP. Ploidy reduction in Saccharomyces cerevisiae. Biol Lett. 2008;4(1):91–4. doi: 10.1098/rsbl.2007.0476. [DOI] [PMC free article] [PubMed] [Google Scholar]
- King RW. When 2+2=5: the origins and fates of aneuploid and tetraploid cells. Biochim Biophys Acta. 2008;1786(1):4–14. doi: 10.1016/j.bbcan.2008.07.007. [DOI] [PMC free article] [PubMed] [Google Scholar]
- Koptides M, Deltas CC. Autosomal dominant polycystic kidney disease: molecular genetics and molecular pathogenesis. Hum Genet. 2000;107(2):115–26. doi: 10.1007/s004390000347. [DOI] [PubMed] [Google Scholar]
- Martin GM, Smith AC, Ketterer DJ, Ogburn CE, Disteche CM. Increased chromosomal aberrations in first metaphases of cells isolated from the kidneys of aged mice. Isr J Med Sci. 1985;21(3):296–301. [PubMed] [Google Scholar]
- Miller SA, Dykes DD, Polesky HF. A simple salting out procedure for extracting DNA from human nucleated cells. Nucleic Acids Res. 1988;16(3):1215. doi: 10.1093/nar/16.3.1215. [DOI] [PMC free article] [PubMed] [Google Scholar]
- Ponomareva ON, Rose JA, Lasarev M, Rasey J, Turker MS. Tissue-specific Deletion and Discontinuous Loss of Heterozygosity Are Signatures for the Mutagenic Effects of Ionizing Radiation in Solid Tissues. Cancer Res. 2002;62:1518–1523. [PubMed] [Google Scholar]
- Rajagopalan H, Lengauer C. Aneuploidy and cancer. Nature. 2004;432(7015):338–41. doi: 10.1038/nature03099. [DOI] [PubMed] [Google Scholar]
- Ricke RM, van Ree JH, van Deursen JM. Whole chromosome instability and cancer: a complex relationship. Trends Genet. 2008;24(9):457–66. doi: 10.1016/j.tig.2008.07.002. [DOI] [PMC free article] [PubMed] [Google Scholar]
- Silkworth WT, Nardi IK, Scholl LM, Cimini D. Multipolar spindle pole coalescence is a major source of kinetochore mis-attachment and chromosome mis-segregation in cancer cells. PLoS One. 2009;4(8):e6564. doi: 10.1371/journal.pone.0006564. [DOI] [PMC free article] [PubMed] [Google Scholar]
- Storchova Z, Pellman D. From polyploidy to aneuploidy, genome instability and cancer. Nat Rev Mol Cell Biol. 2004;5(1):45–54. doi: 10.1038/nrm1276. [DOI] [PubMed] [Google Scholar]
- Turker MS. Autosomal mutation in somatic cells of the mouse. Mutagenesis. 2003;18:1–6. doi: 10.1093/mutage/18.1.1. [DOI] [PubMed] [Google Scholar]
- Turker MS, Connolly L, Dan C, Lasarev M, Gauny S, Kwoh E, Kronenberg A. Comparison of autosomal mutations in mouse kidney epithelial cells exposed to iron ions in situ or in culture. Radiat Res. 2009;172(5):558–66. doi: 10.1667/RR1805.1. [DOI] [PubMed] [Google Scholar]
- Turker MS, Gage BM, Rose JA, Elroy D, Ponomareva ON, Stambrook PJ, Tischfield JA. A novel signature mutation for oxidative damage resembles a mutational pattern found commonly in human cancers. Cancer Res. 1999;59:1837–1839. [PubMed] [Google Scholar]
- Turker MS, Lasarev M, Connolly L, Kasameyer E, Roessler D. Age-related accumulation of autosomal mutations in solid tissues of the mouse is gender and cell type specific. Aging Cell. 2007;6(1):73–86. doi: 10.1111/j.1474-9726.2006.00264.x. [DOI] [PubMed] [Google Scholar]
- Turker MS, Schwartz JL, Jordan R, Ponomareva ON, Connolly L, Kasameyer E, Lasarev M, Clepper L. Persistence of chromatid aberrations in the cells of solid mouse tissues exposed to (137)cs gamma radiation. Radiat Res. 2004;162(4):357–64. doi: 10.1667/rr3240. [DOI] [PubMed] [Google Scholar]


