

Abstract
Transposable elements (TEs) are the primary contributors to the genome bulk in many organisms and are major players in genome evolution. A clear and thorough understanding of the population dynamics of TEs is therefore essential for full comprehension of the eukaryotic genome evolution and function. Although TEs in Drosophila melanogaster have received much attention, population dynamics of most TE families in this species remains entirely unexplored. It is not clear whether the same population processes can account for the population behaviors of all TEs in Drosophila or whether, as has been suggested previously, different orders behave according to very different rules. In this work, we analyzed population frequencies for a large number of individual TEs (755 TEs) in five North American and one sub-Saharan African D. melanogaster populations (75 strains in total). These TEs have been annotated in the reference D. melanogaster euchromatic genome and have been sampled from all three major orders (non-LTR, LTR, and TIR) and from all families with more than 20 TE copies (55 families in total). We find strong evidence that TEs in Drosophila across all orders and families are subject to purifying selection at the level of ectopic recombination. We showed that strength of this selection varies predictably with recombination rate, length of individual TEs, and copy number and length of other TEs in the same family. Importantly, these rules do not appear to vary across orders. Finally, we built a statistical model that considered only individual TE-level (such as the TE length) and family-level properties (such as the copy number) and were able to explain more than 40% of the variation in TE frequencies in D. melanogaster.
Keywords: transposable elements, Drosophila, population dynamics, ectopic recombination, purifying selection
Introduction
Transposable elements (TEs) are pieces of DNA that have the ability to move between different sites in the genome using the host transcriptional and translational machinery. TEs are present in virtually all eukaryotic species investigated so far (Wicker et al. 2007) and in many organisms, they are the primary contributors to the genome bulk (Biemont and Vieira 2006). TEs have been shown repeatedly to be involved in genome restructuring (Craig et al. 2002) and to contribute to the formation of novel gene structures (Volff 2006; Sinzelle et al. 2009) and regulatory sequence innovation (Feschotte 2008; Bourque 2009). Thorough understanding of the population dynamics of TEs is essential for the understanding of the eukaryotic genome evolution and function.
Most of the studies on TE population dynamics have focused on a few model organisms (Rizzon et al. 2003; Dolgin et al. 2008; Lockton et al. 2008; Tian et al. 2009; Lockton and Gaut 2010) and specifically among them on Drosophila melanogaster (Charlesworth and Langley 1989; Charlesworth et al. 1994; Nuzhdin 1999; Kidwell and Lisch 2001). In this species, and based on the analysis of several families, TEs were found to be at low frequencies in most genomic locations and their maintenance in populations was inferred to be the result of a balance between transpositional increase in copy number and the countereffects of natural selection (Charlesworth et al. 1994). The observation that TEs were almost always present at low population frequencies was taken as evidence against TE insertions frequently inducing beneficial mutations (Charlesworth et al. 1994; González and Petrov 2009). The first genome-wide screen for recent adaptive insertions revealed that TEs did contribute substantially to adaptive evolution although the proportion of adaptive TEs indeed appeared to be small (González et al. 2008, 2010).
Despite much research, the nature of purifying selection acting against TE insertions remains controversial (Nuzhdin 1999; Petrov et al. 2003; Le Rouzic and Deceliere 2005; Dolgin and Charlesworth 2008). Disruptions of functional sequences and deleterious TE products are clearly important factors in the culling of insertions from the genome by purifying selection (Finnegan 1992; McDonald et al. 1997; Nuzhdin et al. 1997). However, it is not clear whether the same forces that are responsible for removing TEs from specific functional sites are also important for keeping TEs at low but detectable frequencies in the population (Nuzhdin 1999). In fact, a third independent force purifying selection against the deleterious effects of ectopic recombination between different copies of elements in the same family (Montgomery et al. 1987; Langley et al. 1988; Charlesworth et al. 1992; Bartolome et al. 2002; Petrov et al. 2003) has been suggested to be the dominant force in preventing TEs from reaching high frequencies even if they insert into locally nonfunctional sites and cause no local deleterious effects. The most direct evidence for this model comes from the investigation of population dynamics of four non–long terminal repeat (non-LTR) families (Petrov et al. 2003).
In addition, it is possible that TEs go through periods of high and low transpositional activity (Nuzhdin 1999; Petrov et al. 2003; Le Rouzic et al. 2007) and that the low frequency of many TEs is due to a recent increase in transpositional activity. In fact, Bergman and Bensasson (2007) suggested that LTR elements as a group contain predominantly young TEs because they recently experienced a sharp increase in their rates of transposition. They argued that this hypothesis might explain the data better than the alternative equilibrium possibility that LTR elements are young and numerous because of strong purifying selection counteracting a high equilibrium rate of transposition of LTR elements. Finally, regulation of transposition by either TE- or host-driven mechanisms needs to be taken into account as well in order to understand the population dynamics of TEs (Misra and Rio 1990; Aravin et al. 2001; Brennecke et al. 2007; Lu and Clark 2010).
Here, we study population genomics of 755 euchromatic TEs from 55 families falling into the three main orders of TEs—LTR and non-LTR retrotransposons and terminal inverted repeat (TIR) DNA transposons (Kaminker et al. 2002; Quesneville et al. 2005). We find strong evidence that TEs in Drosophila across all types and families are subject to purifying selection at the level of ectopic recombination. The strength of selection appears to be stronger in the copious families with longer TEs. In contrast, we find no evidence that TEs from different orders exhibit substantially different population dynamics over and above that explained by the individual TE-level and family-level properties.
Materials and Methods
Estimation of TE Population Frequencies
We previously used a pooled-polymerase chain reaction (PCR) approach to estimate population frequencies for 902 TEs annotated in the Release 4 of the D. melanogaster genome (González et al. 2008). DNA from five different North American (NA) populations (8–12 strains per population; 64 strains in total) and one African (AF) population collected in Malawi (11 strains) were combined into seven different pools (one pool of 8–12 strains per population except for one NA population for which two pools of 12 strains each was analyzed). Release 5 corrected the annotation for a substantial proportion of these TEs and we updated our results accordingly (supplementary Materials and Methods, Supplementary Material online). For each pool, we classified TEs as absent, polymorphic, or fixed as described in González et al. (2008). Because the frequency distribution of the 755 analyzed TEs is not significantly different among the six NA populations (Kruskal–Wallis K = 7.47, df = 5, P value = 0.19), we analyzed the results obtained for these six pools together. Note that frequency distributions of the 755 analyzed TEs are different between the NA and the AF population (Kruskal–Wallis K = 17.86, df = 1, P value = 2.37 × 10−05). However, we only used the AF pool to determine if a TE insertion is fixed in all the analyzed populations. We classified TEs as fixed, common, rare, and very rare using slightly different criteria than those described in González et al. (2008) (supplementary table S1, Supplementary Material online). TE insertions were classified as fixed when they were present in all the seven pools and we detected no alleles in any pools without the TE (estimated population frequency > 98%; Lipatov et al. 2005). For polymorphic TEs, we only took into account their frequency in NA populations and classified them as follows: TEs were classified as common when we obtained evidence that some strains lacked these TEs in some of the six NA pools but there were no NA pools in which all the strains lacked the TE (population frequency ∼ 10–98%; Lipatov et al. 2005). TEs were classified as very rare when they were entirely absent from all the six NA pools (population frequency ∼ <1.5%; Lipatov et al. 2005) and TEs were classified as rare when they were entirely absent in some NA pools and present in others (population frequency ∼ 2–15%; Lipatov et al. 2005). For the statistical analysis described below, we converted the frequency classes: “very rare,” “rare,” “common,” and “fixed” to 0, 1, 2, and 3, respectively.
Permutation-Based Analysis
We performed a permutation test based on an euclidean distance metric (d) that is designed to predict the difference in population frequencies between two TE copies based only on their length (L) and the recombination rate (R) of the region where they are inserted. Specifically, 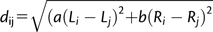 with the weights a and b determined to minimize the differences in population frequency for a random pair of TEs (supplementary Materials and Methods, Supplementary Material online). Recombination rate was estimated as described in Fiston-Lavier et al. (2010a).
For the permutation analysis, for each TE insertion (TEfocal), we found the closest TE (TEdiff) in terms of d but which belongs to a different family. We then find a TE insertion from the same family (TEsame) that is the closest to TEfocal in terms of d across all TEs from the same family but is farther or as far as TEdiff (i.e., d(TEfocal,TEsame) ≥ d(TEfocal,TEdiff)). Note that this criterion is conservative as it biases us to find greater similarity in frequency for TEs in different families.
Because we are not considering fixed TEs, the frequency of each TE copy can only be very rare (0), rare (1), or common (2). Therefore, d(TE1,TE2) can be 0, 1, or 2. If family identity matters over and above TE length and recombination rate, we expected that the number of differences in frequency equal to 0 will be higher for the TEfocal − TEsame comparison than for the TEfocal − TEdiff comparison. We then used a sign test to compare the difference in frequency between the TEfocal and TEsame with the difference in frequency between TEfocal and TEdiff.
Results
Data Set
The 755 TEs analyzed in this work belong to 55 different families, including all the high copy number (>20 TE copies) families in the genome and represent the three main orders of TEs in D. melanogaster (LTR, non-LTR, and TIR). These TEs were sampled across lengths (full-length elements, 5′ truncated non-LTR elements, shorter elements due to internal deletions, and solo-LTRs) and recombination backgrounds. Our data set did not include elements that belong to the INE-1 family because the dynamics of this TE family is different from that of all the other families in the D. melanogaster genome. Although other TE families are present in tens or at most hundreds of copies, INE-1 family contains 2,234 TEs all of which are fixed (Kapitonov and Jurka 2003; Singh and Petrov 2004). We also did not sample nested (808 TEs) and heterochromatic TEs (1,599 TEs) and we excluded 13 putatively adaptive TEs (Aminetzach et al. 2005; González et al. 2008; González et al. 2009). Our data set comprises ∼50% of all euchromatic, nonnested, non-INE-1 TEs in the Release 5 of the D. melanogaster genome (1,501 TEs; supplementary table S2, Supplementary Material online) and is similar to these TEs in the proportion of different orders and distances to nearest genes. Our data set is enriched for full-length TEs and TEs in high recombination regions.
TE Frequency Estimates
Population frequencies for the 755 TEs in our data set were previously obtained in our lab using a pooled-PCR approach (González et al. 2008). Six pools contained DNA from the NA populations, and one pool contained DNA from the AF population (see Materials and Methods). Based on the PCR result, each TE insertion was classified as absent, polymorphic, or fixed in each pool (González et al. 2008). The main experimental error in the pooled-PCR procedure comes from the failure of PCR reactions. We found that TE copies that are truly absent or fixed in the pool are rarely misclassified, whereas polymorphic TE copies are misclassified as absent or fixed only ∼5% of the time giving us confidence that experimental error is minor (supplementary Materials and Methods, Supplementary Material online).
We further tested the veracity of the pooled-PCR frequency estimation procedure by using previously collected data for 69 TEs from four different non-LTR families (Doc, jockey, BS, and X-element; Petrov et al. 2003). These TEs were interrogated for presence and absence using single-strain PCR in 18 NA and 18 Tunisian strains. Fifty-seven of these 69 TEs are part of the current study. There is a strong positive correlation between the single-strain frequency estimates and the pooled estimates (Spearman’s ρ = 0.62; P << 0.001; supplementary fig. S1 and table S3, Supplementary Material online). Supplementary figure S1, Supplementary Material online, also clearly demonstrates the advantages and disadvantages of the pooled-PCR procedure: By sampling a large number of strains, we were able to determine that approximately half (25 TEs) of the 42 TEs that appeared to be private in the sequenced strain using single-strain PCRs were in fact present at low by detectable frequencies in the NA D. melanogaster population. On the other hand, TEs identified as common by the pooled procedure have a very wide range of intermediate frequencies determined by single-strain PCR. Note that, as expected, they are never very rare. Because for many downstream analyses, the precise frequencies of TEs at an intermediate frequency (e.g., 30% vs. 80%) do not affect conclusions to the same extent as the more precise measurement of the lower frequencies (e.g., 1% vs. 10%), the pooled-PCR approach that we used to estimate individual TE frequencies is appropriate for the analyses described below.
Frequency Distribution of TEs by Family, Order, and Chromosome
We classified the 755 TEs into four frequency classes: 114 TEs are fixed, 72 TEs are common, 159 are rare, and 410 are very rare (see Materials and Methods; supplementary table S1, Supplementary Material online). We plotted the frequency distribution across the 55 studied TE families (fig. 1; supplementary table S4, Supplementary Material online). The families were arranged by order and within each order sorted by copy number. Although the majority of D. melanogaster TEs are either very rare or rare, a considerable number are either common or fixed. The frequency distribution varies significantly among families (χ2 = 859.30, df = 162, P value << 0.001) and among orders (χ2 = 236.08, df = 9, P value << 0.001). Some families, such as roo, jockey, and pogo, primarily contain TE insertions that are rare and very rare. Others, such as invader and BS, families have mostly common TE insertions, whereas S2 and Cr1a families contain mostly fixed TE insertions (fig. 1). LTR families have a higher proportion of rare and very rare TE insertions (93%) than non-LTR (70%; χ2 = 55.89, df = 1, P value << 0.001) and TIR (44%; χ2 = 180.46, df = 1, P value << 0.001) families.
FIG. 1.

TE frequency distribution by family and order.
Families with higher copy numbers have a higher proportion of rare and very rare TEs (Spearman’s ρ = 0.90, P << 0.001). This effect is weaker for the TIR than for the LTR and non-LTR elements (LTR: Spearman’s ρ = 0.93, P value << 0.001; non-LTR: Spearman’s ρ = 0.86, P value << 0.001; TIR: Spearman’s ρ = 0.54, P value = 0.01).
We also investigated the variation of TE frequencies across chromosomes (supplementary fig. S2 and table S4, Supplementary Material online). The frequency distributions are marginally dissimilar across the four major autosomal arms (χ2 = 19, df = 9, P value = 0.03). There is no significant difference between the X chromosome and the autosomes when we consider all the TEs together (χ2 = 0.21, df = 3, P value = 0.98) or when we consider TEs within each family separately (supplementary fig. S2 and table S5, Supplementary Material online).
The one clear difference is between the fourth chromosome and the rest of the genome (χ2 = 97, df = 3, P value << 0.001; supplementary fig. S2, Supplementary Material online). This is not surprising given that the fourth chromosome is mostly heterochromatic and mostly nonrecombining with sharply reduced levels of polymorphism in general (Berry et al. 1991; Wang et al. 2002). We find reduced levels of polymorphisms for TEs on the fourth chromosome as well: Among the 26 TEs for which we have frequency data 22 (84%) are fixed, two (8%) are common, and only two (8%) are very rare.
Strong Natural Selection against TE Insertions Within Genes
Overall TEs in the D. melanogaster genome appear deleterious as the majority of TEs are very rare (supplementary table S4, Supplementary Material online). First, and most straightforwardly, some TEs must be deleterious because they disrupt functionally important genic regions and exert local deleterious effects (Finnegan 1992; McDonald et al. 1997). To test this conjecture, we separated TEs into three categories: 1) TEs inside protein-coding regions (CDS), 2) TEs inserted in introns, and 3) TEs inserted in intergenic regions (Table 1). Although CDS regions constitute ∼19% of all euchromatic DNA, no TEs were found inside CDS regions, except for one putatively adaptive TE insertion (Aminetzach et al. 2005; González et al. 2008) that was excluded from this data set. There is no difference in the frequency spectra of TEs inserted in intronic and intergenic regions (χ2 = 4.43, df = 3, P value = 0.21) suggesting that deleterious effects of TEs in these regions are not detectably different. These results also strongly imply that TE insertions into CDS regions are almost universally strongly deleterious, given that the abundance of visible mutations caused by TE insertions into genes argues that TEs in D. melanogaster do not exclusively transpose outside of CDS regions (Ashburner et al. 2005).
Table 1.
Genomic Location of the TEs Analyzed in This Study.
| Genomic Compartments | Amount of DNA | Frequency Classes |
||||||||
| Very Rare |
Rare |
Common |
Fixed |
|||||||
| CDS | 19%a | 22.46b | 0% | 0 | 0% | 0 | 0% | 0 | 0% | 0 |
| Intron | 41% | 49.12 | 48% | 196 | 43% | 68 | 44% | 32 | 37% | 42 |
| Intergenic | 38% | 45.08 | 52% | 212 | 57% | 91 | 56% | 40 | 61% | 70 |
Some TEs are annotated to be part of untranslated regions (UTRs) and were excluded from this analysis; therefore, percentages do not add to 100%.
Amount of DNA in Mb.
We tested whether TEs located closer to genes are subject to stronger purifying selection by correlating the distance to a gene for each TE with its population frequency. We failed to find a significant correlation (R2 = 1.57 × 10−03; P value = 0.16). There was also no difference in population frequency among TEs that are close to genes (0–1 kb), located at an intermediate distance (1–10 kb), and those located far from genes (>10 kb; χ2 = 5.87, df = 6, P value = 0.44).
Because some TE families are known to show insertion biases (Sandmeyer et al. 1990; Spradling et al. 1995), it is possible that stronger natural selection against TE insertions near genes could be obscured by the combination of the variation in the insertional preferences of TEs in different families and sharply varying strength of selection across families. We found evidence that different families do indeed have different insertional preferences by showing that distance of a TE to the nearest gene varies sharply across families (χ2 = 49,712, df = 120, P value <<0.001; supplementary fig. S3, Supplementary Material online) and does so also for the very rare TEs (χ2 = 153980, df = 92, P value << 0.001; supplementary fig. S3, Supplementary Material online), which should reflect the insertional preferences most accurately (Messer 2009). To test for the effect of the distance to genes while accounting for different insertional preferences, we tested whether distance of TEs to the nearest gene is positively correlated with TE frequency within individual families. In all families, the numbers of TEs analyzed were too low to obtain significant results but the omnibus analysis shows that the plurality of TE families exhibit positive correlations and that this excess is marginally significant (Student t-test for families with more than five TE copies: t = 1.69, df = 33, P value = 0.05). Overall, these results suggest at most a marginal effect of the distance to genes on the population dynamics of TEs. Note that it might also be possible that TEs vary in the deleterious effect they exert on the neighboring genes but in a distance independent way—such an effect will remain undetected in these analyses.
No Evidence of Selection against the Expression of TE-Encoded Proteins
It is also possible that TEs are deleterious because the translation of TE-encoded proteins or transcripts may be costly and these proteins/transcripts might generate deleterious effects by nicking chromosomes and disrupting cellular processes (Nuzhdin 1999). To test this hypothesis, we compared the frequencies of full-length TEs versus near-full length TEs (>90% of the length of the canonical element). We hypothesized that full-length elements are transcribed either more often or at higher levels than the near-full length but truncated TEs. We restricted our analysis to the TE families in our data set that have been identified as being transcribed (Deloger et al. 2009). We found no evidence of selection against the expression of TE-encoded products when we considered all the families together (G-test = 3.99, P value = 0.14) or separately (supplementary table S6, Supplementary Material online).
Natural Selection against TEs Due to Ectopic Recombination
Another possibility is that many TEs are deleterious because they recombine with other TEs located at various sites across the genome leading to rearranged chromosomes and inviable gametes (ectopic recombination model). This model makes a number of testable predictions. First, because ectopic recombination events are more likely when TEs are heterozygous, selection against the deleterious effects of ectopic recombination should increase with the copy number of polymorphic TEs (Montgomery et al. 1987, 1991). Second, because longer elements should recombine more often (Dray and Gloor 1997), the longer TEs especially in the families that contain many other long TEs should be subject to stronger purifying selection and present at low population frequencies (Petrov et al. 2003). Finally, purifying selection should be stronger in the areas of higher recombination (Langley et al. 1988; Montgomery et al. 1991; Goldman and Lichten 1996, 2000). To test these predictions, we analyzed 637 out of the 755 TEs that are not fixed and are not located on the fourth chromosome.
As predicted, TE frequency varies significantly and negatively with the polymorphic copy number of the family (P value << 0.001; table 2 and fig. 2). The other two predictions also hold: Both the TE length and the recombination rate correlate significantly and negatively with the TE frequency (P value << 0.001; table 2 and fig. 2). In addition, we detected a statistical interaction between TE length and polymorphic copy number (table 2). These results vary among orders (table 2). The frequencies of TEs within LTR and non-LTR orders are significantly correlated with polymorphic copy number and TE length. However, recombination rate is a significant correlate only for the LTR elements. On the other hand, none of the three factors are significant predictors of TE frequencies for TIR elements. Bootstrap analysis shows that the different order behaviors were not due to the different number of TEs analyzed in each order (supplementary table S7, Supplementary Material online). Finally, eliminating solo-LTRs (28 TEs) from our data set did not qualitatively alter any of these results (data not shown).
Table 2.
Relationship Between TE Length, Recombination (rcb) Rate and Polymorphic (poly) Copy Number with TE Frequencies.
| Linear Regression Analysis: Frequency ∼ TE Length * Rcb Rate * Poly Copy Number | All the TEs |
LTR |
Non-LTR |
TIR |
|||||
| Coefficient | P Value | Coefficient | P Value | Coefficient | P Value | Coefficient | P Value | ||
| Frequency ∼ | Poly copy number | −1.50 × 10−02 | 3.65 × 10⁻¹¹*** | −8.65 × 10−03 | 1.58 × 10−04*** | −2.80 × 10−02 | 1.06 × 10−05*** | −2.97 × 10−02 | 0.076 |
| TE length | −1.62 × 10−04 | <2 × 10⁻¹⁶*** | −1.48 × 10−04 | 1.95 × 10−09*** | −2.06 × 10−04 | 3.16 × 10−04*** | 1.07 × 10−05 | 0.92 | |
| Rcb rate | −1.12 × 10−01 | 9.71 × 10−04*** | −1.85 × 10−01 | 5.14 × 10−04*** | −1.16 × 10−01 | 0.17 | 5.95 × 10−02 | 0.82 | |
| TE length: rcb rate | 1.37 × 10−06 | 0.82 | 1.68 × 10−05 | 0.047 | −1.73 × 10−06 | 0.92 | −1.25 × 10−04 | 0.31 | |
| Rcb rate: poly copy number | 1.35 × 10−03 | 0.058 | 3.81 × 10−04 | 0.55 | 3.21 × 10−03 | 0.11 | −8.60 × 10−04 | 0.91 | |
| TE length: poly copy number | 1.60 × 10−06 | 1.13 × 10−08*** | 1.05 × 10−06 | 4.78 × 10−04*** | 3.00 × 10−06 | 0.035* | 1.08 × 10−05 | 0.18 | |
P < 0.05
P < 0.001
FIG. 2.

Frequency distribution of all the TEs, LTR, non-LTR, and TIR by local recombination rate where the TE is inserted (A), TE length (B), and polymorphic copy number (C).
We also confirmed that TEs from families with longer TEs were indeed less frequent when we used the observed mean length (Spearman’s ρ = −0.61, P value << 0.001) or the length of the canonical TE in each family (Spearman’s ρ = −0.49, P value << 0.001) as the correlates. Longer TEs were also present at lower frequencies within each family. Although copy numbers of TEs within families are generally too low to detect this relationship within individual families, the distribution of Spearman’s correlation coefficients across all families was significantly shifted toward negative values (Student test: t = 10.31, df = 30, P value << 0.001). Finally, we tested whether within each family the effects of polymorphic copy number, TE length, and recombination rate on TE frequencies exerted independent effects on the TE frequency and we found that this was indeed the case (supplementary table S8, Supplementary Material online).
TE Frequency Distribution Across TE Families
All the correlations that we described above and which are predicted by the ectopic recombination model could also be due to the independent deleterious effects exerted by TEs on neighboring genes. In order for this alternative model to work, longer TEs need to exert stronger deleterious effects on neighboring genes, which may or may not be the case. In addition, the lengths of TEs within families need to correlate with each other and the TE families with higher copy numbers also need to contain longer TEs. These patterns do hold for the Drosophila TEs (R2 = 0.60; P value << 0.001; Spearman’s ρ = 0.21, P value = 0.02), making the model of stronger deleterious effects of longer TEs on neighboring genes a viable alternative for the patterns presented so far.
If the observed differences in TE frequencies are indeed due to the independent deleterious effects exerted by individual TEs on neighboring genes, TEs of similar length and in similar recombination backgrounds should experience similar strengths of selection independently of their family identity. On the ectopic recombination model, in contrast, the family identity should carry much information about the deleterious effects of particular TEs. In order to test these predictions, we developed a permutation-based approach in which we compared population frequencies of pairs of TEs matched by length and recombination rate but which differed in their family and/or order identity (supplementary table S9, Supplementary Material online). We found that two TEs within the same family were significantly more likely to have similar frequencies over and above that predicted by their lengths or their local recombination rates compared with TEs in different families (Sign test: S = 92, P << 0.001). This was true even if the TEs in different families belonged to the same order indicating the dominant effect of family identity over and above that of a order (Sign test: S = 79, P value << 0.001). Finally, TEs within orders do not have more similar frequencies independently of their family identity (Sign test: S = 155, P value = 0.14) except for LTR elements (Sign test: S = 52, P value << 0.001). This indicates that LTR families as a group behave more consistently compared with TE families in other orders.
Building Statistical Models to Explain the Variation in TE Frequencies
We built several statistical models to explain variation of the population frequencies of TEs in D. melanogaster (table 3). We used individual TE-level parameters (TE length and recombination rate), family-level parameters (polymorphic and fixed copy numbers) as well as distance to closest gene, family, and order identities. The copy numbers of fixed TEs were included because they carry information about the recent probability of fixation and thus recent strength of purifying selection acting on TEs in a particular family. This is because the high rate of DNA loss in Drosophila leads to a very short timeframe in which TEs can be detected after their fixation (Petrov et al. 1996; Petrov and Hartl 1998). Indeed, the copy number of fixed TEs appeared to exert an independent statistical effect on population frequency of other TEs in the family (supplementary table S10, Supplementary Material online). We used both an “add” and a “drop” approach and confirmed that all these parameters contained information about TE frequencies except that we found that distance to the closest gene and order identity did not provide independent explanatory power (supplementary table S11, Supplementary Material online). We further tested whether location on the X chromosome versus autosomes carries any explanatory power in this analysis and failed to detect significance in either the drop or add analyses (supplementary table S11, Supplementary Material online).
Table 3.
Comparison of the ANOVA Models Using the AIC.
| ANOVA Models | AIC Values |
||||
| All | LTR | Non-LTR | TIR | ||
| A | Frequency ∼ TE length + rcba rate | 1,164 | 432 | 434 | 203 |
| B | Frequency ∼ model A + family | 905 | 299 | 341 | 183 |
| C | Frequency ∼ model A + order | 1,156 | N/A | N/A | N/A |
| D | Frequency ∼ model B + distance to closest gene | 907 | 300 | 342 | 183 |
| E | Frequency ∼ TE length + rcb rate + mean TE length + canonical TE length + polyb copy number + fixed copy number + TE length:fixed copy number + TE length:poly copy number + mean TE length:fixed copy number + TE length:poly copy number + canonical TE length:fixed copy number + canonical TE length:poly copy number | 1,003 | 353 | 357 | 178 |
| E' | Frequency ∼ TE length + rcb rate + mean TE length + canonical TE length + poly copy number + fixed copy number + TE length:fixed copy number + mean TE length:fixed copy number + canonical TE length:fixed copy number + canonical TE length:poly copy number | 1,001 | 352 | 355 | 177 |
| F | Model E′ + order | 1,000 | N/A | N/A | N/A |
Recombination.
Polymorphic.
We used a stepwise selection procedure with the Akaike’s information criterion (AIC) to select the model that best explained the variation in TE frequencies (Akaike 1974). The results are shown in table 3 and figure 3. We started with a model A that considered only individual TE properties—length and recombination rate. This model explained a substantial part of variance (R2 = 0.23; AIC value = 1,164). We then added to this model either the family effect (model B: R2 = 0.56; AIC value = 905) or the order effect (model C: R2 = 0.25; AIC value = 1,156). As expected based on our previous results, while adding the family effect improved the explanatory power very substantially, adding the order effect improved it only marginally. Adding distance to closest gene to model B does not increase the explanatory power of the model (model D: R2 = 0.56; AIC value = 907) confirming that distance to closest gene does not play an important role in explaining TE population dynamics.
FIG. 3.

Comparison of the predicted TE frequencies according to models A, B, C, and E′ and the observed TE frequencies. For each observed frequency class, we plot the observed versus the predicted frequencies according to that model for each of the 637 TEs and the boxplot summarizing the frequencies distribution. We also plot the observed versus the predicted frequencies for the 13 adaptive TEs described in González et al. (2008).
We then attempted to determine which of the family properties mattered most. We built a model that added to model A all the family-level parameters (model E). Even all these parameters together (model E: R2 = 0.42; AIC value = 1003) did not have as much explanatory power as model B that explicitly included the family identity as a parameter. This is true for both LTR and non-LTR orders, whereas model E was marginally better than model B for the TIR order.
We then used a stepwise approach analysis in order to minimize the number of parameters in model E while maximizing its explanatory power. This new model, model E′ (R2 = 0.42; AIC value = 1,001) marginally increased the explanatory power over model E. Finally, we added order identity to model E′ to test whether TEs from different orders behave differently after the individual TE-level and family-level properties have been taken into account. This appears not to be the case: Adding order identity to E′ did not significantly increase the explanatory power of the model (model F: R2 = 0.43; AIC value = 1,000).
We also plotted the predicted versus observed frequencies for the 13 putatively adaptive TEs previously identified in our laboratory (fig. 3). These 13 TEs are common in NA populations (González et al. 2008). As expected, because they are likely to be subject to positive selection and thus should be unusually frequent in the population, our two best models predicted their frequencies to be lower than they really are (model B: Student test t = −3.71, df = 14, P value < 0.001 and model E′: Student test t = 2.50, df = 12.4, P value = 0.03; fig. 3).
Discussion
In this work, we analyzed the population frequencies of a large proportion of euchromatic non-nested TEs found in the reference D. melanogaster strain which is considered a “typical” D. melanogaster strain in terms of its TE composition (Kaminker et al. 2002; Quesneville et al. 2005). These TEs came from 55 families and were sampled across lengths and recombination backgrounds (supplementary table S1, Supplementary Material online). We excluded INE-1 because these TEs have been inactive for the past ∼3 my and thus do not provide us with information about TE dynamics in the modern populations (Kapitonov and Jurka 2003; Singh and Petrov 2004). We also excluded nested TEs partly because of the difficulty of analysis and partly because these TEs were likely to be older as a group and less representative of the current TE population dynamics in D. melanogaster as well. Finally, we did not consider heterochromatic TEs because heterochromatic TEs tend to be old, fixed, fragmented, and/or nested (Hoskins et al. 2007; Smith et al. 2007) and we expected much higher rate of PCR error for such TEs. In the future, a separate analysis of heterochromatic TEs should be profitable especially for the understanding of long-term TE dynamics.
The study of TEs across a large number of TE families from all Drosophila orders allowed us to determine that consistent forces affect TEs independently of their modes of transposition and regulation. This is important because most of the current understanding of TEs in Drosophila came by extrapolation from studies carried out on very few families with possibly idiosyncratic properties (Montgomery et al. 1987; Biemont et al. 1994; Carr et al. 2002; Petrov et al. 2003).
First, Drosophila TEs appear to be very strongly deleterious when they disrupt protein-coding sequences of genes as we found no such TEs in our data set. The only exception is a previously discovered adaptive TE that generated a new protein-coding gene (Aminetzach et al. 2005). It is highly unlikely that this is due to the preference of TEs to insert outside of genes because this would have to hold for all the TE families and is inconsistent with experimental data of TEs readily inserting into genes in hybrid dysgenesis in Drosophila (Kidwell et al. 1977; Petrov et al. 1995) and with the abundance of TE-derived visible mutations (Ashburner et al. 2005). Note that some insertions of TEs into genes have not yet been properly annotated (e.g., FBti0019430 insertion into CHKov1 was mis-annotated originally; Aminetzach et al. 2005) given that most gene prediction algorithms assume that genes are not interrupted by TEs (Burge and Karlin 1997; Salamov and Solovyev 2000). However, it is unlikely that this problem is of sufficient magnitude to account for the complete absence of TEs inside genes in our data.
Beyond this strong exclusion of TEs from protein-coding regions, we found that TE frequency is not detectably or consistently a function of insertion of a TE into introns versus intergenic regions or of the distance of a TE insertion to a gene. It appears that those TEs that do disrupt genes are undetectable, whereas the ones that are present at detectable frequencies exert too weak an effect on neighboring genes for this effect to be determinative.
Instead, all our results agree with the hypothesis that the variation of TE frequencies is due to the varying strength of purifying selection acting on TEs due to their propensity to recombine with other TEs within the same family and cause inviable chromosomal rearrangements. We demonstrate that TEs that are longer, that are found in high recombination areas and, most importantly, belong to families that have high copy numbers of long TEs are subject to stronger purifying selection and are present at lower frequencies. Using only these TE-level and family-level parameters and ignoring all other properties of TEs such as, for instance, their mode of transposition, we can account for a large proportion of the variation in TE frequency (R2 = 0.42). Other factors such as repression of TE activity by PIWI-interacting RNAs do certainly play a role in the population dynamics of TEs (Aravin et al. 2001; Brennecke et al. 2007; Slotkin and Martienssen 2007; Lu and Clark 2010). The impact of piRNAs on the population dynamics of TEs is expected to be greater for TEs that produce piRNAs than for TEs that are targeted by piRNAs (Lu and Clark 2010). Because most of the TEs that generate piRNAs are not included in our analysis (because practically all piRNA loci are TE clusters located in heterochromatic regions and both have been excluded from our analysis; Brennecke et al. 2007), the impact of piRNAs should be diminished. Furthermore, we tested whether full-length, potentially transcribed, and piRNA-affected TEs showed different population dynamics from truncated, likely untranscribed, and piRNA-unaffected TEs in the same families and failed to find any differences (P value = 0.14; supplementary table S6, Supplementary Material online). Although it is not clear whether only full-length copies are transcribed, and therefore subject to piRNA control, this comparison suggests that piRNA control is unlikely to be determinative in our analysis. Overall, it appears that regulation at the level of piRNA or transcription in general explains at most a minor part of the TE frequency variation in D. melanogaster.
The picture that is starting to emerge is that different TE families exhibit sharply varying rates of transposition. The ones that transpose very frequently build up large copy numbers leading to the concomitant increase in the strength of purifying selection against new TE insertions because new TEs in these families can recombine with a large number of other TEs with very similar DNA sequences. Such families contain large numbers of young and rare TEs. Other families transpose infrequently such that the copy numbers are lower and the individual TEs are older and more frequent in the population. Interestingly, LTR families appear to be transposing in the D. melanogaster genome at higher rates than TEs from other orders leading to the observation that LTR elements as a group tend to be younger (Bergman and Bensasson 2007). Our results do not provide any evidence that this pattern requires any nonequilibrium explanations such as a sudden burst of LTR-element transposition in the recent past. We consider that this alternative nonequilibrium explanation is not very likely because it requires a coordinate and recent invasion of all LTR families into the D. melanogaster genome in contrast to lack of such invasion for the majority of other families. We know of no evidence that would indicate that such a scenario is plausible.
One way these inferences can be tested is by investigating TE presence in very deep population samples. The quantities of very rare polymorphisms in a sample can provide us with very precise estimates of the rate of transposition in a way that does not depend strongly on the strength of purifying selection (Messer 2009). Current sequencing projects of a large set of D. melanogaster strains should facilitate this analysis (http://www.hgsc.bcm.tmc.edu).
If this model is true, one key question that remains is why different families transpose as such different rates. It could be a function of the active TEs currently present in the genome or of the family-specific and/or species-specific regulatory mechanisms (e.g., piRNA control pathways; Lu and Clark 2010; Malone and Hannon 2009). It will be interesting to determine whether families tend to go through periods of active transposition followed by periods of quiescence or whether they tend to maintain differing rates of transposition for a long time (Nuzhdin 1999; Petrov et al. 2003). In principle, one could attempt to get this information from the analysis of the fixed TEs in the genome that could tell us about rates of TE fixations over evolutionary past. Unfortunately, it seems likely that fixed elements have a relatively short persistence time in the genome because they tend to be quickly removed by frequent small deletions in Drosophila (Petrov et al. 1996; Petrov and Hartl 1998; Singh and Petrov 2004). The other possibility is to investigate population genomics of TEs in other species (Vieira and Biemont 2004; Rebollo et al. 2008; de la Chaux and Wagner 2009; Granzotto et al. 2009). Especially, interesting will be the comparison of TE dynamics in species that differ in breeding system because those species are also expected to differ in effective population size and in the efficacy of selection (Charlesworth D and Charlesworth B 1995; Wright and Schoen 1999; Dolgin et al. 2008; Lockton and Gaut 2010). The comparison of TE dynamics in different species holds the most promise in elucidating not only why different families transpose as such different rates but also in determining the generality of the lessons learned in D. melanogaster. This approach at the moment is limited by the availability of fully sequenced genomes with sequenced and annotated TE fractions. However, with the decline in sequencing costs, we may expect in the very near future an exponential increase in the amount of sequencing data for many model and even nonmodel organisms. Automated annotation of TEs (Quesneville et al. 2005) and automated assessment of TE frequencies in the population from multiple resequenced strains (Hormozdiari et al. 2010; Fiston-Lavier et al. 2010b) will allow the field to carry out high-throughput population genomics of TEs in multiple species and gain deep understanding of the forces affecting maintenance of TEs in eukaryotic genomes.
Supplementary Material
Supplementary figures S1–S3 and tables S1–S11 are available at Molecular Biology and Evolution online (http://www.mbe.oxforjournals.com.org).
Acknowledgments
We thank D. Begun, J. Birdsley, G. Gibson, B. Harr, S. Nuzhdin, and L. Yampolsky for providing flies and R. Hershberg, A. Ruiz, D. Sellis, C. Vieira, all members of the Petrov Lab, and the anonymous reviewers for comments on the manuscript. This work was supported by the National Institutes of Health (grant numbers GM 077368 and GM089926) and by National Science Foundation (grant number 0317171) to D.A.P.
References
- Akaike H. A new look at statistical model identification. IEEE Trans Automat Contr. 1974;19:716–723. [Google Scholar]
- Aminetzach YT, Macpherson JM, Petrov DA. Pesticide resistance via transposition-mediated adaptive gene truncation in Drosophila. Science. 2005;309:764–767. doi: 10.1126/science.1112699. [DOI] [PubMed] [Google Scholar]
- Aravin AA, Naumova NM, Tulin AV, Vagin VV, Rozovsky YM, Gvozdev VA. Double-stranded RNA-mediated silencing of genomic tandem repeats and transposable elements in the D. melanogaster germline. Curr Biol. 2001;11:1017–1027. doi: 10.1016/s0960-9822(01)00299-8. [DOI] [PubMed] [Google Scholar]
- Ashburner M, Golic KG, Hawley RS. Drosophila: a laboratory handbook. New York: Cold Spring Harbour Laboratoy Press; 2005. [Google Scholar]
- Bartolome C, Maside X, Charlesworth B. On the abundance and distribution of transposable elements in the genome of Drosophila melanogaster. Mol Biol Evol. 2002;19:926–937. doi: 10.1093/oxfordjournals.molbev.a004150. [DOI] [PubMed] [Google Scholar]
- Bergman CM, Bensasson D. Recent LTR retrotransposon insertion contrasts with waves of non-LTR insertion since speciation in Drosophila melanogaster. Proc Natl Acad Sci U S A. 2007;104:11340–11345. doi: 10.1073/pnas.0702552104. [DOI] [PMC free article] [PubMed] [Google Scholar]
- Berry AJ, Ajioka JW, Kreitman M. Lack of polymorphism on the Drosophila fourth chromosome resulting from selection. Genetics. 1991;129:1111–1117. doi: 10.1093/genetics/129.4.1111. [DOI] [PMC free article] [PubMed] [Google Scholar]
- Biemont C, Lemeunier F, Garcia Guerreiro MP, Brookfield JF, Gautier C, Aulard S, Pasyukova EG. Population dynamics of the copia, mdg1, mdg3, gypsy, and P transposable elements in a natural population of Drosophila melanogaster. Genet Res. 1994;63:197–212. doi: 10.1017/s0016672300032353. [DOI] [PubMed] [Google Scholar]
- Biemont C, Vieira C. Genetics: junk DNA as an evolutionary force. Nature. 2006;443:521–524. doi: 10.1038/443521a. [DOI] [PubMed] [Google Scholar]
- Bourque G. Transposable elements in gene regulation and in the evolution of vertebrate genomes. Curr Opin Genet Dev. 2009;19:607–612. doi: 10.1016/j.gde.2009.10.013. [DOI] [PubMed] [Google Scholar]
- Brennecke J, Aravin AA, Stark A, Dus M, Kellis M, Sachidanandam R, Hannon GJ. Discrete small RNA-generating loci as master regulators of transposon activity in Drosophila. Cell. 2007;128:1089–1103. doi: 10.1016/j.cell.2007.01.043. [DOI] [PubMed] [Google Scholar]
- Burge C, Karlin S. Prediction of complete gene structures in human genomic DNA. J Mol Biol. 1997;268:78–94. doi: 10.1006/jmbi.1997.0951. [DOI] [PubMed] [Google Scholar]
- Carr M, Soloway JR, Robinson TE, Brookfield JF. Mechanisms regulating the copy numbers of six LTR retrotransposons in the genome of Drosophila melanogaster. Chromosoma. 2002;110:511–518. doi: 10.1007/s00412-001-0174-0. [DOI] [PubMed] [Google Scholar]
- Charlesworth B, Langley CH. The population genetics of Drosophila transposable elements. Annu Rev Genet. 1989;23:251–287. doi: 10.1146/annurev.ge.23.120189.001343. [DOI] [PubMed] [Google Scholar]
- Charlesworth B, Lapid A, Canada D. The distribution of transposable elements within and between chromosomes in a population of Drosophila melanogaster. II. Inferences on the nature of selection against elements. Genet Res. 1992;60:115–130. doi: 10.1017/s0016672300030809. [DOI] [PubMed] [Google Scholar]
- Charlesworth B, Sniegowski P, Stephan W. The evolutionary dynamics of repetitive DNA in eukaryotes. Nature. 1994;371:215–220. doi: 10.1038/371215a0. [DOI] [PubMed] [Google Scholar]
- Charlesworth D, Charlesworth B. Transposable elements in inbreeding and outbreeding populations. Genetics. 1995;140:415–417. doi: 10.1093/genetics/140.1.415. [DOI] [PMC free article] [PubMed] [Google Scholar]
- Craig NL, Craigie R, Gellert M, Lambowitz AM. Mobile DNA II. Washington (DC): ASM Press; 2002. [Google Scholar]
- de la Chaux N, Wagner A. Evolutionary dynamics of the LTR retrotransposons roo and rooA inferred from twelve complete Drosophila genomes. BMC Evol Biol. 2009;9:205. doi: 10.1186/1471-2148-9-205. [DOI] [PMC free article] [PubMed] [Google Scholar]
- Deloger M, Cavalli FM, Lerat E, Biemont C, Sagot MF, Vieira C. Identification of expressed transposable element insertions in the sequenced genome of Drosophila melanogaster. Gene. 2009;439:55–62. doi: 10.1016/j.gene.2009.03.015. [DOI] [PubMed] [Google Scholar]
- Dolgin ES, Charlesworth B. The effects of recombination rate on the distribution and abundance of transposable elements. Genetics. 2008;178:2169–2177. doi: 10.1534/genetics.107.082743. [DOI] [PMC free article] [PubMed] [Google Scholar]
- Dolgin ES, Charlesworth B, Cutter AD. Population frequencies of transposable elements in selfing and outcrossing Caenorhabditis nematodes. Genet Res. 2008;90:317–329. doi: 10.1017/S0016672308009440. [DOI] [PubMed] [Google Scholar]
- Dray T, Gloor GB. Homology requirements for targeting heterologous sequences during P-induced gap repair in Drosophila melanogaster. Genetics. 1997;147:689–699. doi: 10.1093/genetics/147.2.689. [DOI] [PMC free article] [PubMed] [Google Scholar]
- Feschotte C. Transposable elements and the evolution of regulatory networks. Nat Rev Genet. 2008;9:397–405. doi: 10.1038/nrg2337. [DOI] [PMC free article] [PubMed] [Google Scholar]
- Finnegan DJ. Transposable elements. Curr Opin Genet Dev. 1992;2:861–867. doi: 10.1016/s0959-437x(05)80108-x. [DOI] [PubMed] [Google Scholar]
- Fiston-Lavier AS, Singh ND, Lipatov M, Petrov DA. Drosophila melanogaster recombination rate calculator. Gene. 2010a;463:18–20. doi: 10.1016/j.gene.2010.04.015. [DOI] [PubMed] [Google Scholar]
- Fiston-Lavier AS, Carrigan M, Petrov DA, González J Forthcoming. T-lex: a program for fast and accurate assessment of transposable element presence using next-genertion sequencing data. Nucleic Acids Res. 2010b doi: 10.1093/nar/gkq1291. doi:10.1093/nar/gk. [DOI] [PMC free article] [PubMed] [Google Scholar]
- Goldman AS, Lichten M. The efficiency of meiotic recombination between dispersed sequences in Saccharomyces cerevisiae depends upon their chromosomal location. Genetics. 1996;144:43–55. doi: 10.1093/genetics/144.1.43. [DOI] [PMC free article] [PubMed] [Google Scholar]
- Goldman AS, Lichten M. Restriction of ectopic recombination by interhomolog interactions during Saccharomyces cerevisiae meiosis. Proc Natl Acad Sci U S A. 2000;97:9537–9542. doi: 10.1073/pnas.97.17.9537. [DOI] [PMC free article] [PubMed] [Google Scholar]
- González J, Karasov TL, Messer PW, Petrov DA. Genome-wide patterns of adaptation to temperate environments associated with transposable elements in Drosophila. PLoS Genet. 2010;6:e1000905. doi: 10.1371/journal.pgen.1000905. [DOI] [PMC free article] [PubMed] [Google Scholar]
- González J, Lenkov K, Lipatov M, Macpherson JM, Petrov DA. High rate of recent transposable element-induced adaptation in Drosophila melanogaster. PLoS Biol. 2008;6:e251. doi: 10.1371/journal.pbio.0060251. [DOI] [PMC free article] [PubMed] [Google Scholar]
- González J, Macpherson JM, Petrov DA. A recent adaptive transposable element insertion near highly conserved developmental loci in Drosophila melanogaster. Mol Biol Evol. 2009;26:1949–1961. doi: 10.1093/molbev/msp107. [DOI] [PMC free article] [PubMed] [Google Scholar]
- González J, Petrov DA. The adaptive role of transposable elements in the Drosophila genome. Gene. 2009;448:124–133. doi: 10.1016/j.gene.2009.06.008. [DOI] [PMC free article] [PubMed] [Google Scholar]
- Granzotto A, Lopes FR, Lerat E, Vieira C, Carareto CM. The evolutionary dynamics of the Helena retrotransposon revealed by sequenced Drosophila genomes. BMC Evol Biol. 2009;9:174. doi: 10.1186/1471-2148-9-174. [DOI] [PMC free article] [PubMed] [Google Scholar]
- Hormozdiari F, Hajirasouliha I, Dao P, Hach F, Yorukoglu D, Alkan C, Eichler EE, Sahinalp SC. Next-generation VariantionHunter: combinatorial algorithms for transposon insertion discovery. Bioinformatics. 2010;26:i350–i357. doi: 10.1093/bioinformatics/btq216. [DOI] [PMC free article] [PubMed] [Google Scholar]
- Hoskins RA, Carlson JW, Kennedy C, et al. (14 co-authors) Sequence finishing and mapping of Drosophila melanogaster heterochromatin. Science. 2007;316:1625–1628. doi: 10.1126/science.1139816. [DOI] [PMC free article] [PubMed] [Google Scholar]
- Kaminker JS, Bergman CM, Kronmiller B, et al. (12 co-authors) The transposable elements of the Drosophila melanogaster euchromatin: a genomics perspective. Genome Biol. 2002;3:RESEARCH0084. doi: 10.1186/gb-2002-3-12-research0084. [DOI] [PMC free article] [PubMed] [Google Scholar]
- Kapitonov VV, Jurka J. Molecular paleontology of transposable elements in the Drosophila melanogaster genome. Proc Natl Acad Sci U S A. 2003;100:6569–6574. doi: 10.1073/pnas.0732024100. [DOI] [PMC free article] [PubMed] [Google Scholar]
- Kidwell MG, Kidwell JF, Sved JA. Hybrid dysgenesis in Drosophila melanogaster: a syndrome of aberrant traits including mutation, sterility and male recombination. Genetics. 1977;86:813–833. doi: 10.1093/genetics/86.4.813. [DOI] [PMC free article] [PubMed] [Google Scholar]
- Kidwell MG, Lisch DR. Perspective: transposable elements, parasitic DNA, and genome evolution. Evolution. 2001;55:1–24. doi: 10.1111/j.0014-3820.2001.tb01268.x. [DOI] [PubMed] [Google Scholar]
- Langley CH, Montgomery E, Hudson R, Kaplan N, Charlesworth B. On the role of unequal exchange in the containment of transposable element copy number. Genet Res. 1988;52:223–235. doi: 10.1017/s0016672300027695. [DOI] [PubMed] [Google Scholar]
- Le Rouzic A, Boutin TS, Capy P. Long-term evolution of transposable elements. Proc Natl Acad Sci U S A. 2007;104:19375–19380. doi: 10.1073/pnas.0705238104. [DOI] [PMC free article] [PubMed] [Google Scholar]
- Le Rouzic A, Deceliere G. Models of the population genetics of transposable elements. Genet Res. 2005;85:171–181. doi: 10.1017/S0016672305007585. [DOI] [PubMed] [Google Scholar]
- Lipatov M, Lenkov K, Petrov DA, Bergman CM. Paucity of chimeric gene-transposable element transcripts in the Drosophila melanogaster genome. BMC Biol. 2005;3:24. doi: 10.1186/1741-7007-3-24. [DOI] [PMC free article] [PubMed] [Google Scholar]
- Lockton S, Gaut BS. The evolution of transposable elements in natural populations of self-fertilizing Arabidopsis thaliana and its outcrossing relative Arabidopsis lyrata. BMC Evol Biol. 2010;10:10. doi: 10.1186/1471-2148-10-10. [DOI] [PMC free article] [PubMed] [Google Scholar]
- Lockton S, Ross-Ibarra J, Gaut BS. Demography and weak selection drive patterns of transposable element diversity in natural populations of Arabidopsis lyrata. Proc Natl Acad Sci U S A. 2008;105:13965–13970. doi: 10.1073/pnas.0804671105. [DOI] [PMC free article] [PubMed] [Google Scholar]
- Lu J, Clark AG. Population dynamics of PIWI-interacting RNAs (piRNAs) and their targets in Drosophila. Genome Res. 2010;20:212–227. doi: 10.1101/gr.095406.109. [DOI] [PMC free article] [PubMed] [Google Scholar]
- Malone CD, Hannon GJ. Molecular evolution of piRNA and transposon control pathways in Drosophila. Cold Spring Harb Symp Quant Biol. 2009;74:225–234. doi: 10.1101/sqb.2009.74.052. [DOI] [PMC free article] [PubMed] [Google Scholar]
- McDonald JF, Matyunina LV, Wilson S, Jordan IK, Bowen NJ, Miller WJ. LTR retrotransposons and the evolution of eukaryotic enhancers. Genetica. 1997;100:3–13. [PubMed] [Google Scholar]
- Messer PW. Measuring the rates of spontaneous mutation from deep and large-scale polymorphism data. Genetics. 2009;182:1219–1232. doi: 10.1534/genetics.109.105692. [DOI] [PMC free article] [PubMed] [Google Scholar]
- Misra S, Rio DC. Cytotype control of Drosophila P element transposition: the 66 kd protein is a repressor of transposase activity. Cell. 1990;62:269–284. doi: 10.1016/0092-8674(90)90365-l. [DOI] [PubMed] [Google Scholar]
- Montgomery E, Charlesworth B, Langley CH. A test for the role of natural selection in the stabilization of transposable element copy number in a population of Drosophila melanogaster. Genet Res. 1987;49:31–41. doi: 10.1017/s0016672300026707. [DOI] [PubMed] [Google Scholar]
- Montgomery EA, Huang SM, Langley CH, Judd BH. Chromosome rearrangement by ectopic recombination in Drosophila melanogaster: genome structure and evolution. Genetics. 1991;129:1085–1098. doi: 10.1093/genetics/129.4.1085. [DOI] [PMC free article] [PubMed] [Google Scholar]
- Nuzhdin SV. Sure facts, speculations, and open questions about the evolution of transposable element copy number. Genetica. 1999;107:129–137. [PubMed] [Google Scholar]
- Nuzhdin SV, Pasyukova EG, Mackay TF. Accumulation of transposable elements in laboratory lines of Drosophila melanogaster. Genetica. 1997;100:167–175. [PubMed] [Google Scholar]
- Petrov DA, Aminetzach YT, Davis JC, Bensasson D, Hirsh AE. Size matters: non-LTR retrotransposable elements and ectopic recombination in Drosophila. Mol Biol Evol. 2003;20:880–892. doi: 10.1093/molbev/msg102. [DOI] [PubMed] [Google Scholar]
- Petrov DA, Hartl DL. High rate of DNA loss in the Drosophila melanogaster and Drosophila virilis species groups. Mol Biol Evol. 1998;15:293–302. doi: 10.1093/oxfordjournals.molbev.a025926. [DOI] [PubMed] [Google Scholar]
- Petrov DA, Lozovskaya ER, Hartl DL. High intrinsic rate of DNA loss in Drosophila. Nature. 1996;384:346–349. doi: 10.1038/384346a0. [DOI] [PubMed] [Google Scholar]
- Petrov DA, Schutzman JL, Hartl DL, Lozovskaya ER. Diverse transposable elements are mobilized in hybrid dysgenesis in Drosophila virilis. Proc Natl Acad Sci U S A. 1995;92:8050–8054. doi: 10.1073/pnas.92.17.8050. [DOI] [PMC free article] [PubMed] [Google Scholar]
- Quesneville H, Bergman CM, Andrieu O, Autard D, Nouaud D, Ashburner M, Anxolabehere D. Combined evidence annotation of transposable elements in genome sequences. PLoS Comput Biol. 2005;1:166–175. doi: 10.1371/journal.pcbi.0010022. [DOI] [PMC free article] [PubMed] [Google Scholar]
- Rebollo R, Lerat E, Kleine LL, Biemont C, Vieira C. Losing helena: the extinction of a drosophila line-like element. BMC Genomics. 2008;9:149. doi: 10.1186/1471-2164-9-149. [DOI] [PMC free article] [PubMed] [Google Scholar]
- Rizzon C, Martin E, Marais G, Duret L, Segalat L, Biemont C. Patterns of selection against transposons inferred from the distribution of Tc1, Tc3 and Tc5 insertions in the mut-7 line of the nematode Caenorhabditis elegans. Genetics. 2003;165:1127–1135. doi: 10.1093/genetics/165.3.1127. [DOI] [PMC free article] [PubMed] [Google Scholar]
- Salamov AA, Solovyev VV. Ab initio gene finding in Drosophila genomic DNA. Genome Res. 2000;10:516–522. doi: 10.1101/gr.10.4.516. [DOI] [PMC free article] [PubMed] [Google Scholar]
- Sandmeyer SB, Hansen LJ, Chalker DL. Integration specificity of retrotransposons and retroviruses. Annu Rev Genet. 1990;24:491–518. doi: 10.1146/annurev.ge.24.120190.002423. [DOI] [PubMed] [Google Scholar]
- Singh ND, Petrov DA. Rapid sequence turnover at an intergenic locus in Drosophila. Mol Biol Evol. 2004;21:670–680. doi: 10.1093/molbev/msh060. [DOI] [PubMed] [Google Scholar]
- Sinzelle L, Izsvak Z, Ivics Z. Molecular domestication of transposable elements: from detrimental parasites to useful host genes. Cell Mol Life Sci. 2009;66:1073–1093. doi: 10.1007/s00018-009-8376-3. [DOI] [PMC free article] [PubMed] [Google Scholar]
- Slotkin RK, Martienssen R. Transposable elements and the epigenetic regulation of the genome. Nat Rev Genet. 2007;8:272–285. doi: 10.1038/nrg2072. [DOI] [PubMed] [Google Scholar]
- Smith CD, Shu S, Mungall CJ, Karpen GH. The Release 5.1 annotation of Drosophila melanogaster heterochromatin. Science. 2007;316:1586–1591. doi: 10.1126/science.1139815. [DOI] [PMC free article] [PubMed] [Google Scholar]
- Spradling AC, Stern DM, Kiss I, Roote J, Laverty T, Rubin GM. Gene disruptions using P transposable elements: an integral component of the Drosophila genome project. Proc Natl Acad Sci U S A. 1995;92:10824–10830. doi: 10.1073/pnas.92.24.10824. [DOI] [PMC free article] [PubMed] [Google Scholar]
- Tian Z, Rizzon C, Du J, Zhu L, Bennetzen JL, Jackson SA, Gaut BS, Ma J. Do genetic recombination and gene density shape the pattern of DNA elimination in rice long terminal repeat retrotransposons? Genome Res. 2009;19:2221–2230. doi: 10.1101/gr.083899.108. [DOI] [PMC free article] [PubMed] [Google Scholar]
- Vieira C, Biemont C. Transposable element dynamics in two sibling species: Drosophila melanogaster and Drosophila simulans. Genetica. 2004;120:115–123. doi: 10.1023/b:gene.0000017635.34955.b5. [DOI] [PubMed] [Google Scholar]
- Volff JN. Turning junk into gold: domestication of transposable elements and the creation of new genes in eukaryotes. Bioessays. 2006;28:913–922. doi: 10.1002/bies.20452. [DOI] [PubMed] [Google Scholar]
- Wang W, Thornton K, Berry A, Long M. Nucleotide variation along the Drosophila melanogaster fourth chromosome. Science. 2002;295:134–137. doi: 10.1126/science.1064521. [DOI] [PubMed] [Google Scholar]
- Wicker T, Sabot F, Hua-Van A, et al. (13 co-authors) A unified classification system for eukaryotic transposable elements. Nat Rev Genet. 2007;8:973–982. doi: 10.1038/nrg2165. [DOI] [PubMed] [Google Scholar]
- Wright SI, Schoen DJ. Transposon dynamics and the breeding system. Genetica. 1999;107:139–148. [PubMed] [Google Scholar]
Associated Data
This section collects any data citations, data availability statements, or supplementary materials included in this article.