A protein crystallographic data collection using the PETRA II source sets the record in crystallographic resolution for a biological macromolecule (0.48 Å) for the small protein crambin and increases available data for refinement by a factor of 1.5. The quality of the data collected is evident by comparing the merging R factor between two different crambin data sets, collected from different crystals and using different beamlines and protocols (6%) and the final crystallographic R factor of 12.7% for the model refinement.
Keywords: PETRA II, crambin, high resolution
Abstract
With the development of highly brilliant and extremely intense synchrotron X-ray sources, extreme high-resolution limits for biological samples are now becoming attainable. Here, a study is presented that sets the record in crystallographic resolution for a biological macromolecule. The structure of the small protein crambin was determined to 0.48 Å resolution on the PETRA II ring before its conversion to a dedicated synchrotron-radiation source. The results reveal a wealth of details in electron density and demonstrate the possibilities that are potentially offered by a high-energy source. The question now arises as to what the true limits are in terms of what can be seen at such high resolution. From what can be extrapolated from the results using crystals of crambin, this limit would be at approximately 0.40 Å, which approaches that for smaller compounds.
1. Introduction
Crambin is a small protein consisting of 46 amino acids (VanEtten et al., 1965 ▶; Lobb et al., 1996 ▶; Hendrickson & Teeter, 1981 ▶) belonging to the thionin family. While the protein as such has long been known and its sequence (and structure) is homologous to those of other small plant toxins with antimicrobial activity, such as hordothionin, purothionin and viscotoxin (Johnson et al., 2005 ▶; Debreczeni et al., 2003 ▶ and references therein), its true function has so far eluded us. Crambin occurs in the seeds of Crambe abyssinica, from which it gains its name. C. abyssinica is an oilseed plant whose oils can be used as foam inhibitors, lubricants, polymer softeners and detergents. The role of crambin in the plant, as inferred from homologous proteins (those available in the PDB have a sequence identity to crambin of about 50%; Johnson et al., 2005 ▶; Debreczeni et al., 2003 ▶), could be a defence against fungi by lysing their membranes. However, the actual function of crambin still remains largely unclear. For viscotoxins and purothionins a binding site for the head regions of membrane lipids has been postulated (Pal et al., 2008 ▶; Debreczeni et al., 2003 ▶), but only one of the three residues that are essential for these interactions is also present in crambin (Fig. 1 ▶). In addition, crambin is far less basic than its membrane-binding homologues (Fig. 2 ▶) and has been shown to be inactive towards membranes (Pal et al., 2008 ▶). It may be speculated that crambin might be a relic of an abandoned evolutionary pathway.
Figure 1.
Sequence alignment of crambin with the only other homologous toxin families purothionin (PDB entry 1bhp), hordothionin (1wuw) and viscotoxin (3c8p). The red arrows indicate the residues that are essential for membrane binding. Yellow, green and blue shading indicates increased homology/identity.
Figure 2.
Overlay of crambin (violet) with β-purothionin (PDB entry 1bhp, yellow; Stec et al., 1995 ▶) and β-hordothionin (1wuw, magenta; Johnson et al., 2005 ▶) and their surface-charge representation.
Crambin exists in two isoforms that differ at two amino acids, Pro/Ser22 and Leu/Ile25, and are called the PL and SI forms (VanEtten et al., 1965 ▶; Yamano et al., 1997 ▶; Yamano & Teeter, 1994 ▶). The protein crystallizes readily and its crystal structure has been known for two decades (Teeter & Hendrickson, 1979 ▶; Teeter & Roe, 1993 ▶; Jelsch et al., 2000 ▶). Interestingly, while the pure PL or SI forms both give excellent crystals that diffract to atomic resolution (i.e. to at least 1.2 Å) or higher, the natural mixed form exhibits the best crystallization and diffraction properties (Teeter & Hendrickson, 1979 ▶). Crambin does not contain many residues that are capable of chemical activity or a noticeable active site, suggesting that its natural role is instead accomplished by its structure, shape or surface properties. However, its potential binding partners and interactions with the environment remain a mystery and not even the structure of crambin at 0.54 Å resolution (PDB code 1ejg; Jelsch et al., 2000 ▶) could help to answer this question.
Crambin, with its lack of obvious enzymatic activity and hard-to-guess biological function, might have not seemed to be the best target for an ultrahigh-resolution diffraction experiment. However, the crystals provide an excellent specimen for gauging the experimental possibilities on synchrotron beamlines. In this work, we attempted to explore the possibilities offered by the high-energy PETRA II source and to estimate the limits of diffraction that may possibly be reached experimentally. Making use of the superior beam properties at PETRA II and a specifically set up end station, we set out to establish new crystallographic frontiers.
2. Experimental
2.1. Crystallization and crystal preparation
Crambin crystals were grown in sitting drops from an ethanol/water solution (water is the precipitant and purification is achieved by extraction with apolar solvents; VanEtten et al., 1965 ▶; Lobb et al., 1996 ▶) as described previously (Teeter & Hendrickson, 1979 ▶). For cryogenic freezing two conditions were used: (i) the crystals were transferred briefly into a solution consisting of 50% PEG 200 and 50% of a solution of 30% ethanol in water and then into a solution consisting of 50% PEG 200 in water and (ii) the crystals were immersed in paraffin oil. Both setups gave good results. The 0.48 Å data set was collected from a crystal cryoprotected using PEG 200. Crystals were frozen by dipping them into liquid nitrogen.
2.2. Instrumentation and data collection
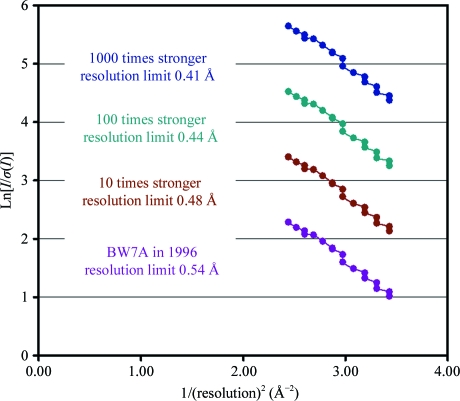
We used the previously determined 0.54 Å data set (PDB entry 1ejg; Jelsch et al., 2000 ▶) for a simulation of the attainable high-resolution limits as a function of the incident X-ray beam intensity. This simulation was performed before automated strategy-prediction software, for example BEST (Popov & Bourenkov, 2003 ▶) and HKL-3000 (Minor et al., 2006 ▶), became available. Although no detailed comparison was to hand, we had reason to believe that the intensity of the PETRA1 beamline was of the order of 100–1000 times greater compared with the intensity of the BW7A beamline used to collect the 0.54 Å data set. Assuming that the I/σ(I) ratio depends on the value of the incoming beam intensity only, we obtained an estimated diffraction limit of ∼0.40 Å (Fig. 3 ▶). The data-collection setup and procedure were fixed according to the estimations.
Figure 3.
Simulation of increased primary-beam intensity and extrapolation of the resolution limits for crambin from previous data collected on BW7A. The I/σ(I) ratio for the 16 bins within the resolution range 0.62–0.54 Å for the earlier data is shown in violet. The expected increase in this ratio at the PETRA1 beamline assuming a 1000-fold increase in intensity is shown in dark blue. A value of 1 on the vertical axis corresponds to I/σ(I) = 2.8, which was obtained for the outer shell in the earlier 0.54 Å data set. A linear extrapolation of the blue dependence gives a value of 1 at a resolution of just over 6 Å−2, which corresponds to about 0.4 Å.
Data collection was carried out on multiple crystals in two runs on beamline PETRA1 at the PETRA II storage ring, DESY, Hamburg. The beamline featured a 121-pole undulator with the storage ring operating at a maximum current of 50 mA and a particle energy of 11.3 GeV, a horizontal deflecting diamond (111)–germanium (220) double-crystal monochromator. The wavelength was tuned to 0.5498 Å (first run) and 0.5636 Å (second run) using optimized undulator gaps. The end-station setup consisted of a Huber six-circle Eulerian cradle diffractometer and was equipped with a MAR Research CCD 165 mm detector that could be mounted face-on or inclined by 45° to the beam axis to fake a 2θ setting for the high-resolution pass (figure S11). The original setup for this beamline was optimized for nuclear scattering experiments and high-resolution diffraction studies. The six-circle diffractometer was specifically designed for accurate ψ-scan rotations and high-resolution diffraction studies on small molecules as well as on protein crystals (Weckert & Hümmer, 1997 ▶).
The exposure times for the high-resolution pass (to the 0.40 Å limit) were set to 60 s for rotation increments of 0.15°. A total of 190° was covered. Such long exposure times were necessary owing to the low detector efficiency of the CCD detector at this wavelength. The medium-resolution pass was collected to the ∼1 Å limit with a rotational increment of 0.4° and an exposure time of 40 s. Although the medium-resolution data set was collected in one pass, the high-resolution portion had to be completed from a second crystal in a different orientation. The low-resolution data (to ∼4 Å) were used from the previously collected 0.54 Å data set. The statistics for the final merged data set are listed in Table 1 ▶.
Table 1. Data-collection statistics.
Statistics for the previously collected data to 0.54 Å resolution are also given for comparison. Values in parentheses are for the outer shell.
| New (0.48 Å) | 1ejg (0.54 Å) | |
|---|---|---|
| Space group | P21 | P21 |
| Unit-cell parameters (Å, °) | a = 22.329, b = 18.471, c = 40.769, β = 90.55 | a = 40.824, b = 18.498, c = 22.371, β = 90.47 |
| No. of reflections | 162360 | 112233 |
| Resolution range (Å) | 22–0.48 (0.49–0.48) | 22–0.54 (0.55–0.54) |
| Rmerge | 0.075 | 0.055 |
| 〈I/σ(I)〉 | 9.7 (1.5) | 8.2 (2.8) |
| Wilson B factor (Å2) | 2.14 | 2.24 |
2.3. Data processing
Data were processed using DENZO and SCALEPACK from the HKL suite of programs (Otwinowski & Minor, 1997 ▶). Merging of all of the data sets from the different crystals was carried out using SCALA from the CCP4 suite (Collaborative Computational Project, Number 4, 1994 ▶). Further conversions and the truncation of intensities to structure factors, as well as data analysis, were also performed using programs from the CCP4 package.
2.4. Refinement
Refinement was carried out stepwise, extending the resolution gradually. In a first step, the protein was rigid-body refined with REFMAC (Murshudov et al., 1997 ▶) using the 1ejg structure without solvent as the starting model. Subsequently, the structure was refined against diffraction intensities with SHELXL (Sheldrick & Schneider, 1997 ▶; Sheldrick, 2008 ▶) to 0.7 Å resolution. Corrections to the model, insertion of alternate conformers and building of solvent were carried out manually using the graphics program O (Jones et al., 1991 ▶). When the model was complete, H atoms were added at riding positions and the model was subsequently refined with individual anisotropic atomic displacement parameters included for non-H atoms. In the last round with SHELXL the resolution was extended to 0.65 Å.
Further multipole refinement was carried out against structure-factor amplitudes using MoPro (Jelsch et al., 2005 ▶), following a strategy outlined by Guillot et al. (2008 ▶) and using default restraint settings. For this, a first round of conventional xyzB refinement was carried out. This was followed by a round of high-order B-factor refinement (resolution range 1.0–0.5 Å) in order to avoid biasing the residual electron density of the nonspherical atomic contributions by the anisotropic atomic displacement parameters (Guillot et al., 2008 ▶). In subsequent steps, occupancies and valence populations were refined and expansion coefficients were then included (with atomic displacement parameters kept fixed). Finally, the multipole parameters were fully used over the whole resolution range from 20 to 0.48 Å with a σ cutoff of 0.0 (reflections with negative intensities were excluded). Following the procedure recommended by Guillot et al. (2008 ▶), disorder, solvent, H atoms and atoms with a displacement parameter of higher than 8 Å2 were excluded. This resulted in an R factor of 12.7% for all data. The refinement statistics are listed in Table 2 ▶.
Table 2. Procedure and statistics for the structure refinement.
| Refinement step/program | Additions | Resolution (Å) | R factor (%) | Free R (%) |
|---|---|---|---|---|
| REFMAC | Rigid molecule | 20–2.0 | 26.8 | 28.0 |
| Atomic positions | 20–0.8 | 21.6 | 21.1 | |
| Solvent | 20–0.7 | 16.0 | 15.6 | |
| Isotropic ADPs | 20–0.7 | 13.7 | 13.7 | |
| SHELXL | Double conformers | 20–0.7 | 13.8 | — |
| H atoms | 20–0.7 | 13.2 | — | |
| Anisotropic ADPs | 20–0.65 | 9.1 | — | |
| All | 20–0.65 | 7.9 | — | |
| MoPro | Solvent correction | 20–1.50 | — | — |
| Anisotropic ADPs† | 20–0.55 | 13.6 | — | |
| Valence population | 20–0.55 | 13.6 | — | |
| Expansion coefficients | 20–0.48 | 13.3 | — | |
| Multipoles | 20–0.48 | 12.7 | — | |
| All | 20–0.48 | 12.7 | — |
Also performed in a round of high-order refinement at 1.0–0.5 Å to prepare for subsequent steps.
3. Results and discussion
3.1. Comparison with the 0.54 Å data set
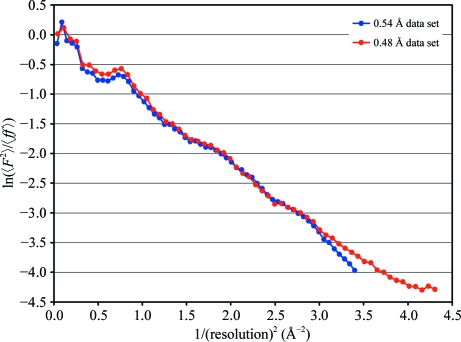
Apart from the different high-resolution limits the two data sets were quite similar (Table 1 ▶) and they also show similar Wilson plots (Fig. 4 ▶). The data sets scale very well, with an R factor of 6% for all structure-factor amplitudes and with no outliers or any other problematic features.
Figure 4.
Wilson plots for the 0.48 and 0.54 Å (PDB entry 1ejg) data sets.
3.2. On the resolution limit
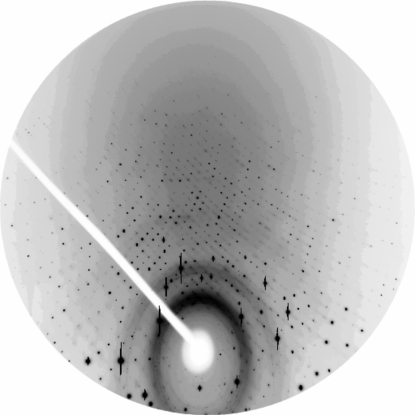
Using our setup, we collected data to 0.40 Å resolution. However, the reflections beyond 0.48 Å showed an average I/σ(I) of less than 1.5, which we considered to be too weak for subsequent use and thus we did not include them in the refinement procedure (Table 2 ▶). Nevertheless, diffraction spots were still visible on the images at about 0.4 Å resolution (Fig. 5 ▶) and it remains to be seen how to best make use of these data. We hope that future detectors may respond better to shorter X-ray wavelengths and have smaller point-spread functions; for example, the Se flat-panel detector, which has about two times higher absorbance at the radiation wavelength used compared with a CCD and was not yet available at the time of this experiment. Thus, the signal-to-noise ratio for weak ultrahigh-resolution reflections could be improved. Nevertheless, the obtained 0.48 Å sets the current record in resolution for a protein crystal structure.
Figure 5.
Diffraction image with the detector set at 45° inclination. The ovals are traces of ice rings; the outermost overloads are at 1 Å resolution. The top edge of the detector is at a resolution of 0.40 Å.
It became clear that for such measurements where the blind region is large, with a maximum 2θ angle approaching 90° and detectors of small size, the use of a kappa goniostat would have been of enormous advantage. While a Eulerian cradle offers almost complete freedom to move and rotate the crystal, not many degrees of freedom can actually be used for the rotation method and data collection with an area detector. The limitation here is that the crystal rotation axis must be parallel to the detector plane. Thus, when offsetting the crystal orientation (or ϕ axis) by χ one would be required to rotate the whole χ circle around ξ (and not only the crystal around ϕ) in order to achieve the desired change in crystal orientation with respect to the previous rotation axis in the same manner as a kappa goniostat (figure S21). However, this was only possible over a small angular range owing to the bulky χ circle and the danger of collision with the cryostat, collimator and detector, all of which had to be thoroughly positioned and aligned in an already very congested space (figure S11).
Although extending the resolution limits from 0.54 to 0.48 Å seems modest, it increased the amount of measured data by a factor of 1.5. This should add considerably to a solid and almost free refinement of the parameters that goes beyond the plain elliptical description of atoms.
3.3. Structure details
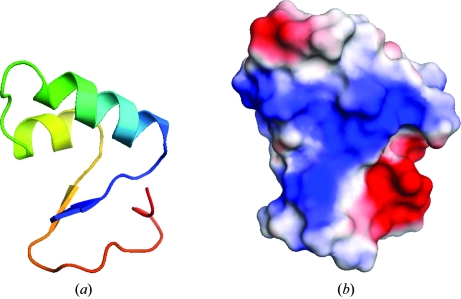
Crambin is quite hydrophobic, with a generally basic surface (Fig. 6 ▶). The molecules pack tightly in the crystal and almost all of the solvent, a mixture of ethanol and water molecules, can be located, which is extraordinary for a protein crystal structure. From a main-chain trace representation one would think that crambin displays some kind of binding groove (Fig. 6 ▶), but this apparent groove is filled by side chains. The molecular surface is rather flat and smooth, but features a distinct accumulation of positive charge in this area. This is matched by a region of negative charge around the C-terminus, a feature that is missing in homologous structures. H atoms became visible after isotropic ADP refinement. Indeed, about a quarter of H atoms, before they were included at their riding positions on fully occupied parent atoms, were seen in the 0.7 Å resolution difference electron density above the 3σ level (1σ corresponds to 0.166 e Å−3). The average value of difference density at the positions of H atoms is 2.8σ for main chain, 2.4σ for H atoms at Cβ atoms and 2.0σ for H atoms at further side-chain atoms.
Figure 6.
The structure of crambin. (a) Rainbow-coloured ribbon representation starting in blue at the N-terminus; (b) surface charges.
3.4. Electron density and alternate conformers
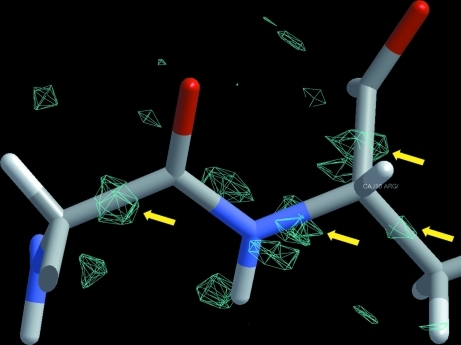
At this resolution the electron-density maps were of excellent quality. Even at the early refinement stages it was apparent that the usual spherical or elliptical description of the atoms would not suffice. For example, the bonding electron density became visible along the main chain (Fig. 7 ▶), thus justifying multipole refinement. In part owing to the presence of two distinct sequence forms in the crystal, there is a high degree of disorder in the crystal structure, which seems at first sight to contradict the very good crystal quality. Alternate conformers demanded thorough modelling of both protein and solvent. The protein itself displays four regions with two distinct main-chain and side-chain conformers, two of which are around positions 22 and 25. While the occupancies of the Pro22/Leu25 and Ser22/Ile25 conformers were the expected 0.65 and 0.35, respectively, other main-chain conformers as well as solvent molecules displayed different occupancy distributions that appeared to be independent of the protein-sequence type.
Figure 7.
Electron density (cyan) around Arg10 calculated at 0.65 Å before refinement with MoPro commenced. The F o − F c map is contoured at 2.7σ (0.25 e Å−3) above the mean. Bonding electron density is indicated.
4. Conclusions
We report the first crystallographic data collection from a protein using the PETRA II source. We showed that diffraction was obtained to a resolution of 0.40 Å, although only data to 0.48 Å could be used for refinement. With an extension of the resolution from the previously published 0.54 to 0.48 Å we could increase the amount of data available for refinement by a factor of 1.5 and thus back up the multipole parameters more firmly.
After high-order refinement and before the multipole parameters were included in the model, a residual density map was calculated that still clearly showed features such as bonding electrons that had not been accounted for. However, in comparison to the previously collected data set to 0.54 Å resolution, no fundamental additional structural features could be detected in the finally refined structure at 0.48 Å. We suspect that this is an effect arising from the way that the nonspherical features are modelled: the shapes of the electron clouds around the atoms are modelled, but not their finer structures. We thus presume that in this study we have reached a true resolution limit in terms of electron-density map interpretation and model parameterization: to the level that the currently available software and refinement protocols allow (see also Table 3 ▶). One striking argument is the cross R factor between the two different crambin data sets, collected from different crystals and using different beamlines and protocols. This value, 6%, is comparable to the merging R factors within the data, but is very different from the R factor of 12.7% which we obtained for the model refinement.
Table 3. Statistics of the final MoPro cycle.
| Resolution shell (Å) | R factor (%) | Goodness of fit |
|---|---|---|
| 20–2.44 | 10.41 | 1.22 |
| 1.15 | 7.74 | 0.99 |
| 0.96 | 7.64 | 0.93 |
| 0.86 | 9.43 | 0.97 |
| 0.79 | 10.88 | 0.99 |
| 0.74 | 12.69 | 1.04 |
| 0.70 | 15.33 | 0.91 |
| 0.67 | 17.81 | 0.80 |
| 0.64 | 18.63 | 0.82 |
| 0.62 | 19.30 | 0.81 |
| 0.60 | 19.74 | 0.82 |
| 0.58 | 20.66 | 0.82 |
| 0.56 | 21.54 | 0.78 |
| 0.55 | 22.17 | 0.78 |
| 0.53 | 22.97 | 0.77 |
| 0.52 | 24.17 | 0.73 |
| 0.51 | 25.27 | 0.71 |
| 0.50 | 26.96 | 0.69 |
| 0.49 | 27.16 | 0.65 |
| 0.48 | 27.48 | 0.62 |
The observed X-ray data and the derived atomic coordinates have been deposited in PDB under accession code 3nir.
Supplementary Material
PDB reference: crambin, 3nir
Supplementary material file. DOI: 10.1107/S1744309110052607/be5156sup1.pdf
Acknowledgments
We thank the staff of the Department of Biological Chemistry and Molecular Pharmacology (BCMP) at Harvard Medical School for their support during the cryofreezing tests and for making their X-ray laboratory available for crystal screening, Hermann Franz at HASYLAB/DESY for his help with beamline handling and optics setup and the members of Edgar Weckert’s group Alke Meents and Daniel Lübbert for their help with the end-station setup, equipment and controls.
Footnotes
Supplementary material has been deposited in the IUCr electronic archive (Reference: BE5156).
References
- Collaborative Computational Project, Number 4 (1994). Acta Cryst. D50, 760–763.
- Debreczeni, J. É., Girmann, B., Zeeck, A., Krätzner, R. & Sheldrick, G. M. (2003). Acta Cryst. D59, 2125–2132. [DOI] [PubMed]
- Guillot, B., Jelsch, C., Podjarny, A. & Lecomte, C. (2008). Acta Cryst. D64, 567–588. [DOI] [PubMed]
- Hendrickson, W. A. & Teeter, M. M. (1981). Nature (London), 290, 107–113. [DOI] [PMC free article] [PubMed]
- Jelsch, C., Guillot, B., Lagoutte, A. & Lecomte, C. (2005). J. Appl. Cryst. 38, 38–54.
- Jelsch, C., Teeter, M. M., Lamzin, V. S., Pichon-Pesme, V., Blessing, R. H. & Lecomte, C. (2000). Proc. Natl Acad. Sci. USA, 97, 3171–3176. [DOI] [PMC free article] [PubMed]
- Johnson, K. A., Kim, E., Teeter, M. M., Suh, S. W. & Stec, B. (2005). FEBS Lett. 579, 2301–2306. [DOI] [PubMed]
- Jones, T. A., Zou, J.-Y., Cowan, S. W. & Kjeldgaard, M. (1991). Acta Cryst. A47, 110–119. [DOI] [PubMed]
- Lobb, L., Stec, B., Kantrowitz, E. K., Yamano, A., Stojanoff, V., Markmann, O. & Teeter, M. M. (1996). Protein Eng. 9, 1233–1239. [DOI] [PubMed]
- Minor, W., Cymborowski, M., Otwinowski, Z. & Chruszcz, M. (2006). Acta Cryst. D62, 859–866. [DOI] [PubMed]
- Murshudov, G. N., Vagin, A. A. & Dodson, E. J. (1997). Acta Cryst. D53, 240–255. [DOI] [PubMed]
- Otwinowski, Z. & Minor, W. (1997). Methods Enzymol. 276, 307–326. [DOI] [PubMed]
- Pal, A., Debreczeni, J. É., Sevvana, M., Gruene, T., Kahle, B., Zeeck, A. & Sheldrick, G. M. (2008). Acta Cryst. D64, 985–992. [DOI] [PubMed]
- Popov, A. N. & Bourenkov, G. P. (2003). Acta Cryst. D59, 1145–1153. [DOI] [PubMed]
- Sheldrick, G. M. (2008). Acta Cryst. A64, 112–122. [DOI] [PubMed]
- Sheldrick, G. M. & Schneider, T. R. (1997). Methods Enzymol. 277, 319–343. [PubMed]
- Stec, B., Rao, U. & Teeter, M. M. (1995). Acta Cryst. D51, 914–924. [DOI] [PubMed]
- Teeter, M. M. & Hendrickson, W. A. (1979). J. Mol. Biol. 127, 219–223. [DOI] [PubMed]
- Teeter, M. M. & Roe, S. M. (1993). J. Mol. Biol. 230, 292–311. [DOI] [PubMed]
- VanEtten, C. H., Nielsen, H. C. & Peters, J. E. (1965). Phytochemistry, 4, 467–473.
- Weckert, E. & Hümmer, K. (1997). Acta Cryst. A53, 108–143.
- Yamano, A., Heo, N.-H. & Teeter, M. M. (1997). J. Biol. Chem. 272, 9597–9600. [DOI] [PubMed]
- Yamano, A. & Teeter, M. M. (1994). J. Biol. Chem. 269, 13956–13965. [PubMed]
Associated Data
This section collects any data citations, data availability statements, or supplementary materials included in this article.
Supplementary Materials
PDB reference: crambin, 3nir
Supplementary material file. DOI: 10.1107/S1744309110052607/be5156sup1.pdf


