Abstract
BACKGROUND AND PURPOSE
Mitochondria are involved in the toxicity of several compounds, retro-control of gene expression and apoptosis activation. The effect of mitochondrial genome (mtDNA) depletion on changes in ABC transporter protein expression in response to bile acids and paracetamol was investigated.
EXPERIMENTAL APPROACH
Hepa 1-6 mouse hepatoma cells with 70% decrease in 16S/18S rRNA ratio (Rho cells) were obtained by long-term treatment with ethidium bromide.
KEY RESULTS
Spontaneous apoptosis and reactive oxygen species (ROS) generation were decreased in Rho cells. Following glycochenodeoxycholic acid (GCDCA) or paracetamol, Rho cells generated less ROS and were more resistant to cell death. Apoptosis induced by GCDCA and Fas was also reduced. The basal expression of Mdr1 was significantly enhanced, but this was not further stimulated by GCDCA or paracetamol, as observed in wild-type (WT) cells. Basal expression of Mrp1 and Mrp4 was similar in WT and Rho cells, whereas they were up-regulated only in WT cells after GCDCA or paracetamol, along with the transcription factors Shp and Nrf2, but not Fxr or Pxr. Increased expression of Nrf2 was accompanied by its enhanced nuclear translocation. Glycoursodeoxycholic acid failed to cause any of the effects observed for GCDCA or paracetamol.
CONCLUSIONS AND IMPLICATIONS
The Nrf2-mediated pathway is partly independent of ROS production. Nuclear translocation of Nrf2 is insufficient to up-regulate Mdr1, Mrp1 and Mrp4, which requires the participation of other regulatory element(s) whose activation in response to GCDCA and paracetamol is impaired in Rho cells and hence probably sensitive to ROS.
Keywords: ABC proteins, paracetamol (acetaminophen), bile acid, cholestasis, drug toxicity, liver, mitochondria, multidrug resistance, retrograde control, rho cells
Introduction
Export pumps located at the plasma membrane of hepatocytes play a key role in the secretory function of the liver by removing xenobiotic and endogenous substances that otherwise could accumulate and cause noxious effects (Chandra and Brouwer, 2004). Most of these transporters belong to the superfamily of ATP-binding cassette (ABC) proteins (Schinkel and Jonker, 2003), which includes these gene families: ABCB, encoding multidrug-resistance proteins (e.g. multidrug-resistance protein-1 or MDR1 and the bile salt export pump or BSEP); ABCC, encoding multidrug-resistance-associated proteins (e.g. MRP1-4); and ABCG (e.g. the breast cancer resistance protein or BCRP).
The elimination of toxic compounds into the bile across the canalicular membrane is mainly mediated by MDR1 (gene symbol ABCB1), BSEP (ABCB11), MRP2 (ABCC2) and ABCG2 (ABCG2). However, when the normal vectorial transfer from blood to bile is impaired, MRP1 (ABCC1), MRP3 (ABCC3) and MRP4 (ABCC4), located at the sinusoidal membrane of hepatocytes, increase their expression and become important routes to mediate the regurgitation of cholephilic compounds back into the bloodstream, which favours their renal elimination (Geier et al., 2007).
How hepatocytes regulate the expression of these transporters, as well as the shift in the importance of different elements of their excretory machinery is largely unknown. The expression of ABC transport proteins in hepatocytes can be regulated by transcriptional events involving nuclear transcription factors such as the farnesoid X receptor (FXR), sensitive to bile acids, and the member of its signalling pathway, the small heterodimer partner (SHP), whereas xenobiotic receptors such as the constitutive androstane receptor (CAR) and pregnane X receptor (PXR) can be activated by a variety of drugs and toxins. Moreover, it has been suggested that nuclear factor E2-related factor 2 (NRF2) can be activated by both bile acids (Miyata et al., 2009) and xenobiotics such as paracetamol (acetaminophen; Aleksunes et al., 2008). In human liver cells, NRF2 has been reported to stimulate the expression of MRP2 (Vollrath et al., 2006). Moreover, this and other members of the MRP family, such as the rodent isoforms Mrp3 and Mrp4 can be up-regulated in mouse liver cells through the pharmacological activation of Nrf2 (Maher et al., 2007).
Mitochondrial function depends on proteins that are encoded by nuclear DNA and mitochondrial DNA (mtDNA), which contains the genes coding for 13 of the components of the respiratory chain (Attardi and Schatz, 1988). This is the main source of reactive oxygen species (ROS) produced in mitochondria as a by-product of aerobic metabolism. Although excessive generation of ROS can damage cellular constituents, including proteins, lipids, and DNA, low levels of ROS play a role in cell signalling (Finkel, 2000). Thus, in addition to the control mediated by direct activation of nuclear receptors, retrograde control mechanisms permitting crosstalk between mitochondrial and nuclear genomes have been suggested to play an important role in the overall response of hepatocytes to chemical stress and hence in the prevention of carcinogenesis (Erol, 2005). This is an interesting possibility, because mitochondria are particularly sensitive to the toxicity induced by many endogenous compounds, such as bile acids, and drugs, such as paracetamol. The role of this organelle as a sensor in the retro-control of the expression of genes involved in the defence against chemical stress could constitute an important mechanism in the overall function of hepatocytes.
The aim of the present study was to investigate the effect of depletion of the mitochondrial genome in the response of liver cells to exposure to bile acids and paracetamol, in terms of the expression of ABC proteins.
Methods
Cell lines and culture conditions
The mouse hepatoma Hepa 1-6 (CRL-1830) cell line was obtained from the American Type Culture Collection (ATCC, Rockville, MD, USA). Hepa 1-6 cells were cultured in Dulbecco's modified Eagle's medium (DMEM) (Sigma-Aldrich, Madrid, Spain) containing 10% FCS (TDI S.A., Madrid, Spain) and 1% antibiotic-antimycotic solution (Invitrogen, Barcelona, Spain) and other supplements, as reported by the supplier, in a humidified atmosphere in 5% CO2 at 37°C. Rho Hepa 1-6 cells with a partial depletion of mtDNA were obtained by long-term (2 months) treatment with ethidium bromide (100 ng·mL−1), as described previously (Miller et al., 1996). To compensate for the impairment of respiratory metabolism and to support cell growth, the auxotrophy of Rho cells for uridine and pyruvate (Trounce et al., 1994) required the culture medium to be supplemented with 100 μg·mL−1 pyruvate and 50 μg·mL−1 uridine. To carry out the experiments, the cells were plated and incubated overnight in the absence of any of the compounds tested and then treated with tert-butyl hydroperoxide (tBOOH; 10, 25, 50, 100 µM for 5 h), glycochenodeoxycholic acid (GCDCA; 25, 50, 100 µM for 1, 3, 5, 6, 12, 24 or 48 h), deoxycholic acid (DCA; 25, 50 µM for 48 h), glycoursodeoxycholic acid (GUDCA; 25, 50, 100 µM for 1, 3, 48 h), paracetamol (50, 100, 300 µM for 1, 3, 5, 6, 12, 24 or 48 h), 2′,7′-dichlorofluorescein diacetate (DCFH-DA) or rhodamine 123 (Rh123) (Sigma-Aldrich). For studies of flow cytometry and gene expression, cells were detached with trypsin-EDTA solution and then pelleted by centrifugation at 250×g for 10 min, washed once with phosphate-buffered saline (PBS), pelleted again, and resuspended in DMEM.
Determination of gene expression levels and mtDNA copy number
Depletion of mtDNA was confirmed by real-time PCR amplification using specific primers for 16S rRNA. Total cellular DNA (nuclear and mtDNA) was extracted using the QIAamp DNA Blood Mini kit from Qiagen (Izasa, Barcelona, Spain). DNA was then quantified fluorimetrically with the PicoGreen DNA-Quantitation kit (Invitrogen). To determine mRNA levels by real-time RT-PCR, total RNA was isolated from cell lysates using RNAeasy spin columns from Qiagen. RNA was then quantified fluorimetrically with the RiboGreen RNA-Quantitation kit (Invitrogen). Random hexamers and avian myeloblastosis virus RT (Cloned AMV First-Strand cDNA Synthesis kit, Invitrogen) were used to synthesize cDNA from total RNA. Real-time quantitative PCR was then performed using AmpliTaq Gold polymerase (Applied Biosystems, Madrid, Spain) in an ABI Prism 7300 Sequence Detection System (Applied Biosystems). The thermal cycling conditions were as follows: a single cycle at 95°C for 10 min followed by 45 cycles at 95°C for 15 s and at 60°C for 60 s. Detection of the amplification products was carried out using SYBR Green I (Applied Biosystems). The absence of non-specific products of PCR, as examined by 2.5% agarose gel electrophoresis or melting-temperature curves, was confirmed in all cases, except in some cases where detection was carried out using TaqMan probes. As a calibrator, total RNA from mouse liver or kidney was used. The results of mRNA abundance for the target genes in each sample were normalized on the basis of 18S rRNA abundance, which was measured with the TaqMan Ribosomal RNA Control Reagents kit (Applied Biosystems). The mtDNA copy number was measured from total DNA and corrected by simultaneous measurement of the nuclear DNA by multiplex PCR using appropriate primers and TaqMan probes for DNA encoding 16S rRNA and 18S rRNA, respectively. The primer and TaqMan probe oligonucleotide sequences for mouse DNA encoding 16S rRNA (GeneBank Accession Number AY675564) were as follows: forward, 5′-AAC CCC GCC TGT TTA CCA A-3′; reverse, 5′-CGT TCA TGC TAG TCC CTA ATT AAG G-3′; and TaqMan probe, 5′-TTT AAC GGC CGC GGT ATC CTG ACC-3′. The same sets of primers and probes were used to measure the absolute abundance of the rRNAs corresponding to these genes. Absolute quantification of mtDNA and rRNAs was carried out using standard curves generated by plotting the threshold cycle (Ct) versus log10 of the copy number of cDNA fragments obtained by conventional PCR and quantified with the PicoGreen detection kit, as described in detail previously (Briz et al., 2003b). The primer oligonucleotide sequences and conditions to carry out quantitative PCR of Mrp1, Mrp2, Mdr1 (Briz et al., 2003a) and Ntcp (Vicens et al., 2007) have been described previously. The primer oligonucleotide sequences for mouse Mrp4 were: forward, 5′-TGG TCA TAA GCG GAG ACT GGA-3′ and reverse, 5′-CCA GTA CCG TTG AAG CTC CTC T-3′ (position 195–288, GeneBank Accession Number NM_001033336). For mouse Bsep they were: forward primer 5′-TGA CTT TCC ACA GTG GCG TCT-3′ and reverse primer 5′-ATG GTG TCT GCA ATC TTC ACT CA-3′ (position 43–129), GeneBank Accession Number NM_021022). For mouse Bcrp they were: forward primer 5′-CAC GTG TTA GTA CCA ATG TCG CA-3′ and reverse primer 5′-TCC GGA CTA GAA ACC CAC TCT TT-3′ (position 475–622, GeneBank Accession Number AF103796). All primers were designed with the assistance of Primer Express software (Applied Biosystems), and their specificity was checked using BLAST, and were obtained from Sigma-Genosys (Madrid, Spain).
Cell viability, apoptosis, ROS generation and mitochondrial membrane potential (MMP)
The cell growth rate was determined by measuring total protein (Markwell et al., 1978) at different time points during 1 week of cell culture. Cell viability was evaluated using the Neutral Red (Sigma-Aldrich) test (Fautz et al., 1991). To quantify the percentage of apoptotic cells, DNA fragmentation was analysed by flow cytometry using a FACSort flow cytometer (BD Biosciences, San Jose, CA, USA). After the corresponding treatment, cells were trypsinized, washed with PBS and centrifuged. The pellets were resuspended in ethanol and stored at 4°C for 24 h. After washing, the cells were treated with RNase A in PBS at 37°C for 30 min, stained with 50 μg·mL−1 propidium iodide (Sigma-Aldrich), and analysed by flow cytometry to measure their DNA content, as described previously (Perez and Cederbaum, 2001).
Flow cytometry was also used to measure the generation of ROS, MMP and cell viability. Cells were incubated with medium containing 5 µg·mL−1 Rh123 (MMP measurement) or 5 µg·mL−1 DCFH-DA (ROS measurement) for 1 h after the corresponding treatment. Then, they were trypsinized and resuspended in FCS-free medium. Propidium iodide (5 µg·mL−1) was added 10 min before fluorescence measurement, as described previously (Perez and Cederbaum, 2002). Conventional fluorescence images were obtained with a fluorescence microscope (Olympus, Tokyo, Japan).
Preparation of nuclear, cytoplasmic and crude membrane fractions
Nuclear extracts were prepared essentially according to a method published previously (Schonhoff et al., 2006), with minor modifications. All steps were carried out at approximately 4°C. Cells were rinsed and scraped off into PBS and the pellets were suspended in 3 volumes of ice-cold hypotonic buffer (10 mM HEPES, pH 7.9, 1.5 mM MgCl2, 10 mM KCl, 1 mM dithiothreitol (DTT) and protease inhibitors) and incubated on ice for 15 min. Igepal CA-630 (Sigma-Aldrich) was then added to a final concentration of 0.05% before vortexing vigorously for 10 s. After centrifugation (500×g for 30 s), the supernatant was collected and saved as the cytoplasmic fraction. The remaining crude nuclear pellet was washed with hypotonic buffer and resuspended in two-thirds volumes of ice-cold extraction buffer (20 mM HEPES, pH 7.9, 1.5 mM MgCl2, 0.42 M NaCl, 0.2 mM EDTA, 25% (vol/vol) glycerol, 1 mM DTT and protease inhibitors). The sample was kept on ice for 30 min with gentle vortexing every 5–10 min. Samples were then centrifuged (5 min at 20 000×g) and the supernatant (nuclear extract) was collected. All samples were stored at −80°C until use. To assess the purity of the nuclear and cytoplasmic fractions, immunoblot-based detection of glyceraldehyde-3-phosphate dehydrogenase (GAPDH), as a cytoplasmic marker, and Oct1 (a transcription factor located at the nucleus), as a nuclear marker, was carried out. To prepare crude membranes cells were trypsinized, washed with PBS and centrifuged. The pellets were suspended in ice-cold homogenization buffer (250 mM sucrose, 2 mM EDTA, 20 mM Tris-HEPES, pH 7.4) supplemented with a protease inhibitor cocktail (Sigma-Aldrich). Membranes were disrupted by homogenization using a Polytron, collected by centrifugation (200 000×g, Beckman Ti70.1 rotor at 4°C for 90 min) and suspended in homogenization buffer.
Western blot analyses
Immunoblotting analyses were carried out in 7.5, 8 or 12% sodium dodecyl sulfate-polyacrylamide gels, using 50 µg of protein loading per lane and transferred onto a nitrocellulose membrane (Bio-Rad, Hercules, CA). The primary antibodies (working dilutions) used were as follows: rabbit polyclonal antibodies against MDR1 (1:500) (Lifespan Biosciences, Seattle, WA, USA), Oct1 (1:500) (Abcam, Cambridge, UK), SHP (H-160) (1:100) and Nrf2 (C-20) (1:500), rat monoclonal antibodies against MRP1 (1:500) (Alexis Biochemicals, San Diego, CA) and MRP4 (1:500) and mouse monoclonal antibodies against Na+/K+-ATPase (1:500) (Sigma-Aldrich) and GAPDH (6C5) (1:1000) (Santa Cruz Biotechnology, Santa Cruz, CA, USA). Anti-rat IgG (Santa Cruz Biotechnology), anti-rabbit and anti-mouse IgG (Amersham Pharmacia Biotech, Freiburg, Germany) horseradish peroxidase-linked secondary antibodies were used.
Statistical analysis
Values are expressed as mean ± SEM. Statistical analyses were performed using the SPSS 10.0.6 software (SPSS Inc., Chicago, IL, USA) for Windows (Microsoft Co., Seattle, WA, USA). To calculate the statistical significance of the differences between groups, the Bonferroni method for multiple range testing, and Student's t-test or the paired t-test were used, as appropriate.
Results
Characterization of Rho cells
Long-term incubation in the presence of 100 ng·mL−1 ethidium bromide causes depletion in mtDNA. This was assessed as the decreased abundance of 16S rRNA (Figure 1). To confirm that this was not due to changes in expression levels, the abundance of the corresponding DNA was also measured (Figure 1, inset). A rapid depletion of approximately 70% in both RNA and DNA coding 16S rRNA was observed. This reached steady state, which persisted for more than two months. The shape of the mtDNA-depleted or Rho cells was slightly less rounded (Figure 2A and B). The growth of these cells in culture was similar to that of wild-type (WT) cells (Figure 2C). In contrast, ROS production was markedly lower in Rho cells than in WT cells (Figure 2D–F).
Figure 1.
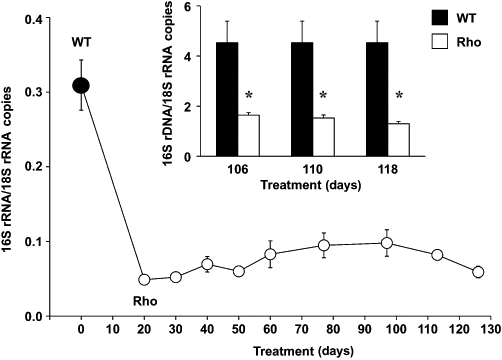
Time-course of mtDNA depletion in Hepa 1–6 mouse hepatoma cells during treatment with 100 ng·mL−1 ethidium bromide. The ratio of abundance between mitochondrial-encoded (16S rRNA) and nuclear-encoded (18S rRNA) genes was calculated from results of RT-PCR analysis. The amount of mtDNA determined by direct PCR using 16S rRNA primers is shown in the inset. Values are expressed as mean ± SEM from three cultures measured in triplicate for each data point. *P < 0.05, significant differences between wild-type (WT) and mtDNA-depleted (Rho) cells.
Figure 2.
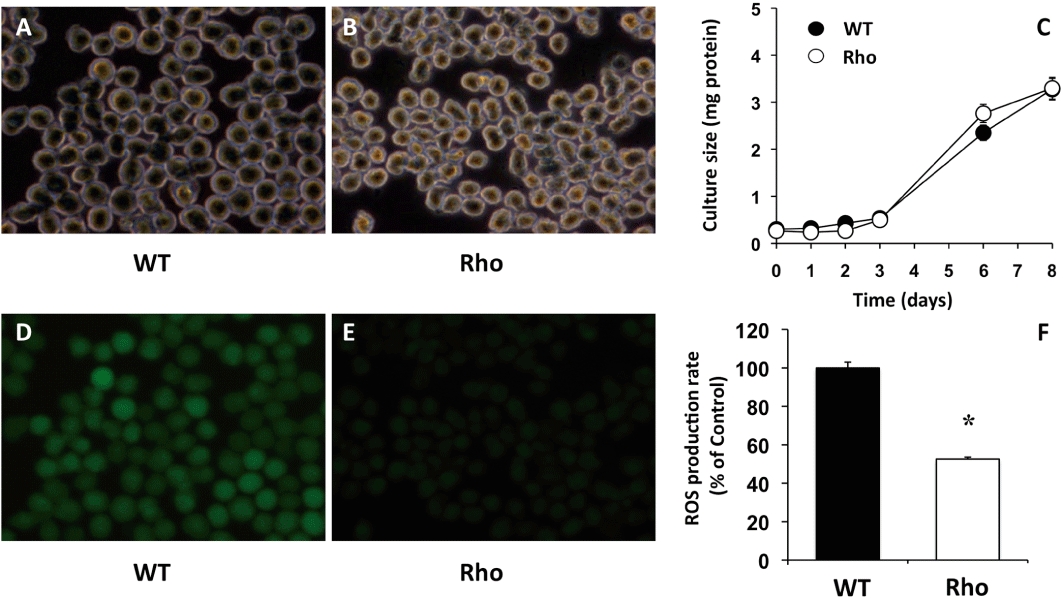
Representative photographs of phase-contrast (A,B) and fluorescence (D,E) microscopy of wild-type (WT) (A,D) and mtDNA-depleted (Rho) (B,E) Hepa 1–6 mouse hepatoma cells incubated with 5 µg·mL−1 DCFH-DA for 1 h. The rate of cell growth was measured by total protein content (C). Fluorescence was measured to determine ROS production (D,E,F). Values are expressed as mean ± SEM from five cultures measured in triplicate for each data point. *P < 0.05, significant differences between WT and Rho cells.
Sensitivity of Rho cells to bile acids or paracetamol-induced toxicity
When the cells were exposed to bile acids or paracetamol and viability was measured with the Neutral Red test, which is not directly dependent on mitochondrial function, a clearly different sensitivity was found (Figure 3). In the range of concentrations investigated here, GUDCA induced no marked toxic effect on WT or Rho cells (Figure 3A). In contrast, in WT cells, GCDCA and paracetamol markedly reduced cell viability, with an IC50 of approximately 150 µM and 180 µM, respectively (Figure 3B, C). Sensitivity to GCDCA and paracetamol was significantly decreased in Rho cells, for which the IC50 values increased to approximately 350 µM and 500 µM, respectively (Figure 3B, C).
Figure 3.
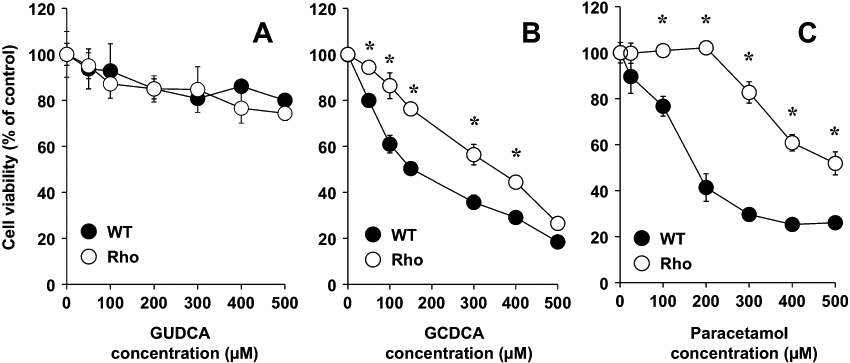
Concentration-dependent effect of glycoursodeoxycholic acid (GUDCA) (A), glycochenodeoxycholic acid (GCDCA) (B) and paracetamol (C) on the viability of wild-type (WT) and mtDNA-depleted (Rho) Hepa 1–6 mouse hepatoma cells as measured with the Neutral Red test after 48 h of incubation. Values are expressed as mean ± SEM from five cultures measured in triplicate for each data point. *P < 0.05, significant differences between WT and Rho cells.
When spontaneous cell death was studied by flow cytometry, we found a significantly lower proportion of dead cells in Rho than in WT cell cultures (Figure 4A). This was consistent with the smaller proportion of hypodiploid (apoptotic) bodies observed in Rho cells (Figure 4B). Treatment of WT cells with either 100 µM GCDCA (Figure 4C) or 2 μg·mL−1 Fas antibody (Jo2) (BD, Biosciences) (Figure 4D) resulted in a stimulation of apoptosis. In contrast, under similar experimental circumstances apoptosis in Rho cells was not induced (Figure 4C and D).
Figure 4.
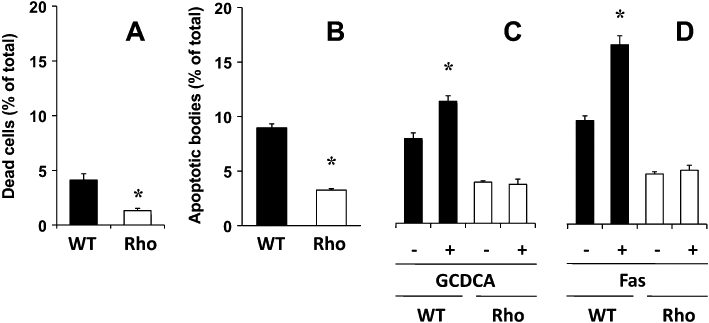
Proportion of dead cells (A) and hypodiploid bodies (B) determined with flow cytometry after staining with propidium iodide in wild-type (WT) and mtDNA-depleted (Rho) Hepa 1–6 mouse hepatoma cells. Effect of incubation with 100 µM glycochenodeoxycholic acid (GCDCA) (C) and 2 μg·mL−1 Fas antibody (Jo2) (D) for 24 h on the proportion of apoptotic bodies. Values are mean ± SEM from five cultures measured in triplicate for each data point. *P < 0.05, significant differences between WT and Rho cells.
There were fewer cells with low MMP in Rho than in WT cell cultures (Figure 5). Moreover, the effect of a non-specific agent able to induce oxidative stress, such as tBOOH, affected MMP more in WT than in Rho cells (Figure 5). This was accompanied by a higher response regarding ROS generation in WT than in Rho cells when incubated with tBOOH (Figure 6A). As a negative control, we used incubation with GUDCA, which did not increase ROS production in either WT or Rho cells; instead, a decrease was observed in WT cells (Figure 6B). In contrast, GCDCA (Figure 6C) and paracetamol (Figure 6D) induced ROS generation in WT cells, whereas neither had any effect on Rho cells.
Figure 5.
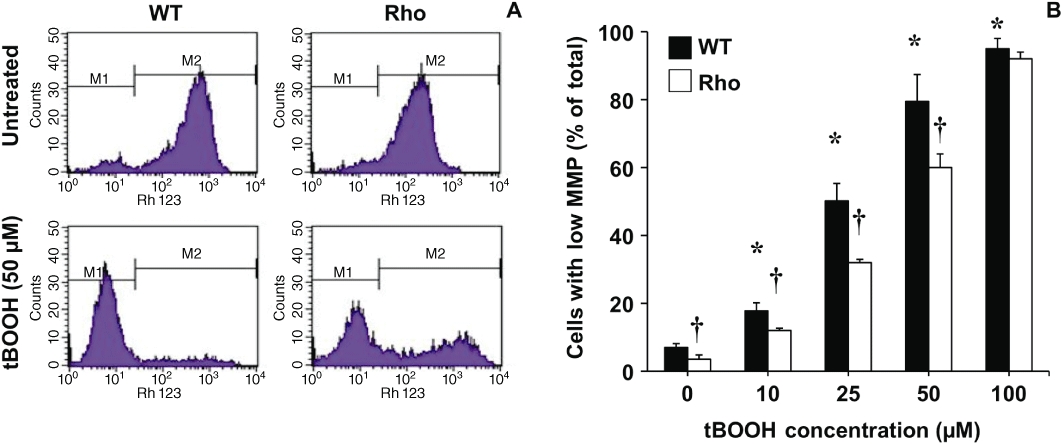
Representative histograms obtained with flow cytometry to determine mitochondrial membrane potential (MMP) after incubating wild-type (WT) and mtDNA-depleted (Rho) Hepa 1–6 mouse hepatoma cells with 5 μg·mL−1 rhodamine 123 for 1 h. Two populations of cells with either low (M1) or high (M2) MMP were identified (A). Proportion of cells with low MMP after treating the culture with the indicated concentrations of tert-butyl hydroperoxide (tBOOH) for 5 h (B). Values are mean ± SEM from five cultures measured in triplicate for each data point. *P < 0.05, significantly different from untreated WT cells; †P < 0.05, significant differences between Rho with WT cells.
Figure 6.
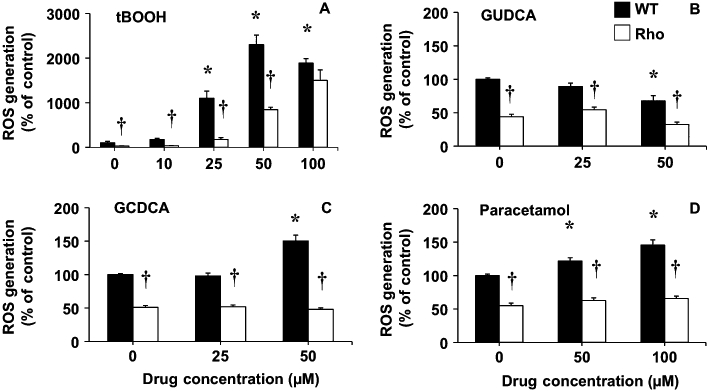
ROS production as determined by flow cytometry after incubating wild-type (WT) and mtDNA-depleted (Rho) Hepa 1–6 mouse hepatoma cells with 2.5 µg·mL−1 DCFH-DA for 1 h. ROS generation was stimulated by treating the cells with the indicated concentrations of tert-butyl hydroperoxide (tBOOH) (A), glycoursodeoxycholic acid (GUDCA) (B), glycochenodeoxycholic acid (GCDCA) (C) and paracetamol (D) for 5 h. Values are expressed as mean ± SEM from five cultures measured in triplicate for each data point. *P < 0.05, significantly different from untreated WT cells; †P < 0.05, significant differences between Rho with WT cells.
Changes in ABC protein expression
As compared with mouse liver and/or kidney, a markedly higher expression of Mrp1, Mrp4 and Mrd1, but a poor or negligible expression of Mrp2, Mdr2 and Bsep, was found in WT cells (Table 1). When comparing expression of genes in a hepatoma cell line with that in samples of liver tissue, it should be noted that liver parenchyma contains many types of cells and approximately 30% of them are non-hepatocytes. Regarding uptake transporters, such as Ntcp and Oatp1b2, as well as enzymes involved in bile acid metabolism, their expression in WT cells was also negligible (Table 1). Similar results were obtained when Rho cells were investigated, except that Mdr1 expression was higher in Rho than in WT cells (Table 1), as has been previously described in human HCT-8 colon cancer cells with reduced mtDNA content (Lee et al., 2008). In both WT and Rho cells incubation with GUDCA did not stimulate the expression of Mdr1 (Figure 7A), Mrp1 (Figure 7D) or Mrp4 (Figure 7G). In contrast, in WT cells, GCDCA was able to enhance the expression of Mdr1 (Figure 7B), Mrp1 (Figure 7E) and Mrp4 (Figure 7H), whereas in Rho cells GCDCA induced no significant change in the expression levels of these three proteins (Figure 7B, E and H). Similar results were obtained using another potentially toxic bile acid, such as deoxycholic acid (data not shown). In WT cells, paracetamol was also able to induce the expression of Mdr1 (Figure 7C), Mrp1 (Figure 7F) and Mrp4 (Figure 7I), but not in Rho cells (Figure 7C, F and I). Western blot analyses confirmed the results of the changes in expression of Mdr1, Mrp1 and Mrp4 observed in the presence of bile acids (Figure 8).
Table 1.
Basal expression levels of main transporters and enzymes involved in the uptake/export and metabolism of bile acids
| Ct | mRNA abundance versus mouse liver (kidney) (in %) | |||
|---|---|---|---|---|
| Mouse liver (kidney) | Hepa 1-6 wild type | Wild type | Rho | |
| Mrp1 | 30 (25) | 23 | 3000 (200) | 3360 (225) |
| Mrp2 | 22 | 35 | <0.01 | <0.01 |
| Mrp4 | 31 (20) | 21 | 50 000 (40) | 53 000 (42) |
| Mdr1 | 34 (30) | 29 | 1800 (140) | 3000 (225) |
| Mdr2 | 23 | 31 | 0.50 | 0.31 |
| Ntcp | 17 | 30 | 0.02 | 0.05 |
| Bsep | 25 | ND | ND | ND |
| Bcrp | 26 | 32 | 0.33 | 0.23 |
| Oatp1b2 | 25 | ND | ND | ND |
| Cyp27 | 21 | 30 | 0.07 | 0.13 |
| Cyp7a1 | 20 | 31 | 0.09 | 0.10 |
Values of threshold cycle (Ct) and mRNA abundances were determined by real-time RT-PCR.
ND, non-detected.
Figure 7.
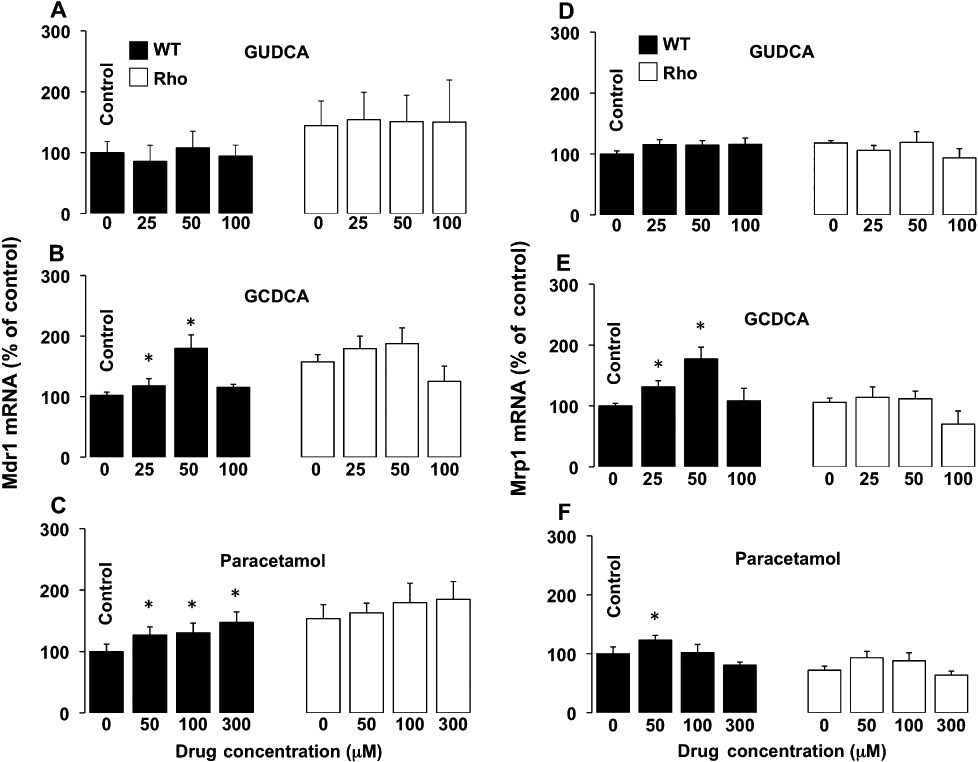
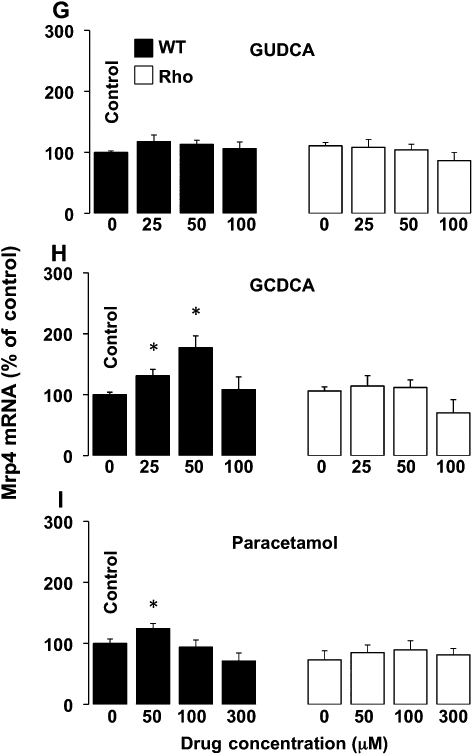
Concentration-dependent effect in wild-type (WT) and mtDNA-depleted (Rho) Hepa 1–6 mouse hepatoma cells of incubation with glycoursodeoxycholic acid (GUDCA) (A,D,G), glycochenodeoxycholic acid (GCDCA) (B,E,H) or paracetamol (C,F,I) for 48 h on Mdr1 (A,B,C), Mrp1 (D,E,F) and Mrp4 (G,H,I) expression as revealed by determining the abundance of mRNA using real-time quantitative RT-PCR. Values are expressed as mean ± SEM from five cultures measured in triplicate for each data point. *P < 0., significant differences between treated and untreated cells.
Figure 8.
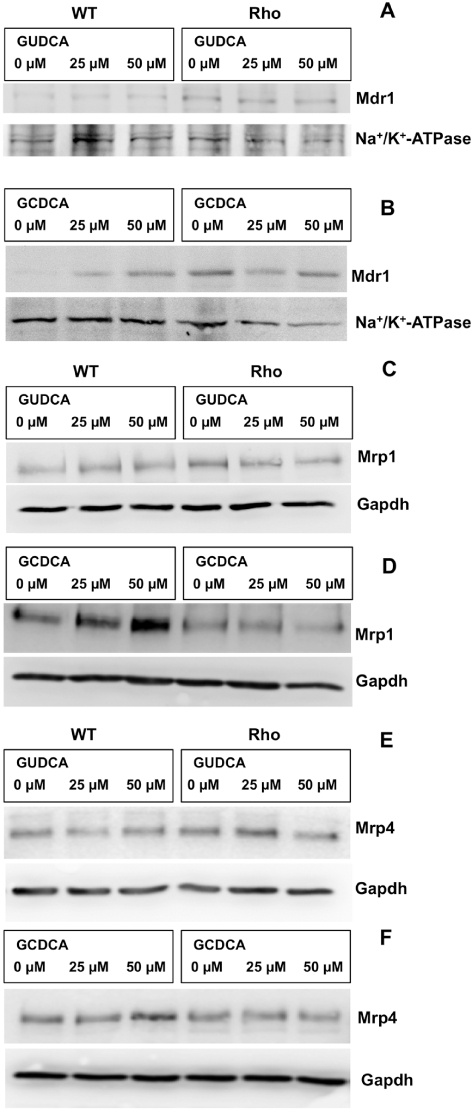
Representative Western blots of Mdr1 (A,B), Mrp1 (C,D) and Mrp4 (E,F) in wild-type (WT) and mtDNA-depleted (Rho) Hepa 1–6 mouse hepatoma cells incubated with the indicated concentrations of glycoursodeoxycholic acid (GUDCA) (A,C,E) or glycochenodeoxycholic acid (GCDCA) (B,D,F) for 48 h. These results were confirmed in two additional experiments. For Mrp1 and Mrp4, total cell lysates were used and Western blots were normalized using Gapdh detection. Owing to the low signal found for Mdr1, the Western blots for this protein were carried out with crude membrane, and Na+/K+-ATPase detection was used to normalize the results.
Changes in nuclear receptors and transcription factors
Regarding the nuclear receptors and transcription factors involved in the control of ABC protein expression (Table 2), no detectable expression of Car was found either in WT or Rho cells. Both Fxr and Shp were detected but at very low levels as compared with mouse liver. In contrast, although at lower levels than in liver, both Pxr and Nrf2 were clearly expressed in these cells. The abundance of Nrf2 and Fxr mRNA was similar in WT and Rho cells, whereas the expression of Pxr and Shp was reduced in Rho cells (Figure 9). Incubation with GUDCA had no significant effect on the expression of these nuclear receptors either in WT or Rho cells (Figure 9). Fxr and Pxr levels were not affected by incubation with either GCDCA or paracetamol, whereas both compounds were able to induce the expression of Shp in WT but not in Rho cells (Figure 9). Western blot analyses confirmed the absence of stimulation of Shp expression by GCDCA and paracetamol in Rho cells (Figure 10), together with the mild up-regulation of Shp expression by both compounds, in WT cells (Figure 10).
Table 2.
Basal expression levels of main nuclear receptors and transcription factors involved in the control of ABC protein expression
| Ct | mRNA abundance versus mouse liver (in %) | |||
|---|---|---|---|---|
| Mouse liver | WT | Wild type | Rho | |
| Fxr | 20 | 31 | 0.15 | 0.12 |
| Shp | 23 | 30 | 1.24 | 1.11 |
| Pxr | 27 | 30 | 25.73 | 18.87 |
| Car | 27 | 38 | <0.01 | <0.01 |
| Nrf2 | 25 | 27 | 45.46 | 45.68 |
Values of threshold cycle (Ct) and mRNA abundances were determined by real-time RT-PCR.
Figure 9.
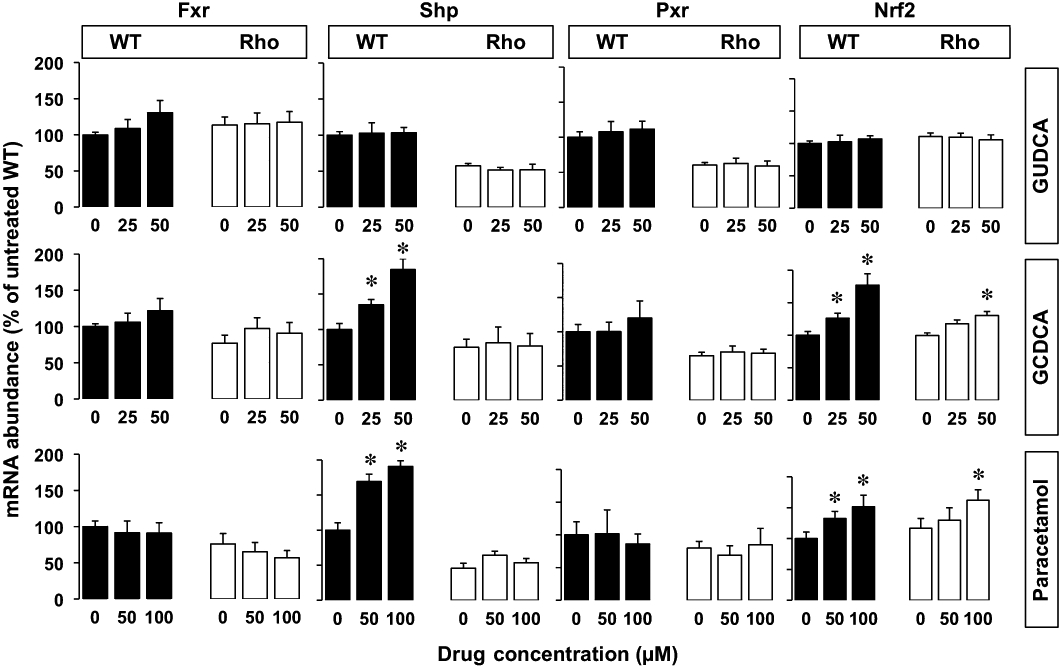
Concentration-dependent effect in wild-type (WT) and mtDNA-depleted (Rho) Hepa 1–6 mouse hepatoma cells of the incubation with glycoursodeoxycholic acid (GUDCA), glycochenodeoxycholic acid (GCDCA) or paracetamol for 48 h on Fxr, Shp, Pxr and Nrf2 expression as revealed by determining the abundance of mRNA using real-time quantitative RT-PCR. Values are expressed as mean ± SEM from five cultures measured in triplicate for each data point. *P < 0.05, significantly different from untreated cells.
Figure 10.
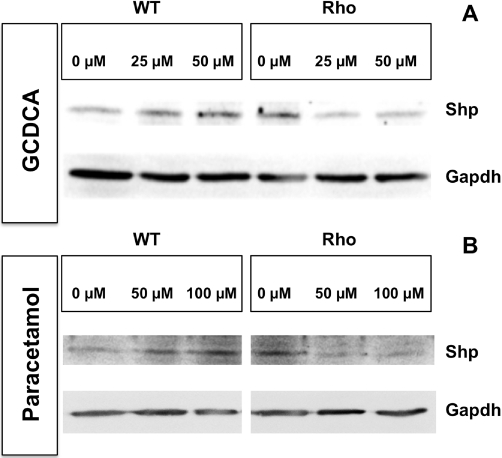
Representative Western blots showing the concentration-dependent effect of the incubation with glycochenodeoxycholic acid (GCDCA) (A) or paracetamol (B) for 48 h on Shp expression in wild-type (WT) and mtDNA-depleted (Rho) Hepa 1–6 mouse hepatoma cells. These results were confirmed in two additional experiments.
In contrast, Nrf2 expression was clearly stimulated by GCDCA and paracetamol in both WT and Rho cells (Figure 9). A time-course study of this stimulation by Western blot revealed that steady state was reached at approximately 12 h (Figure 11). The translocation of Nrf2 from the cytoplasm into the nucleus was investigated by adding a typical stimulator of this process: tert-butyl hydroquinone (TBHQ). This resulted in an early increase of Nrf2 in the nuclear fraction together with a mild but progressive decrease of the immunoblotting signal for Nrf2 in the cytoplasm. Similarly, in WT cells, translocation of Nrf2 into the nucleus was stimulated by GCDCA and paracetamol (Figure 12). This response, although weaker, was also observed in Rho cells (Figure 12).
Figure 11.
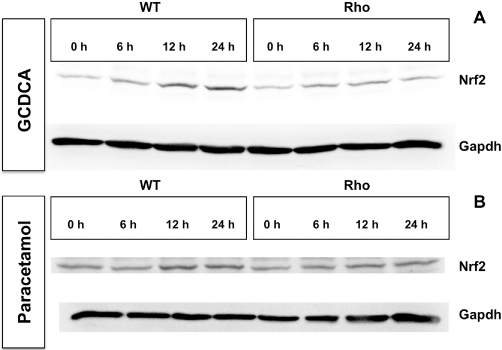
Representative Western blots showing the time-course of the effect of the incubation with 50 µM glycochenodeoxycholic acid (GCDCA) (A) or 50 µM paracetamol (B) on Nrf2 expression in wild-type (WT) and mtDNA-depleted (Rho) Hepa 1–6 mouse hepatoma cells. These results were confirmed in two additional experiments.
Figure 12.
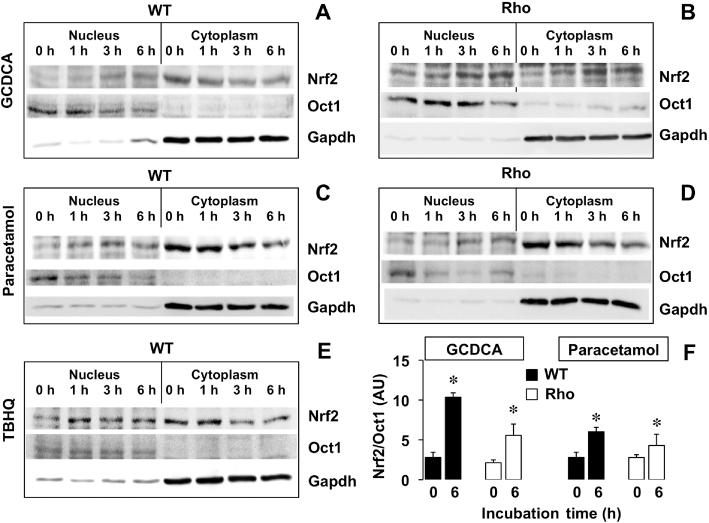
Representative Western blot showing the time course of the effect of 60 µM tert-butyl hydroquinone (TBHQ) (A), 50 µM glycochenodeoxycholic acid (GCDCA) (B) or 50 µM paracetamol (C) on Nrf2 translocation from the cytoplasm into the nucleus in wild-type (WT) and mtDNA-depleted (Rho) Hepa 1–6 mouse hepatoma cells. Oct1 and Gapdh were used as nuclear and cytoplasmic markers, respectively. These results were confirmed in five additional experiments. Results from densitometry of bands at 0 and 6 h in nuclear extracts were normalized with Oct1 (F). *P < 0.05, significant differences between nuclear extracts collected at 0 and 6 h from the same culture; paired t-test. AU, arbitrary units.
Discussion
Long-term treatment of cells with low doses of ethidium bromide, an inhibitor of DNA/RNA synthesis, specifically suppresses the replication and transcription of extrachromosomal genetic components such as mtDNA without affecting nuclear DNA replication and transcription (Zylber et al., 1969) (Desjardins et al., 1985) (Hayakawa et al., 1998). In previous studies this allowed several groups to obtain mtDNA-depleted (Rho) cells (King and Attardi, 1989). Here we took advantage of this possibility to develop a useful tool to investigate the effect of the mitochondrial genome on the response of liver cells to bile acids and paracetamol as regards ROS production, the activation of apoptosis and the up-regulation of ABC proteins.
Bile acids are signalling molecules that facilitate the synchronization of the regulatory mechanisms involved in lipid metabolism as well as bile acid elimination/detoxification. The latter constitutes the basis for protection of liver cells against the ability of these compounds to cause toxicity during pathological accumulation. A complex network involving several nuclear receptors and transcription factors, has been reported to regulate the mechanisms accounting for the prevention of excessive accumulation of bile acids and drugs in liver cells (Eloranta and Kullak-Ublick, 2005). An important finding of the present study is that, although mtDNA depletion has no significant effect on very low levels of Fxr, it affects the basal expression of Shp, which is also very low, and Pxr. Both GCDCA and paracetamol, but not GUDCA, were able to induce the expression of Shp in WT cells. Interestingly, this ability was lost in Rho cells.
The mechanism of bile acid-induced toxicity on liver cells is complex and not fully understood, but it seems to involve mitochondrial toxicity, with an increased cellular production of ROS and oxidative stress. Mitochondrial impairment and activation of death receptors can subsequently result in the induction of apoptosis via activation of the pro-apoptotic effector caspases, and/or necrosis (Palmeira and Rolo, 2004). The results of the present study strongly support the well-known concept that mitochondria play a key role in bile acid-induced apoptosis, since Rho cells exhibited a significantly lower sensitivity to GCDCA-induced cell death. The ability of bile acids to induce ROS generation by isolated hepatic mitochondria has been reported (Krahenbuhl et al., 1994). Our results indicate that depletion of mtDNA also reduces the ability of cells to increase ROS production in response to certain bile acids. The effects on both ROS production and the induction of cell death were not specific to bile acids since they were also diminished as compared with WT cells when Rho cells were incubated with paracetamol.
ROS generation by cells can have both anti- and pro-apoptotic consequences, depending upon the intensity and duration of the production process (Fang et al., 2004). An important factor determining the final effect of ROS is the activation of anti-apoptotic genes. One of them is NRF2, which stimulates the adaptive response and cell survival during exposure to a large variety of endogenous and xenobiotic compounds (Klaassen and Reisman, 2010). NRF2 is a basic leucine-zipper transcription factor that binds to antioxidant responsive elements (AREs), and behaves as a main regulator for many antioxidative and/or cytoprotective genes (Kensler et al., 2007) (for a scheme see Figure 13). Proteasomal degradation of NRF2 is a very efficient mechanism dependent on Keap1 protein that determines the short half-life (approximately 20 min) of NRF2 in the absence of stimulatory/inhibitory signals. Keap1 recruits NRF2 into the Cul3-containing E3 ubiquitin ligase complex for ubiquitin conjugation and subsequent proteasomal degradation (Sun et al., 2007). However, under certain circumstances, such as oxidative or electrophilic stress, the interaction between NRF2 and Keap1 is disrupted, resulting in a decreased proteasomal degradation of NRF2, the accumulation of free NRF2 in the cytosol, and an increase in NRF2 translocation into the nucleus (Li and Kong, 2009). In addition, NRF2 up-regulation results from both the inhibition of NRF2 degradation and enhanced NRF2 translation, which is partly dependent on interactions with specific regions recently described in the untranslated region of human NRF2 mRNA (Li et al., 2010). Once in the nucleus, NRF2 heterodimerizes with a small musculo-aponeurotic fibrosarcoma (Maf) protein and binds to ARE sequences in ARE-bearing promoters, leading to the recruitment of the nuclear elements required for transcription of several target genes (Klaassen and Reisman, 2010).
Figure 13.
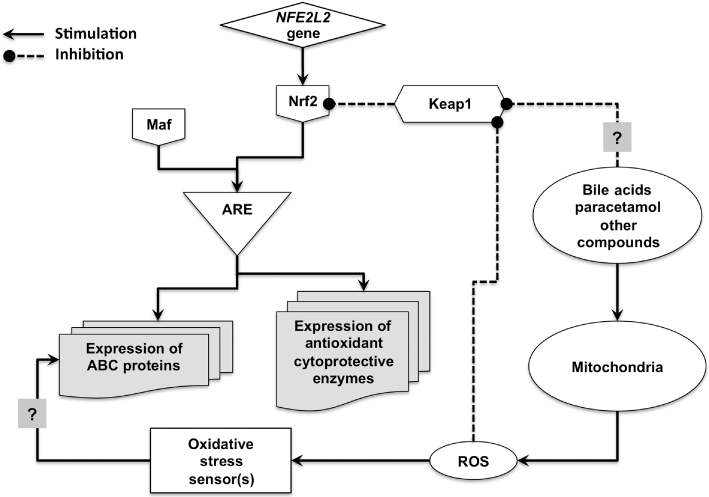
Schematic representation of the mechanisms proposed to be involved in the Shp and Nrf2-mediated up-regulation of ABC proteins induced by bile acids and paracetamol in liver cells. ARE, antioxidant response element; Fxr, farnesoid nuclear receptor; Keap1, Kelch-like ECH-associated protein 1; Maf, musculo-aponeurotic fibrosarcoma protein; ROS, reactive oxygen species; Shp, small heterodimer partner.
Many compounds have been reported to activate the NRF2-mediated defence mechanism (Ramos-Gomez et al., 2001). Among them are paracetamol (Chan et al., 2001) and some bile acids (Tan et al., 2007). On one hand, paracetamol was the first compound selected to illustrate the effects of a loss of NRF2. Paracetamol administration to Nrf2-null mice caused severe hepatocellular injury, whereas, at the same dose, paracetamol was relatively non-toxic to WT mice (Chan et al., 2001; Enomoto et al., 2001). On the other hand, potentially toxic bile acids, such as lithocholic acid and chenodeoxycholic acid, induce Nrf2 target genes, especially the rate-limiting enzyme in glutathione (GSH) biosynthesis (Tan et al., 2007). Moreover, in Fxr-null mice the accumulation of bile acids results in an enhanced expression of Nrf2 (Nomoto et al., 2009). Our results indicate that mechanisms accounting for mouse Nrf2 up-regulation and translocation into the nucleus were preserved in Rho cells. The observed up-regulation was not only due to changes in protein fate but also involved an enhanced transcription as the mRNA of Nrf2 was increased by incubation with GCDCA and paracetamol. Moreover, although slightly weaker, an up-regulatory response to the presence of GCDCA and paracetamol was also observed in Rho cells. This was an important finding of the present study because it suggested that both Nrf2 up-regulation and nuclear translocation were not strictly dependent on ROS production. In this respect, it has been recently demonstrated that the antioxidant bile acid ursodeoxycholic acid promotes the translocation of NRF2 into the nucleus in human hepatoma HepG2 cells (Arisawa et al., 2009). A ROS-independent interaction of bile acids and paracetamol on the Nrf2 up-regulatory machinery or an indirect effect through the activation of an intermediate sensor can be suggested (see Figure 13 for a working hypothesis).
The defensive mechanism activated by NRF2 involves the stimulation of ABC protein expression. In the present study we observed that in Rho cells, even though GCDCA- and paracetamol-induced ROS production was abolished, Nrf2 translocation into the nucleus was enhanced, although to a lower extent than in WT cells. In contrast, in Rho cells, the expression of the ABC proteins Mdr1, Mrp1 and Mrp4 did not respond to exposure to either GCDCA or paracetamol.
In conclusion, the present results suggest that activation of the Nrf2-mediated pathway is partly independent of ROS production. Moreover, in terms of ABC protein expression, Nrf2 translocation to the nucleus is insufficient for the up-regulation of Mdr1, Mrp1 and Mrp4, which probably requires the participation of other regulatory element(s) whose activation in response to GCDCA and paracetamol may be (directly or indirectly) sensitive to ROS production and hence affected by the lack of mtDNA integrity.
Acknowledgments
The authors thank N. Skinner for the revision of the English spelling, grammar and style of the manuscript.
This study was supported in part by the Instituto de Salud Carlos III, FIS (Grants CP05/0135, PI070517 and PI080151), Spain; the Junta de Castilla y Leon (Grant GR75-2008), Spain; the Ministerio de Ciencia e Innovacion, Plan Nacional de Investigacion Cientifica, Desarrollo e Innovacion Tecnologica and the European Regional Development Fund (ERDF) (Grants BFU2006-12577 and SAF2009-08493), Spain; and the Fundacion Investigacion Medica, Mutua Madrileña (Conv-VI, 2009), Spain. The group is member of the Network for Cooperative Research on Membrane Transport Proteins (REIT), co-funded by the Ministerio de Ciencia e Innovacion, Spain, and the ERDF (Grant BFU2007-30688-E/BFI), and belongs to the CIBERehd (Centro de Investigacion Biomedica en Red) for Hepatology and Gastroenterology Research (Instituto de Salud Carlos III, Spain). Ester González-Sánchez is a recipient of a predoctoral fellowship from the Ministerio de Educación, Spain (Grant AP2008-03762).
Glossary
Abbreviations
- ABC
ATP-binding cassette
- CAR
constitutive androstane receptor
- DCFH-DA
2′,7′-dichlorofluorescein diacetate
- FXR
farnesoid X receptor
- GCDCA
glycochenodeoxycholic acid
- GUDCA
glycoursodeoxycholic acid
- MDR
multidrug resistance protein
- MRP
multidrug resistance associated protein
- NRF2
nuclear factor E2-related factor 2
- PXR
pregnane X receptor
- Rh123
rhodamine 123
- SHP
small heterodimer partner
- tBOOH
tert-butyl hydroperoxide
Conflicts of interest
None to declare.
Supporting Information
Teaching Materials; Figs 1–14 as PowerPoint slide.
References
- Aleksunes LM, Slitt AL, Maher JM, Augustine LM, Goedken MJ, Chan JY, et al. Induction of Mrp3 and Mrp4 transporters during acetaminophen hepatotoxicity is dependent on Nrf2. Toxicol Appl Pharmacol. 2008;226:74–83. doi: 10.1016/j.taap.2007.08.022. [DOI] [PMC free article] [PubMed] [Google Scholar]
- Arisawa S, Ishida K, Kameyama N, Ueyama J, Hattori A, Tatsumi Y, et al. Ursodeoxycholic acid induces glutathione synthesis through activation of PI3K/Akt pathway in HepG2 cells. Biochem Pharmacol. 2009;77:858–866. doi: 10.1016/j.bcp.2008.11.012. [DOI] [PubMed] [Google Scholar]
- Attardi G, Schatz G. Biogenesis of mitochondria. Annu Rev Cell Biol. 1988;4:289–333. doi: 10.1146/annurev.cb.04.110188.001445. [DOI] [PubMed] [Google Scholar]
- Briz O, Macias RI, Serrano MA, Gonzalez-Gallego J, Bayon JE, Marin JJ. Excretion of foetal bilirubin by the rat placenta-maternal liver tandem. Placenta. 2003a;24:462–472. doi: 10.1053/plac.2002.0959. [DOI] [PubMed] [Google Scholar]
- Briz O, Serrano MA, Macias RI, Gonzalez-Gallego J, Marin JJ. Role of organic anion-transporting polypeptides, OATP-A, OATP-C and OATP-8, in the human placenta-maternal liver tandem excretory pathway for foetal bilirubin. Biochem J. 2003b;371(Pt 3):897–905. doi: 10.1042/BJ20030034. [DOI] [PMC free article] [PubMed] [Google Scholar]
- Chan K, Han XD, Kan YW. An important function of Nrf2 in combating oxidative stress: detoxification of acetaminophen. Proc Natl Acad Sci USA. 2001;98:4611–4616. doi: 10.1073/pnas.081082098. [DOI] [PMC free article] [PubMed] [Google Scholar]
- Chandra P, Brouwer KL. The complexities of hepatic drug transport: current knowledge and emerging concepts. Pharm Res. 2004;21:719–735. doi: 10.1023/b:pham.0000026420.79421.8f. [DOI] [PubMed] [Google Scholar]
- Desjardins P, Frost E, Morais R. Ethidium bromide-induced loss of mitochondrial DNA from primary chicken embryo fibroblasts. Mol Cell Biol. 1985;5:1163–1169. doi: 10.1128/mcb.5.5.1163. [DOI] [PMC free article] [PubMed] [Google Scholar]
- Eloranta JJ, Kullak-Ublick GA. Coordinate transcriptional regulation of bile acid homeostasis and drug metabolism. Arch Biochem Biophys. 2005;433:397–412. doi: 10.1016/j.abb.2004.09.019. [DOI] [PubMed] [Google Scholar]
- Enomoto A, Itoh K, Nagayoshi E, Haruta J, Kimura T, O'Connor T, et al. High sensitivity of Nrf2 knockout mice to acetaminophen hepatotoxicity associated with decreased expression of ARE-regulated drug metabolizing enzymes and antioxidant genes. Toxicol Sci. 2001;59:169–177. doi: 10.1093/toxsci/59.1.169. [DOI] [PubMed] [Google Scholar]
- Erol A. Retrograde regulation due to mitochondrial dysfunction may be an important mechanism for carcinogenesis. Med Hypotheses. 2005;65:525–529. doi: 10.1016/j.mehy.2005.03.022. [DOI] [PubMed] [Google Scholar]
- Fang Y, Han SI, Mitchell C, Gupta S, Studer E, Grant S, et al. Bile acids induce mitochondrial ROS, which promote activation of receptor tyrosine kinases and signaling pathways in rat hepatocytes. Hepatology. 2004;40:961–971. doi: 10.1002/hep.20385. [DOI] [PubMed] [Google Scholar]
- Fautz R, Husein B, Hechenberger C. Application of the neutral red assay (NR assay) to monolayer cultures of primary hepatocytes: rapid colorimetric viability determination for the unscheduled DNA synthesis test (UDS) Mutat Res. 1991;253:173–179. doi: 10.1016/0165-1161(91)90130-z. [DOI] [PubMed] [Google Scholar]
- Finkel T. Redox-dependent signal transduction. FEBS Lett. 2000;476:52–54. doi: 10.1016/s0014-5793(00)01669-0. [DOI] [PubMed] [Google Scholar]
- Geier A, Wagner M, Dietrich CG, Trauner M. Principles of hepatic organic anion transporter regulation during cholestasis, inflammation and liver regeneration. Biochim Biophys Acta. 2007;1773:283–308. doi: 10.1016/j.bbamcr.2006.04.014. [DOI] [PubMed] [Google Scholar]
- Hayakawa T, Noda M, Yasuda K, Yorifuji H, Taniguchi S, Miwa I, et al. Ethidium bromide-induced inhibition of mitochondrial gene transcription suppresses glucose-stimulated insulin release in the mouse pancreatic beta-cell line betaHC9. J Biol Chem. 1998;273:20300–20307. doi: 10.1074/jbc.273.32.20300. [DOI] [PubMed] [Google Scholar]
- Kensler TW, Wakabayashi N, Biswal S. Cell survival responses to environmental stresses via the Keap1-Nrf2-ARE pathway. Annu Rev Pharmacol Toxicol. 2007;47:89–116. doi: 10.1146/annurev.pharmtox.46.120604.141046. [DOI] [PubMed] [Google Scholar]
- King MP, Attardi G. Human cells lacking mtDNA: repopulation with exogenous mitochondria by complementation. Science. 1989;246:500–503. doi: 10.1126/science.2814477. [DOI] [PubMed] [Google Scholar]
- Klaassen CD, Reisman SA. Nrf2 the rescue: effects of the antioxidative/electrophilic response on the liver. Toxicol Appl Pharmacol. 2010;244:57–65. doi: 10.1016/j.taap.2010.01.013. [DOI] [PMC free article] [PubMed] [Google Scholar]
- Krahenbuhl S, Fischer S, Talos C, Reichen J. Ursodeoxycholate protects oxidative mitochondrial metabolism from bile acid toxicity: dose-response study in isolated rat liver mitochondria. Hepatology. 1994;20:1595–1601. doi: 10.1002/hep.1840200632. [DOI] [PubMed] [Google Scholar]
- Lee W, Choi HI, Kim MJ, Park SY. Depletion of mitochondrial DNA up-regulates the expression of MDR1 gene via an increase in mRNA stability. Exp Mol Med. 2008;40:109–117. doi: 10.3858/emm.2008.40.1.109. [DOI] [PMC free article] [PubMed] [Google Scholar]
- Li W, Kong AN. Molecular mechanisms of Nrf2-mediated antioxidant response. Mol Carcinog. 2009;48:91–104. doi: 10.1002/mc.20465. [DOI] [PMC free article] [PubMed] [Google Scholar]
- Li W, Thakor N, Xu EY, Huang Y, Chen C, Yu R, et al. An internal ribosomal entry site mediates redox-sensitive translation of Nrf2. Nucleic Acids Res. 2010;38:778–788. doi: 10.1093/nar/gkp1048. [DOI] [PMC free article] [PubMed] [Google Scholar]
- Maher JM, Dieter MZ, Aleksunes LM, Slitt AL, Guo G, Tanaka Y, et al. Oxidative and electrophilic stress induces multidrug resistance-associated protein transporters via the nuclear factor-E2-related factor-2 transcriptional pathway. Hepatology. 2007;46:1597–1610. doi: 10.1002/hep.21831. [DOI] [PubMed] [Google Scholar]
- Markwell MA, Haas SM, Bieber LL, Tolbert NE. A modification of the Lowry procedure to simplify protein determination in membrane and lipoprotein samples. Anal Biochem. 1978;87:206–210. doi: 10.1016/0003-2697(78)90586-9. [DOI] [PubMed] [Google Scholar]
- Miller SW, Trimmer PA, Parker WD, Jr, Davis RE. Creation and characterization of mitochondrial DNA-depleted cell lines with ‘neuronal-like’ properties. J Neurochem. 1996;67:1897–1907. doi: 10.1046/j.1471-4159.1996.67051897.x. [DOI] [PubMed] [Google Scholar]
- Miyata M, Matsuda Y, Nomoto M, Takamatsu Y, Sato N, Hamatsu M, et al. Cholesterol feeding prevents hepatic accumulation of bile acids in cholic acid-fed farnesoid X receptor (FXR)-null mice: FXR-independent suppression of intestinal bile acid absorption. Drug Metab Dispos. 2009;37:338–344. doi: 10.1124/dmd.108.022590. [DOI] [PMC free article] [PubMed] [Google Scholar]
- Nomoto M, Miyata M, Yin S, Kurata Y, Shimada M, Yoshinari K, et al. Bile acid-induced elevated oxidative stress in the absence of farnesoid X receptor. Biol Pharm Bull. 2009;32:172–178. doi: 10.1248/bpb.32.172. [DOI] [PMC free article] [PubMed] [Google Scholar]
- Palmeira CM, Rolo AP. Mitochondrially-mediated toxicity of bile acids. Toxicology. 2004;203:1–15. doi: 10.1016/j.tox.2004.06.001. [DOI] [PubMed] [Google Scholar]
- Perez MJ, Cederbaum AI. Spin trapping agents (Tempol and POBN) protect HepG2 cells overexpressing CYP2E1 against arachidonic acid toxicity. Free Radic Biol Med. 2001;30:734–746. doi: 10.1016/s0891-5849(01)00461-0. [DOI] [PubMed] [Google Scholar]
- Perez MJ, Cederbaum AI. Antioxidant and pro-oxidant effects of a manganese porphyrin complex against CYP2E1-dependent toxicity. Free Radic Biol Med. 2002;33:111–127. doi: 10.1016/s0891-5849(02)00865-1. [DOI] [PubMed] [Google Scholar]
- Ramos-Gomez M, Kwak MK, Dolan PM, Itoh K, Yamamoto M, Talalay P, et al. Sensitivity to carcinogenesis is increased and chemoprotective efficacy of enzyme inducers is lost in nrf2 transcription factor-deficient mice. Proc Natl Acad Sci USA. 2001;98:3410–3415. doi: 10.1073/pnas.051618798. [DOI] [PMC free article] [PubMed] [Google Scholar]
- Schinkel AH, Jonker JW. Mammalian drug efflux transporters of the ATP binding cassette (ABC) family: an overview. Adv Drug Deliv Rev. 2003;55:3–29. doi: 10.1016/s0169-409x(02)00169-2. [DOI] [PubMed] [Google Scholar]
- Schonhoff CM, Matsuoka M, Tummala H, Johnson MA, Estevez AG, Wu R, et al. S-nitrosothiol depletion in amyotrophic lateral sclerosis. Proc Natl Acad Sci USA. 2006;103:2404–2409. doi: 10.1073/pnas.0507243103. [DOI] [PMC free article] [PubMed] [Google Scholar]
- Sun Z, Zhang S, Chan JY, Zhang DD. Keap1 controls postinduction repression of the Nrf2-mediated antioxidant response by escorting nuclear export of Nrf2. Mol Cell Biol. 2007;27:6334–6349. doi: 10.1128/MCB.00630-07. [DOI] [PMC free article] [PubMed] [Google Scholar]
- Tan KP, Yang M, Ito S. Activation of nuclear factor (erythroid-2 like) factor 2 by toxic bile acids provokes adaptive defense responses to enhance cell survival at the emergence of oxidative stress. Mol Pharmacol. 2007;72:1380–1390. doi: 10.1124/mol.107.039370. [DOI] [PubMed] [Google Scholar]
- Trounce I, Neill S, Wallace DC. Cytoplasmic transfer of the mtDNA nt 8993 T - >G (ATP6) point mutation associated with Leigh syndrome into mtDNA-less cells demonstrates cosegregation with a decrease in state III respiration and ADP/O ratio. Proc Natl Acad Sci USA. 1994;91:8334–8338. doi: 10.1073/pnas.91.18.8334. [DOI] [PMC free article] [PubMed] [Google Scholar]
- Vicens M, Medarde M, Macias RI, Larena MG, Villafaina A, Serrano MA, et al. Novel cationic and neutral glycocholic acid and polyamine conjugates able to inhibit transporters involved in hepatic and intestinal bile acid uptake. Bioorg Med Chem. 2007;15:2359–2367. doi: 10.1016/j.bmc.2007.01.027. [DOI] [PubMed] [Google Scholar]
- Vollrath V, Wielandt AM, Iruretagoyena M, Chianale J. Role of Nrf2 in the regulation of the Mrp2 (ABCC2) gene. Biochem J. 2006;395:599–609. doi: 10.1042/BJ20051518. [DOI] [PMC free article] [PubMed] [Google Scholar]
- Zylber E, Vesco C, Penman S. Selective inhibition of the synthesis of mitochondria-associated RNA by ethidium bromide. J Mol Biol. 1969;44:195–204. doi: 10.1016/0022-2836(69)90414-8. [DOI] [PubMed] [Google Scholar]
Associated Data
This section collects any data citations, data availability statements, or supplementary materials included in this article.


