

Abstract
Food webs are networks of species that feed on each other. The role that within-population phenotypic and genetic variation plays in food web structure is largely unknown. Here, I show via simulation how variation in two key traits, growth rates and phenology, by influencing the variability of body sizes present through time, can potentially affect several structural parameters in the direction of enhancing food web persistence: increased connectance, decreased interaction strengths, increased variation among interaction strengths and increased degree of omnivory. I discuss other relevant traits whose variation could affect the structure of food webs, such as morphological and additional life-history traits, as well as animal personalities. Furthermore, trait variation could also contribute to the stability of food web modules through metacommunity dynamics. I propose future research to help establish a link between within-population variation and food web structure. If appropriately established, such a link could have important consequences for biological conservation, as it would imply that preserving (functional) genetic variation within populations could ensure the preservation of entire communities.
Keywords: ecological networks, food web robustness and stability, genetic variation and diversity, growth rate and phenology, individual variation, multivariate phenotypes
1. Introduction
Community genetics addresses the question of how, and to what extent, within-population genetic variation may affect ecological processes, including the outcome of interactions among species. Usually, when community genetics studies extend beyond one trophic level, these focus on how genetic variation among herbivores or their host plants affects herbivore performance [1,2] or on the bottom-up effects of plant genetic variation on herbivore and predatory arthropods ([3–5]; reviewed in [6,7]). One exceptional study, however, focused on genetic variation in a ladybird predator [8], and how an indirect effect of plants mediated by the ladybird's prey (aphids) could affect the phenotype and performance of different ladybird genotypes, demonstrating genetic variation in the response of ladybird traits to an indirect ecological (bottom-up) effect. However, research on how, and whether, genetic variation within predator populations affects ecological processes is greatly needed.
Food webs are networks of interacting species that feed on each other. Predator–prey interactions are central in understanding the mechanisms behind food web dynamics, and genetic variation in both predators and prey could largely explain these dynamics. For instance, genetic variation and rapid adaptive evolution can dampen population fluctuations in predator–prey systems [9,10]. However, beyond rapid evolution, there is almost no information on how genetic ariation in predator traits affects food web dynamics at ecological time scales. Trophic polymorphisms are widespread, for instance, among fish [11–13] and this polymorphic variation may be genetically driven [14]. However, the ecological consequences of these polymorphisms have rarely been studied (but see [15,16]). In particular, how within-population genetic variation in traits that affect predator–prey interactions could determine food web structure in ways that could enhance its robustness and stability, is largely unknown. In this paper, I propose a series of traits whose variation has the potential to affect food web structure, and provide a series of ideas for how these structural changes could affect food web dynamics, as well as the robustness and the stability of these ecological networks. I use simple computer simulations to document the potential effect of trait variation on food web structure and provide a framework for future research. I argue that explicitly considering genetic variation of traits within populations can serve to link the preservation of variation in populations to the preservation of entire ecological networks and metacommunities.
(a). Food web structure, robustness and stability
The relatively wide diet of generalist predators can greatly shape the structure of food webs and the subsequent dynamics of these widespread ecological networks [17–21]. One important feature of generalist predators that may strongly shape food web structure is intraguild predation (IGP; [22,23]), by which potential competitors that share prey kill and consume each other. As conspecifics share the same resource requirements (i.e. they belong to the same guild), cannibalism, or intraspecific predation, is similar to IGP (e.g. [24]). This type of predation confers upon food webs a high degree of omnivory—i.e. when predators feed on more than one trophic level—and may even lead to feeding loops in food webs—the shortest loop is reciprocal IGP between pairs of species [25]. Widespread omnivory of generalist predators can in turn modify another two key food web structural properties: the distribution of interaction strengths and connectance. Interaction strength may be roughly defined as the effect of one population on another (see [26] for a review), while a measure of connectance would be the proportion of all possible links that are realized [27]. Understanding the structure of food webs in terms of connectance, the degree of omnivory, the strength of interactions and its variation across species, as well as the length and density of loops, is crucial to understanding what drives food web dynamics, robustness and stability (e.g. [20,28–34]; but see [35–40]).
(b). The traits: growth rates and phenology versus body size
One of the most important traits that explains ‘who eats whom’ in many food webs is body size [21]. Successful predation may largely depend on the body size ratio between the predator and the potential prey, predation being more likely to occur at larger ratios [41]. This causes diets to be highly nested within food webs, with the diet of smaller generalist predators nested within the diet of larger ones [21]. In addition, since in natural communities, larger animals are usually less abundant [42], larger top predators are much less abundant than intermediate or basal species [21,43]. These differences in abundances must probably affect the strength of interactions [26]. Also, predator–prey body size ratios are positively associated to interaction strengths [44,45] and can thus be linked to food web stability in turn; with larger ratios leading to more stable food webs [46]. However, as species embedded in food webs have ontogenies and growth, body size is a highly dynamic trait that will change through the ontogeny of every single individual. Thus, when one aims to investigate the role of trait genetic variation on food web dynamics, (adult) body size is not an appropriate trait, as it will only include a snapshot of the interactions experienced by each species in the food web.
Here, I argue that to study the role of genetic variation in food web structure, we should focus on two key traits whose genetic variation may largely affect food web structure and dynamics, growth rates and phenology (e.g. emergence date). Genetic variation for intrinsic growth rates has been widely documented (reviewed in [47]), even for generalist predators [48,49]. As body size changes with ontogeny, genetic variation in growth rates leads to variation in body size ratios between predators and prey, and may thus determine ‘who eats whom’ as the season progresses. Similarly, traits that are genetically variable and are related to phenology independently of growth rate (such as hatching time—e.g. [50]) will determine the distribution of body sizes through time and thus influence feeding interactions. Hence, higher genetic variation in growth rates and phenology can expand the diet breadth of populations and thus modify the entire structure of food webs, potentially affecting the robustness and the stability of these ecological networks.
(c). Can genetic variation in growth rates and phenology contribute to food web structure?
The amount of genetic variation among interacting populations can increase the chances of coexistence [7,51,52]. Similarly, increased genetic variation in growth rates and phenology can hypothetically change the structure of the food web, i.e. increasing connectance and changing the distribution of interaction strengths, by continuously changing the ratio of body sizes between predators and prey through the season (figure 1). Additionally, higher genetic variation in growth rates expands the window for intraspecific predation (cannibalism), as the ratio of body sizes between the fastest and the slowest growing genotypes will be sufficiently high through a longer period during the growing season (figure 1).
Figure 1.

Growth rates of predator populations embedded in a food web. Solid lines represent the growth rate range for a population with high variation of growth rates. Dashed lines represent a population with lower genetic variation. The asterisk shows the average size of another predator species in the community (the growth curve has been omitted for simplicity). Following equation (2.1) and taking R = 2, the population with high genetic variation in growth rates will have sufficiently high predator–prey ratios (solid, double-headed arrows), for both predating upon the asterisk species and being predated by it, while the population with low genetic variation (dashed, double-headed arrows) will not be able to trophically interact with the asterisk species. Furthermore, when high genetic variation in growth rates is present, predator–prey ratios will also involve a higher opportunity for intraspecific predation (cannibalism), which is represented here by the distance between the two grey solid vertical lines. The space between the two grey dotted vertical lines represents the lower opportunity for intraspecific predation when low genetic variation in growth rates is present. A growth rate, mortality trade-off is also apparent by the shorter lifespans of individuals with genotypes determining faster growth rates. Including genetic variation in phenology involved establishing high or low variation in the timing of the season in which minimum body sizes were present (i.e. around the x-axis).
Below, I use computer simulations to investigate whether realistic amounts of variation in growth rates and phenology within an intermediate consumer can potentially affect (i) the number of trophic links that this consumer holds with other species in the web; (ii) the magnitude and variability of interaction strengths for these links; and also (iii) the degree of cannibalism (omnivory).
(d). Genetic variation in growth rates
(i). Method
For simplicity, I assume that all variation in growth rates has a (quantitative) genetic basis. However, some of the predictions may apply equally well to environmentally driven phenotypic variation. Nevertheless, this is just a preliminary investigation of how genetic variation within a food web can contribute to determine its structure. What I investigate in this paper is merely how variation in growth rates and phenology (see below) may contribute to change the predator–prey ratios through the season, and how this may widen or narrow the window for predation. With this information, and based on predator–prey body size ratios, I then estimate the potential of a population to establish links with other populations in the food web, as well as how strong and variable these links could potentially be.
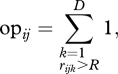
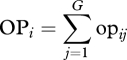
I simulated a population (hereafter, the target population) of generalist predators with high genetic variation in growth rates (20 genotypes differing in growth rates and/or phenology, see below) and another with low genetic variation in growth rates (20 genotypes differing less among each other). Each target population was simulated to be embedded in a complex food web, interacting with other generalist predators (20 species, see below). For each predator–genotype pair, I then estimated what I call the opportunity for predation (opij). For i = 1 to L, j = 1 to G and k = 1 to D, where L is the number of species with which the target population can potentially be linked (i.e. those species for which OPi in equation (2.2) below is higher than zero), G is the number of genotypes in the target species (20 in these simulations) and D is the season length (in days); and taking rijk as the body size ratio between species i and genotype j at day k,
 |
2.1 |
 |
2.2 |
 |
2.3 |
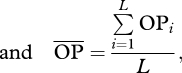
where R is the minimum predator–prey body size ratio beyond which predation will occur (figure 1). I ran simulations with four values of R (1, 2, 3 or 4), which lay well within the natural range of predatory–prey interactions for invertebrates [41]. Two values were obtained, one for the target species acting as predator (an estimate of the room for generality—number of prey species consumed—using the genotype/species ratio rjik instead) and another for the target species acting as prey (an estimate of the room for vulnerability—number of consuming predator species—using rijk). Since more days in the season having the opportunity to feed on each other increases the chances of predation, this opportunity for predation can be thought of as an estimate of the potential interaction strength between two members of the food web. However, as interaction strength will also depend on the relative abundances of each predator and prey (e.g. [26,53,54]), to better approach true potential interaction strengths, I also calculated the relative opportunity for predation (ropij), for which I multiplied each opportunity for predation (opij) by the abundance predator/prey ratio (ai/aj) and then calculated ROPi and  as OPi and
  above (equations (2.2) and (2.3), respectively). For simplicity, I assumed that all genotypes in the target population were equally abundant. Furthermore, as variation in interaction strengths can also be important for determining food web stability, with a few strong and many weak interactions determining stability [29], I also calculated the across-species coefficient of variation for both the opportunity for predation (CV-OP) and the relative opportunity for predation (CV-ROP).
For simulations, I use abundance and body size data obtained from the community of arthropod generalist predators of a deciduous forest-floor food web in Central Kentucky, USA [55]. For simplicity, I include only the 20 more abundant taxonomic groups (>0.2 m−2). Most of these predators (18) are spiders, a group of generalist predators for which the foraging biology is quite well known (e.g. [24,56,57]) and for which genetic variation in growth rates has been previously documented [49]. The other two predators are centipedes (Lithobiomorpha or Scolopendromorpha—further details can be found in the study of [55]). Only a relatively small set of interactions has been experimentally solved for this food web (e.g. [55,58,59]). However, as spiders are known to be intraguild predators that readily feed on each other if size differences are large enough, here I assume as a first approximation, that the body size ratio is the only predatory constraint. Thus, all generalist predators in this web should be able to feed on each other if size differences are large enough.
I simulated variation in growth rates for a predator of intermediate body size at maturation (Xysticus, the spider ranked 10—over 20—for adult body size). For simplicity, I assumed that all predators were univoltine. This assumption does not probably hold, as some groups show overlapping generations and a single peak of adult emergence (J. Moya-Laraño 2000–2002, personal observations), thus strongly suggesting that some species in this forest-floor food web take more than 1 year to mature. However, assuming growth to maturation in a single year, probably included roughly the same body size stages as including real growth trajectories and the different overlapping generations. The only thing that probably changed was the timing at which each instar was present in every stage of the season. Unfortunately, we lack the necessary information to include real phenologies and growth rates. However, to test the robustness of the results and to add a second (orthogonal) axis of genetic variation, I also simulated the effect of variation in phenology (see below).
Since, to my knowledge, there are no published accounts of growth trajectories in Xysticus, I here use the published curves for the wandering spider Pardosa prativaga from Northern Europe [60] and fitted the following three-parameter logistic curve to the two most extreme growth curves (the slowest and the fastest):
| 2.4 |
where s is size, smax is the maximum asymptotic body mass, t is age in days, and b and x0 are the logistic parameters fitted. I chose to fit this equation because a close to perfect fit (i.e. r2 > 0.97) be could easily achieved and only three parameters needed to be used to simulate variation (instead of the four-parameter Von Bertalanffy equation [61], which in addition is not appropriate for arthropods [62]). In any case, whatever the fitted equation, what matters for the present simulations is the shape of the curves, which are based on real growth trajectories.
I simulated high genetic variation in 20 genotypes by taking the average parameters of the curves (b and x0 in eqn 1 from [60], see above) and calculating 20 random growth curves with parameters b ± s.d. = −2.8 ± 0.05 and x0 ± s.d. = 53.3±5, where b and x0 follow normal distributions. To approximate real phenologies, I matched average body sizes around 15 July (the approximate time of the year when Moya-Laraño & Wise's [55] data were collected). The assymptotic body size parameter smax was set to the maximum body size recorded in the field for Xysticus (smax ± s.d. = 12.4 ± 5 for high genetic variation). Body size was approximated to body mass by inputting body length in published equations for spiders and centipedes [63]. I introduced a trade-off between lifespan and growth rate [64,65], by first obtaining the longevity (l) of each of the 20 genotypes (l ± s.d. = 180 ± 15) and then subtracting twice the body size at maturation from that value. The population with low genetic variation had half the variation in all parameters: b ± s.d. = −2.8 ± 0.025, x0 ± s.d. = 53.3±2.5, smax ± s.d. = 12.4 ± 2.5 and l ± s.d. = 180 ± 7.5, including longevity, which was necessary in order to include similar growth rate/longevity trade-offs in both populations. For simplicity, I assume that all genotypes are born on the same day of the season and then tested the robustness of this assumption with additional simulations including variation in the phenology of emergence (see below). The adult body ranges for the populations with high and low genetic variations were (in milligrams): high, 3.6–20.6; low, 5.3–15.9. These ranges lay well within the intraspecific natural range of Xysticus species [66,67].
The growth curves for the community of 20 species of generalist predators were generated with identical b and x0 average parameters as above, while smax followed the maximum body size observed for each species (group) in Moya-Laraño and Wise's dataset. However, no genetic variation for these species was assumed and thus only one single curve was constructed for each species. All other procedures matched those of Xysticus, with the exception that since larger species live longer, I set across-species lifespans according to the equation: l = 3M0.2, where M is body mass [68]. The final range of adult body sizes was 0.3–98 mg.
Finally, to obtain opij and ropij, I contrasted the 20 curves of the high genetic variation population against the curves for the 20 species and did the same for the population with low genetic variation. Within each Xysticus population (high and low genetic variations), I also calculated the opportunity for intraspecific predation by contrasting the 20 genotype growth curves against each other.
(ii). Results
When a population of the spider Xysticus is embedded in a complex food web, the amount of genetic variation in growth rates can positively affect the number of potential links that the population establishes within the food web. However, this occurs only when Xysticus acts as predator (generality), not as prey (vulnerability, table 1). Furthermore, again only when Xysticus acts as predator, as the threshold of the predator–prey body size ratio for predation (R) increases, interactions have the potential to be much weaker ( in table 1) and much more variable (CV-ROP) in populations with high genetic variation. Actually, when R is as high as 3 or 4, these effects are very strong regardless of whether species abundances are taken into account or not (compare
  to
to  , and CV-OP to CV-ROP). In addition, the higher the amount of genetic variation of growth rates, the higher the potential for cannibalism (table 1). This last trend is also much stronger as R increases.
Table 1.
Results of a simulation emulating genetic variation in growth rates for Xysticus spiders embedded in a complex leaf-litter forest-floor food web.
| Ra | population | predator–preyb |  |
CV-OPd |  |
CV-ROPf | links | cannibalismg |
|---|---|---|---|---|---|---|---|---|
| 1 | high genetic variation | predator | 407.9 (5.6) | 56.6 | 2994 (4.3) | 109.1 | 13 | 30 575 (20.9) |
| prey | 1458.3 (20) | 60.7 | 443.3 (20.4) | 126.5 | 20 | |||
| low genetic variation | predator | 416.3 (5.7) | 62.9 | 3062.7 (4.4) | 127.9 | 12 | 31 646 (21.7) | |
| prey | 1479.2 (20.3) | 61.8 | 451.5 (20.7) | 127.2 | 20 | |||
| 2 | high genetic variation | predator | 247.8 (3.4) | 118.1 | 1176.1 (1.7) | 64.7 | 8 | 10 836 (7.4) |
| prey | 1358.8 (18.6) | 75.0 | 332.7 (15.3) | 131.0 | 20 | |||
| low genetic variation | predator | 277.5 (3.8) | 130.2 | 803.4 (1.1) | 106.2 | 6 | 2635 (1.8) | |
| prey | 1137.5 (15.6) | 82.2 | 336.7 (15.5) | 143.0 | 20 | |||
| 3 | high genetic variation | predator | 192.7 (2.6) | 156.5 | 530.7 (0.8) | 141.5 | 7 | 4282 (2.9) |
| prey | 937.6 (12.8) | 32.4 | 260.3 (12) | 129.2 | 20 | |||
| low genetic variation | predator | 455.7 (6.2) | 82.2 | 1159.9 (1.7) | 82.6 | 3 | 145 (0.1) | |
| prey | 870.4 (11.9) | 95.0 | 229.4 (10.5) | 127.5 | 20 | |||
| 4 | high genetic variation | predator | 285.5 (3.9) | 110.5 | 746.6 (1.1) | 106.5 | 4 | 1946 (1.3) |
| prey | 799.8 (11) | 94.8 | 211.7 (9.7) | 126.5 | 20 | |||
| low genetic variation | predator | 603.5 (8.3) | 13.7 | 1543.6 (2.2) | 13.6 | 2 | 0 (0) | |
| prey | 743.2 (10.2) | 108.0 | 188.6 (8.7) | 126.9 | 20 |
aPredator–prey body size ratio beyond which predation can occur.
bWhether Xysticus acts as potential predator (potential generality) or as potential prey (potential vulnerability).
cOpportunity for predation averaged across species pairs (see text). Shown between parentheses are percentage  relative to the maximum possible (i.e.
  = days in the season × number of genotypes = 365 × 20 = 7300).
dCoefficient of variation among OPis (see text).
eRelative opportunity for predation after accounting for species abundances (see text). Shown between parentheses is the percentage  relative to the maximum possible, the latter differing depending on whether the target population acts as predator or as prey (i.e. as predator,
 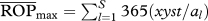 , where xyst is Xysticus abundance and al is the abundance of the lth predator; as prey,
  . These figures were 69 873 and 21 873, respectively.
fCoefficient of variation among ROPis (see text).
gIntraspecific opportunity for predation. Again, between parentheses is the percentage relative to the maximum (i.e. 365 days × 20 genoypes × 20 genotypes = 146 000).
Other results were less robust and thus not as relevant. When R is 2, interactions (Xysticus as predator) seem weaker ( ) and more variable (CV-ROP) in populations with low genetic variation in growth rates relative to populations with high genetic variation (table 1). However, this effect is probably the result of a synergistic effect of genetic variation in growth rates and the particular distribution of abundances of the species used in the simulations. Looking at
  and CV-OP, the picture changes substantially, even suggesting stronger interactions when genetic variation is low. Similarly, when Xysticus acts as prey and R is 3, interactions are potentially more variable (CV-OP) in the population with low genetic variation (table 1). However, after weighting for species abundances (CV-ROP), this difference disappeared.
(e). Genetic diversity. Adding a second axis of genetic variation: phenology
Below, I expand the simulations to a second trait, phenology, understood as the date in which the offspring emerges into the population. First, I simulate the potential effect of genetic variation in food web structure when phenology (emergence date) is tightly genetically and negatively correlated to growth rates. This implies that a faster growing genotype, that matures and reproduces early, will have early-hatching offspring. Second, I simulate variation in phenology as a completely independent (orthogonal) axis of variation relative to growth rates. Note that higher genetic variation in two orthogonal axes (growth rates and phenology) will translate into higher genetic diversity (e.g. genetic variation across orthogonal axes of variation—[69]; see also [70]) relative to the scenario of tight correlations between growth rate and phenology. Third, to contrast the effect of this trait with that of growth rate, I also simulate phenology as the only trait showing genetic variation.
(i). Method
The Xysticus population with high genetic variation included a hatching time window of 50 days, while the population with low genetic variation included a hatching time window of 27 days. These lay well within the window in hatching time observed for at least the spider Lycosa tarantula in nature, which can be as high as 98 days [71]. I ran these simulations only for R = 3 when Xysticus acts as predator and calculated L, ROP and CV-ROP, as this set of parameters was the most affected by genetic variation in growth rates. For the first scenario, tight genetic correlation between growth rates and phenology, I estimated hatching time (H) as: H = −2l/3 for the population with high genetic correlation and as H = −l, for the population with low genetic correlation (where l is longevity). To simulate orthogonal axes of variation (second scenario), I randomly permutated the hatching times among the 20 genotypes from the first scenario. For the third scenario (effect of phenology alone), I used the same H as in scenario 1, but set all genotypes to have identical (average) growth curves.
(ii). Results
Adding genetic variation in phenology has a dramatic effect on the potential number of links that Xysticus can establish as a predator (table 2), increasing from five (low genetic variation) to almost maximum of 17–19 (depending on the scenario) for the population with high genetic variation. When phenology is tightly correlated with growth rate, interactions have the potential to be 2× as strong with low genetic variation and 1.7× as variable with high genetic variation. When growth rates and hatching date are allowed to vary independently, this figure changes to 3.5× and 2.3×, respectively, suggesting additive effects of orthogonal axes of variation. When only variation in phenology was considered, the figure was intermediate (2.7× and 1.9×, respectively). Interestingly, adding phenological variation opened up the window for cannibalism in the population of low genetic variation (compared with table 1) and differences between populations of high and low genetic variation were not as high as for growth rates. Thus, the smallest variation in phenology may have profound effects on the opportunity for cannibalism.
Table 2.
Results of a simulation adding genetic variation in phenology (i.e. hatching or emergence date) to the genetic variation in growth rates of Xysticus (table 1). All simulations include R = 3 and are just for Xysticus acting as predator (potential generality). See table 1 for explanation of columns.
| type of between-trait covariation | population |  |
CV-ROP | links | cannibalism |
|---|---|---|---|---|---|
| phenology correlated with growth rates | high genetic variation | 583.2 (0.8) | 128.4 | 19 | 7921 (5.4) |
| low genetic variation | 1144.6 (1.6) | 76.2 | 5 | 4114 (2.8) | |
| phenology uncorrelated with growth rates | high genetic variation | 307.5 (0.4) | 196.0 | 18 | 5629 (3.9) |
| low genetic variation | 1066.6 (1.5) | 84.6 | 5 | 3149 (2.2) | |
| phenology alone | high genetic variation | 374.3 (0.5) | 179.2 | 17 | 3776 (2.6) |
| low genetic variation | 1002.6 (1.4) | 93.6 | 5 | 2791 (1.9) |
(f). Genetic variation can potentially contribute to food web structure
These simulations show how a generalist predator population embedded in a complex food web has the potential to prey on a greater number of predator species if genetic variation in growth rates and phenology within the population is relatively high. Furthermore, more genetic variation can decrease the average strength of predator–prey interactions and also increase the variation in interaction strengths across species pairs. These effects become much stronger as the threshold predator–prey body size ratio for predation to occur increases. Moreover, higher genetic variation in growth rates leads to an increase in the potential for cannibalism, particularly when the threshold body size ratio for predation increases. Variation in phenology can largely determine the number of established links in the food web and has the potential to act additively with growth rate to determine weaker and more variable (few strong, many weak) interactions. In addition, the slightest increase in phenological variation has a great impact on the potential for cannibalism. This is in agreement with recent findings that show how both family variation in growth rates and high variability in emergence date, can largely explain juvenile–juvenile body size ratios and juvenile–juvenile cannibalistic rates in a natural population [71]. However, neither variation in growth rates nor in phenology seems to affect the potential for vulnerability or its variability (see §5).
(g). Consequences for food web robustness and stability
The above results show how an increase in genetic variation within populations embedded in food webs can potentially increase the connectance of the web (number of links), and can decrease the average interaction strengths as well as increase the variability in interaction strengths (i.e. there are many weak and few strong interactions). Also, considering that cannibalistic individuals are more likely to feed on more than one trophic level, high genetic variation in growth rates can increase the degree of omnivory. Moreover, as the number of predator species that feed on Xysticus would remain maximum and unaltered with genetic variation (table 1), an increase in the number of predator species incorporated in the Xysticus diet as prey and a decrease in the average interaction strengths with increasing genetic variation, suggests that the number of weak and long feeding loops in the web can also increase with genetic variation. All these structural properties have been documented to increase the robustness [20,30,31,36,72] and the stability [28,29,32,38,39,72] of food webs. Interestingly, the effect of higher genetic variation can be more pronounced as predator–prey body size ratios increase. Thus, as higher ratios also lead to more stable food webs [46], all of the above effects could act synergistically to determine food web stability. It seems that an increase in genetic variation of growth rates and phenology within populations embedded in food webs has a strong potential to contribute to the robustness and the stability of naturally assembled food webs.
(h). Consequences for trophic cascades
Trophic level omnivory can dampen indirect ecological effects, such as trophic cascades, i.e. top predator indirect positive effects cascading down through the food web by the suppression or the frightening of intermediate predators [73]. The fact that the intraspecific opportunity for predation increases substantially with increasing genetic variation in both growth rates and emergence date, strongly suggests that high genetic variation may lead to sufficiently high levels of trophic level omnivory for dampening trophic cascades. Notice that stronger cannibalistic interactions with high genetic variation suggest that this could also be the case for intraguild predators belonging to different species when both have high genetic variation, and as long as species pairs are sufficiently similar in size. Thus, high genetic variation can potentially increase the interaction strength among similar-sized species—increasing the potential to dampen trophic cascades—while decreasing interaction strengths and increasing among-strength variability across trophic levels. The dynamics and balance of all these interactions will depend, among other things, on encounter rates, which will depend in turn on the spatial distribution and the relative abundances of each species.
2. Other potentially relevant traits: morphology, life history and animal personalities
Other traits that have not been simulated here could also potentially affect food web structure. For instance, some morphological traits may grow allometrically with body size, and may independently affect the outcome of predator–prey interactions, such as jaw and head dimensions for catching prey (e.g. [74]) and leg length to run faster (e.g. [75]), the latter allowing both escaping predators and capturing prey more efficiently. Similarly, genetic variation in diet breadth (independent of body size) should be included in future studies. Diet breadth has been documented to have a genetic basis [14]; it may be associated to morphological differences and it may be highly variable among individuals (e.g. [12]). Higher genetic variation in diet breadth could actually help top predators to stabilize different energy channels in food webs, which has been shown to increase food web stability [76].
Variation in life-history traits other than growth rate could affect food web structure. For instance, variation in propagule size could affect food web interactions. In simulations (figure 1), I have implicitly assumed that all species and genotypes have identical propagule (egg) sizes. However, substantial variation in propagule size has been documented both within and across taxa (e.g. [77]), and a positive correlation between female body size and propagule size has been well established across spider species [78]. Whether genetically correlated with female growth and body size or not, variation in propagule size could also contribute to the number (and strength) of links established by populations embedded in food webs, as affecting the body size ratio between the offspring and other members of the food web will indirectly affect offspring variation in vulnerability and generality.
Furthermore, growth rates may be linked to animal personalities [79,80], in the sense that faster growth rates may be genetically correlated to boldness (e.g. the degree of predation risk taken while foraging) and aggression (e.g. the degree to which encountered prey are attacked). Thus, animal personalities have the potential to play a central role in determining ‘who eats whom’ in food webs and thus in food web structure. First, genetically driven aggression can determine to what extent a predator will attack an encountered prey and, importantly, will positively explain growth rates. In addition, the more aggressive individuals in the population will attack prey at relatively lower predator–prey body size ratios, or will even attack potentially dangerous prey. Hence, populations with high genetic variation in aggression levels will include a wider range of individual types: those that attack prey more readily, and those that are less prone to attack relatively large or dangerous prey, thus potentially contributing to increase the number of links in the web by allowing intraspecific resource partitioning. Notice that despite the (genetic) correlation between growth rates and aggression, there is an aggression effect that would be independent of the effect of genetic variation in growth rates. Growing at different rates from differences in aggression can indirectly increase the connectance of the web by increasing the differences in body size between predators and prey. Thus, aggression may have two effects, one indirect by virtue of its genetic correlation with growth rates—and the subsequent increase in the range of body sizes within the population—and another, more direct, effect that confers variation in attack rates regardless of the predator–prey body size ratios. Another personality trait, boldness (as opposed to shyness) may also be positively correlated to growth rates [79], and genetic variation in boldness could also independently affect food web structure. Bold individuals will be more active at prey searching, and as a consequence they will be both more exposed to other predators and will find more prey, thus having the chance to establish more links with both predators and prey. Shy individuals, on the other hand, will search for prey less often and will therefore be at lower predation risk, having a lower diversity or predators that attack them (lower number of links). However, shy individuals will also encounter relatively fewer potential preys during their lifetimes and will have a lower chance to be choosy with what they eat. The net food web effect of having higher or lower genetic variation for boldness in populations could thus be a higher number of links established by resource partitioning (generality) between bold (picky by encountering a higher diversity of prey) and shy (tend to eat all they find). Similarly, in intermediate consumers, having high variation in boldness could promote resource-partitioning among their predator species, with some species feeding more likely on bold (mobile) individuals and other species feeding on the shy (sedentary) individuals, thus also contributing to increase the number of links (increase vulnerability).
Moreover, behavioural syndromes [81,82] show how aggression and boldness may be positively correlated, and how these two behavioural traits may even be correlated across contexts (e.g. generalist predators behaving in the same way when encountering a predator as when encountering a prey). Relative to tame and shy individuals, aggressive and bold individuals will be able to encounter a greater variety of prey and to attack more dangerous prey. Thus, both personality traits have the potential to act synergistically on intraspecific resource-partitioning.
However, although behavioural syndromes may constrain behavioural plasticity [81,82], fine-tuning context-dependent behaviour is also widespread (e.g. [83–87]), and thus the constraint imposed by the correlation between personality traits may be frequently overcome. Behavioural plasticity could even potentially allow individuals to escape from the correlation between personality traits and growth rates (see a few examples in table 1 of [79]). For instance, individuals could potentially behave boldly and aggressively when searching and encountering potential prey, and hide and behave shyly when they assess the risk of predation from the presence of predators in their home ranges. Moreover, rather than constraining behavioural plasticity, behavioural correlations may be the consequence of adaptive phenotypic plasticity [88]. Thus, the degree to which behaviour may be flexible or constitutive may have non-trivial consequences to food web structure. A few recent models have actually been very successful at predicting food web structure, robustness and stability by including adaptive flexible behaviour (both foraging and antipredatory) in food webs [89–93]. However, population dynamics in large food webs may be less dependent on behavioural flexibility than in small food webs [94]. Nevertheless, behavioural flexibility is actually at the core of behaviourally (or trait) mediated indirect interactions in food webs [95,96], by which the (indirect) effect of one species on a third species may depend on the behaviour of the second (intermediate) species. Thus, the genetic architecture of growth rates and personalities can affect both food web structure as well as indirect ecological effects in food webs (i.e. food web dynamics). Interestingly, recent findings show how past predatory pressure can actually determine the amount of genetic variation in the expression of personality behaviours [97], which implies that, in the context of predator–prey interactions, flexible behaviour and animal personalities are also heritable [98]. Clearly, future research should investigate the role that genetic variation in animal personalities has on food web structure and dynamics.
In summary, there are a number of traits (life history, morphological, behavioural) whose genetic variation has the potential to greatly affect food web structure and dynamics. Different traits may affect food web structure either synergistically, by virtue of strong between-trait genetic and phenotypic correlations, or additively (i.e. independently of each other), as suggested by the above results for growth rates and phenology. Thus, both genetic variation and genetic diversity (across axes of variation in multivariate phenotypes) should be considered. Whether flexible or constitutive, the role that multivariate phenotypic variation plays in food web structure should be investigated both theoretically and empirically.
3. Consequences of indirect genetic effects in food webs
Genetic variation can also act indirectly, by which the genetics of an individual can potentially change the expression of genes in another individual with which it is interacting. These indirect genetic effects [99,100] can potentially have important effects in food webs. In particular, non-lethal predator–prey interactions have important fitness consequences on prey [101] and can thus be affected by interspecific indirect genetic effects (IIGEs). For instance, the persistent presence of the most genetically aggressive and bold individuals of a predator population may change the behaviour of the frightened consumers by either forcing a decrease in their activity and metabolic rates, or forcing their emigration to safer habitat patches. This change of genetic expression can then have important consequences on basal resources, increasing owing to the lack of consumption by the frightened consumers (i.e. a trait-mediated indirect interaction—see above). Thus, indirect genetic effects could potentially trigger indirect ecological effects and in turn modify the structure of the food web.
4. Consequences of genetic variation for metacommunity dynamics of food webs
A metacommunity is a set of communities linked by dispersal of the multiple species that integrate them [102], and the process of extinction–colonization in/of patches by each species governs the dynamics of metacommunities [103]. The spatial dynamics of food webs has been typically studied using food web modules; e.g. a three-trophic food chain embedded in a more complex food web. In general, the spatial dynamics of food web modules depend on the complexity of the module and on the mobility of the different trophic levels [104]. For instance, a top predator in a food web module including a basal species and an intermediate consumer, will persist if [105]:
 |
4.1 |
where h1 is the proportion of suitable patches in the landscape for the basal species, and ek and ck are the extinction and colonization rates of the basal species (k = 1), the intermediate consumer (k = 2) and the top predator (k = 3). If the three species are predators with nested diets (as is likely the case in modules of the food web of the above simulations), populations of basal species with higher genetic variation for different traits could be able to establish in a wider number of patches, thus increasing h1 and the chances that the top predator persists in the metacommunity. Furthermore, with increasing genetic variation, any species in the food web module could increase its chances to colonize new patches because they would hold the potential to establish food web links with a higher number of other prey species (generalization) outside the module. Low genetic variation, on the other hand, would increase the chances of local extinction by a lack of generality (e.g. lack of including individuals with genotypes that allow feeding on alternative prey outside the module). In general, populations holding higher amounts of genetic variation in traits that are central to food web interactions will be more able to persist in metacommunities by the higher chance of holding genotypes which will successfully establish new food web links upon arrival to novel patches. Additionally, with increasing genetic variation, an increase of the probability for arriving species to establish more links should feed back to the entire network, increasing the chances of the interconnected species to persist locally (i.e. increased robustness). This should be more relevant when metacommunity dynamics is driven by mass effects [106], and relatively large numbers of individuals arrive to novel patches, thus allowing the environment (i.e. the established food web) to filter the arriving genotypes. Even if these genotypes sink in the arrival patch (i.e. do not reproduce), they could still establish temporary links that could momentarily help the entire network.
5. Future directions
My preliminary results suggest that reasonable amounts of variation in growth rates and phenology within populations can shape food web structure. However, several of the assumptions made may not hold for naturally assembled food webs and some of them may even have important consequences for the results obtained. For instance, phenotypic variation in growth rates and phenology is not only genetic, but has a strong environmental component as well (e.g. food availability and/or quality—[49,60,71]). However, as environmental effects on genetic expression can also be heritable (e.g. [97,98,107]), and as phenotypic variation may have such profound effects on food web structure and dynamics, investigating the effect of phenotypic and individual variation in food webs seems promising. Actually, the biotic environment can have strong effects on phenotypic plasticity, particularly in predator–prey interactions [108,109].
Furthermore, growth rates and phenologies are probably more variable among species than has been simulated here, as some of the species in the food web are not univoltine but instead take more than 1 year to mature. For instance, the parameters x0 and b in equation (2.4), which were assumed to be the same for all predator species, likely change substantially from species to species. Information on real growth rates and phenologies, and how they vary within species, is necessary to understand better the effect of genetic variation in food webs.
As some of the above assumptions could be unrealistic, to test for the generality of these findings I simulated two different amounts of genetic variation in three other species/groups in the food web above (the largest, Agelenopsis; the second smallest, Erigoninae and another intermediate predator, the centipede Lithobius) and contrasted them with the other species in the food web, assuming, as with Xysticus, no genetic variation in the other species. The results were qualitatively consistent with the above simulations (not shown). However, understandably, the results were sensitive to the threshold ratio (R) at which the same qualitative effects as with Xysticus were found. Interestingly, the room for vulnerability (or its variability) did not covary with genetic variation in any of the species. Further work with other food webs is needed to test for the generality of this last finding.
Recent food web models have been successful in predicting the stability and the robustness of food webs [20,28–32,36,38,39,72,110] and some even include body size as a central trait (e.g. [46,89,93]). Most recently, two models have been successful in using foraging theory and individual behaviour subject to metabolic constraints to predict food web complexity [89,93]. One of these papers [93] calls for the need to add new traits to food web models. Explicitly including growth rates, phenology and the other traits mentioned above, as well as individual variation around them, could improve the predictive capabilities of food web models.
The assumption made here that body size and abundance are the only constraints to determine ‘who eats whom’ in the food web is probably too simplistic. Although it served as a first approximation to uncover how the amount of genetic variation could affect the potential generality and vulnerability of an intermediate predator embedded in a poorly solved food web, more realistic approximations are needed. For instance, allometric metabolic constraints [111] and other body allometric constraints such as energy content of potential prey, predator attack rate and handling time, will largely determine the efficiency of individuals depending on their size [93]. Faster growing individuals could either be metabolically less efficient, expending more energy per unit of growth, particularly if growth rate is correlated with boldness and aggression, or could attain faster growth rates by increased assimilation efficiency (i.e. the proportion of ingested mass that is successfully converted into own mass). Defences others than size and the spatial distribution of the different species, will also affect ‘who eats whom’. Therefore, all these parameters should be considered in future studies addressing the question of how genetic variation may affect food web structure and dynamics.
Future analytical and simulation models should consider how phenotypic and genetic variation and diversity (e.g. multivariate phenotypes including a few traits) in one or in several of the species embedded in food webs may affect the structure, dynamics, robustness and stability of the network. These models should include metabolic constraints, demographic parameters and basal resources. Furthermore, models should be developed to test some of the ideas outlined above, such as (i) the effect of increased genetic variation on trophic level omnivory and the subsequent dampening of trophic cascades, (ii) how genetic variation may affect metacommunity dynamics, and (iii) what is the role of indirect genetic effects in food web dynamics. Spatially explicit individual (or agent)-based models [112] are a promising tool to tackle this complexity. However, an important previous and non-trivial task will be to gather the necessary data for model parametrization.
Albeit tedious, the role of genetic variation in natural (or artificial) food webs can also be nicely addressed experimentally. Focusing on a target species (e.g. an intermediate predator), one can use quantitative genetic designs (e.g. half-sib designs—[107]) to create replicated experimental food webs (e.g. in mesocosms) or food web modules that include different amounts of genetic variation for some of the traits described above. Ideally, the heritability of these traits should be measured prior to (or during) experimentation, for which the same quantitative genetic design as above (and even individuals of the same families) could be used. One should then test whether food web structure changes and how this determines its dynamics, not only at the level of direct interactions on the target species, but also at the level of indirect interactions, as it is very likely that the effect propagates through the web (e.g. increased genetic variation dampening trophic cascades). Solving food webs quantitatively is not an easy task [113–115]. However, as modern molecular techniques [116] are being developed, this endeavour is becoming increasingly more feasible. Finally, and ideally, variations of the above experiments, complemented with computer simulations, could also be used to assess the robustness and stability of experimental webs holding different amounts of genetic variation within their interacting species.
6. Conclusion
Genetic variation in growth rates and phenology within intermediate predators embedded in food webs can potentially affect crucial parameters that are key to ensuring the robustness and stability of the food web, namely connectance, the distribution of interaction strengths, omnivory and looping. Future studies should incorporate a larger number of traits (e.g. multivariate phenotypes), and use more realistic food web data in individual-based models that seek to investigate the dynamics of different food webs. Analytical models and experimental tests are also greatly needed.
Importantly, if a link between genetic variation and food web robustness and stability is established, this would involve a novel way to link genetic variation and diversity to the maintenance of species in communities (see [7,52] for reviews). Hence, maintaining functional genetic diversity within populations may have important consequences not only for the maintenance of the target species, but also for the maintenance of the entire tangled web in which this species is embedded. This has relevant implications in conservation biology, as it would add an important new reason to preserve genetic diversity within species.
Acknowledgements
I thank A. Rossberg, J. Bascompte, R. Vaclav, D. Vinković and two anonymous reviewers for helpful comments on previous drafts of the manuscript. I discussed some of the ideas in this article with M. Montserrat and J. M. Montoya. This work has been partially funded by grant FEDER 020/2008 from the Spanish Ministry for the Environment and by NSF grant DEB-9815842 to D. H. Wise.
Footnotes
One contribution of 13 to a Theme Issue ‘Community genetics: at the crossroads of ecology and evolutionary genetics’.
References
- 1.Ferrari J., Scarborough C. L., Godfray H. C. J. 2007. Genetic variation in the effect of a facultative symbiont on host-plant use by pea aphids. Oecologia 153, 323–329 10.1007/s00442-007-0730-2 (doi:10.1007/s00442-007-0730-2) [DOI] [PubMed] [Google Scholar]
- 2.Tétard-Jones C., Kertesz M. A., Gallois P., Preziosi R. F. 2007. Genotype-by-genotype interactions modified by a third species in a plant–insect system. Am. Nat. 170, 492–499 10.1086/520115 (doi:10.1086/520115) [DOI] [PubMed] [Google Scholar]
- 3.Bailey J. K., Wooley S. C., Lindroth R. L., Whitham T. G. 2006. Importance of species interactions to community heritability: a genetic basis to trophic-level interactions. Ecol. Lett. 9, 78–85 10.1111/j.1461-0248.2005.00844.x (doi:10./j.1461-0248.2005.00844.x) [DOI] [PubMed] [Google Scholar]
- 4.Crutsinger G. M., Cadotte M. W., Sanders N. J. 2009. Plant genetics shapes inquiline community structure across spatial scales. Ecol. Lett. 12, 285–292 10.1111/j.1461-0248.2009.01288.x (doi:10.1111/j.1461-0248.2009.01288.x) [DOI] [PubMed] [Google Scholar]
- 5.Johnson M. T. J. 2008. Bottom-up effects of plant genotype on aphids, ants, and predators. Ecology 89, 145–154 10.1890/07-0395.1 (doi:10.1890/07-0395.1) [DOI] [PubMed] [Google Scholar]
- 6.Haloin J. R., Strauss S. Y. 2008. Interplay between ecological communities and evolution review of feedbacks from microevolutionary to macroevolutionary scales. Ann. NY Acad. Sci. 1133, 87–125 10.1196/annals.1438.003 (doi:10.1196/annals.1438.003) [DOI] [PubMed] [Google Scholar]
- 7.Hughes A. R., Inouye B. D., Johnson M. T. J., Underwood N., Vellend M. 2008. Ecological consequences of genetic diversity. Ecol. Lett. 11, 609–623 10.1111/j.1461-0248.2008.01179.x (doi:10.1111/j.1461-0248.2008.01179.x) [DOI] [PubMed] [Google Scholar]
- 8.Astles P. A., Moore A. J., Preziosi R. F. 2005. Genetic variation in response to an indirect ecological effect. Proc. R. Soc. B 272, 2577–2581 10.1098/rspb.2005.3174 (doi:10.1098/rspb.2005.3174) [DOI] [PMC free article] [PubMed] [Google Scholar]
- 9.Yoshida T., Ellner S. P., Jones L. E., Bohannan B. J. M., Lenski R. E., Hairston N. G. 2007. Cryptic population dynamics: rapid evolution masks trophic interactions. PLoS Biol. 5, 1868–1879 10.1371/journal.pbio.0050235 (doi:10.1371/journal.pbio.0050235) [DOI] [PMC free article] [PubMed] [Google Scholar]
- 10.Yoshida T., Jones L. E., Ellner S. P., Fussmann G. F., Hairston N. G. 2003. Rapid evolution drives ecological dynamics in a predator–prey system. Nature 424, 303–306 10.1038/nature01767 (doi:10.1038/nature01767) [DOI] [PubMed] [Google Scholar]
- 11.Langerhans R. B., Layman C. A., Langerhans A. K., Dewitt T. J. 2003. Habitat-associated morphological divergence in two Neotropical fish species. Biol. J. Linn. Soc. 80, 689–698 10.1111/j.1095-8312.2003.00266.x (doi:10.1111/j.1095-8312.2003.00266.x) [DOI] [Google Scholar]
- 12.Quevedo M., Svanbäck R., Eklöv P. 2009. Intrapopulation niche partitioning in a generalist predator limits food web connectivity. Ecology 90, 2263–2274 10.1890/07-1580.1 (doi:10.1890/07-1580.1) [DOI] [PubMed] [Google Scholar]
- 13.Svanbäck R., Eklöv P., Fransson R., Holmgren K. 2008. Intraspecific competition drives multiple species resource polymorphism in fish communities. Oikos 117, 114–124 10.1111/j.2007.0030-1299.16267.x (doi:10.1111/j.2007.0030-1299.16267.x) [DOI] [Google Scholar]
- 14.Svanbäck R., Eklöv P. 2006. Genetic variation and phenotypic plasticity: causes of morphological and dietary variation in Eurasian perch. Evol. Ecol. Res. 8, 37–49 [Google Scholar]
- 15.Harmon L. J., Matthews B., Des Roches S., Chase J. M., Shurin J. B., Schluter D. 2009. Evolutionary diversification in stickleback affects ecosystem functioning. Nature 458, 1167–1170 10.1038/nature07974 (doi:10.1038/nature07974) [DOI] [PubMed] [Google Scholar]
- 16.Post D. M., Palkovacs E. P., Schielke E. G., Dodson S. I. 2008. Intraspecific variation in a predator affects community structure and cascading trophic interactions. Ecology 89, 2019–2032 10.1890/07-1216.1 (doi:10.1890/07-1216.1) [DOI] [PubMed] [Google Scholar]
- 17.Bascompte J., Melian C. J., Sala E. 2005. Interaction strength combinations and the overfishing of a marine food web. Proc. Natl Acad. Sci. USA 102, 5443–5447 10.1073/pnas.0501562102 (doi:10.1073/pnas.0501562102) [DOI] [PMC free article] [PubMed] [Google Scholar]
- 18.Closs G. P., Balcombe S. R., Shirley M. J. 1999. Generalist predators, interaction strength and food-web stability. Adv. Ecol. Res. 28, 93–126 10.1016/S0065-2504(08)60030-6 (doi:10.1016/S0065-2504(08)60030-6) [DOI] [Google Scholar]
- 19.Ings T. C., et al. 2009. Ecological networks: beyond food webs. J. Anim. Ecol. 78, 253–269 10.1111/j.1365-2656.2008.01460.x (doi:10.1111/j.1365-2656.2008.01460.x) [DOI] [PubMed] [Google Scholar]
- 20.Montoya J. M., Pimm S. L., Sole R. V. 2006. Ecological networks and their fragility. Nature 442, 259–264 10.1038/nature04927 (doi:10.1038/nature04927) [DOI] [PubMed] [Google Scholar]
- 21.Woodward G., Ebenman B., Emmerson M., Montoya J. M., Olesen J. M., Valido A., Warren P. H. 2005. Body size in ecological networks. Trends Ecol. Evol. 20, 402–409 10.1016/j.tree.2005.04.005 (doi:10.1016/j.tree.2005.04.005) [DOI] [PubMed] [Google Scholar]
- 22.Polis G. A., Holt R. D. 1992. Intraguild predation: the dynamics of complex trophic interactions. Trends Ecol. Evol. 7, 151–154 10.1016/0169-5347(92)90208-S (doi:10.1016/0169-5347(92)90208-S) [DOI] [PubMed] [Google Scholar]
- 23.Polis G. A., Myers C. A., Holt R. D. 1989. The ecology and evolution of intraguild predation: potential competitors that eat each other. Ann. Rev. Ecol. Syst. 20, 297–330 10.1146/annurev.es.20.110189.001501 (doi:10.1146/annurev.es.20.110189.001501) [DOI] [Google Scholar]
- 24.Wise D. H. 2006. Cannibalism, food limitation, intraspecific competition and the regulation of spider populations. Ann. Rev. Entomol. 51, 441–465 10.1146/annurev.ento.51.110104.150947 (doi:10.1146/annurev.ento.51.110104.150947) [DOI] [PubMed] [Google Scholar]
- 25.Polis G. A. 1991. Complex trophic interactions in deserts: an empirical critique of food-web theory. Am. Nat. 138, 123–155 10.1086/285208 (doi:10.1086/285208) [DOI] [Google Scholar]
- 26.Berlow E. L., et al. 2004. Interaction strengths in food webs: issues and opportunities. J. Anim. Ecol. 73, 585–598 10.1111/j.0021-8790.2004.00833.x (doi:10.1111/j.0021-8790.2004.00833.x) [DOI] [Google Scholar]
- 27.Gardner M. R., Ashby W. R. 1970. Connectance of large dynamic (cybernetic) systems: critical values for stability. Nature 228, 784. 10.1038/228784a0 (doi:10.1038/228784a0) [DOI] [PubMed] [Google Scholar]
- 28.McCann K., Hastings A. 1997. Re-evaluating the omnivory–stability relationship in food webs. Proc. R. Soc. Lond. B 264, 1249–1254 10.1098/rspb.1997.0172 (doi:10.1098/rspb.1997.0172) [DOI] [Google Scholar]
- 29.McCann K., Hastings A., Huxel G. R. 1998. Weak trophic interactions and the balance of nature. Nature 395, 794–798 10.1038/27427 (doi:10.1038/27427) [DOI] [Google Scholar]
- 30.Sole R. V., Montoya J. M. 2001. Complexity and fragility in ecological networks. Proc. R. Soc. Lond. B 268, 2039–2045 10.1098/rspb.2001.1767 (doi:10.1098/rspb.2001.1767) [DOI] [PMC free article] [PubMed] [Google Scholar]
- 31.Dunne J. A., Williams R. J., Martinez N. D. 2002. Network structure and biodiversity loss in food webs: robustness increases with connectance. Ecol. Lett. 5, 558–567 10.1046/j.1461-0248.2002.00354.x (doi:10.1046/j.1461-0248.2002.00354.x) [DOI] [Google Scholar]
- 32.Vandermeer J. 2006. Omnivory and the stability of food webs. J. Theor. Biol. 238, 497–504 10.1016/j.jtbi.2005.06.006 (doi:10.1016/j.jtbi.2005.06.006) [DOI] [PubMed] [Google Scholar]
- 33.May R. M. 1973. Stability and complexity in model ecosystems. Princeton, NJ: Princeton University Press [Google Scholar]
- 34.Montoya J. M., Sole R. V. 2002. Small world patterns in food webs. J. Theor. Biol. 214, 405–412 10.1006/jtbi.2001.2460 (doi:10.1006/jtbi.2001.2460) [DOI] [PubMed] [Google Scholar]
- 35.Tanabe K., Namba T. 2005. Omnivory creates chaos in simple food web models. Ecology 86, 3411–3414 10.1890/05-0720 (doi:10.1890/05-0720) [DOI] [Google Scholar]
- 36.Dunne J. A., Williams R. J. 2009. Cascading extinctions and community collapse in model food webs. Phil. Trans. R. Soc. B 364, 1711–1723 10.1098/rstb.2008.0219 (doi:10.1098/rstb.2008.0219) [DOI] [PMC free article] [PubMed] [Google Scholar]
- 37.Ingram T., Harmon L. J., Shurin J. B. 2009. Niche evolution, trophic structure, and species turnover in model food webs. Am. Nat. 174, 56–67 10.1086/599301 (doi:10.1086/599301) [DOI] [PubMed] [Google Scholar]
- 38.Neutel A. M., Heesterbeek J. A. P., van de Koppel J., Hoenderboom G., Vos A., Kaldeway C., Berendse F., de Ruiter P. C. 2007. Reconciling complexity with stability in naturally assembling food webs. Nature 449, 599–602 10.1038/nature06154 (doi:10.1038/nature06154) [DOI] [PubMed] [Google Scholar]
- 39.O'Gorman E. J., Emmerson M. C. 2009. Perturbations to trophic interactions and the stability of complex food webs. Proc. Natl Acad. Sci. USA 106, 13 393–13 398 10.1073/pnas.0903682106 (doi:10.1073/pnas.0903682106) [DOI] [PMC free article] [PubMed] [Google Scholar]
- 40.Jonsson T., Karlsson P., Jonsson A. 2006. Food web structure affects the extinction risk of species in ecological communities. Ecol. Model. 199, 93–106 10.1016/j.ecolmodel.2006.06.012 (doi:10.1016/j.ecolmodel.2006.06.012) [DOI] [Google Scholar]
- 41.Brose U., et al. 2006. Consumer-resource body-size relationships in natural food webs. Ecology 87, 2411–2417 10.1890/0012-9658(2006)87[2411:CBRINF]2.0.CO;2 (doi:10.1890/0012-9658(2006)87[2411:CBRINF]2.0.CO;2) [DOI] [PubMed] [Google Scholar]
- 42.Gaston K. J., Blackburn T. M., Lawton J. H. 1997. Interspecific abundance range size relationships: an appraisal of mechanisms. J. Anim. Ecol. 66, 579–601 10.2307/5951 (doi:10.2307/5951) [DOI] [Google Scholar]
- 43.Cohen J. E., Jonsson T., Carpenter S. R. 2003. Ecological community description using the food web, species abundance, and body size. Proc. Natl Acad. Sci. USA 100, 1781–1786 10.1073/pnas.232715699 (doi:10.1073/pnas.232715699) [DOI] [PMC free article] [PubMed] [Google Scholar]
- 44.Emmerson M. C., Montoya J. M., Woodward G. 2005. Body size, interaction strength, and food web dynamics. In Dynamic food webs (eds De Ruiter P. C., Wolters V., Moore J. C.), pp. 167–178 San Diego, CA: Academic Press [Google Scholar]
- 45.Emmerson M. C., Raffaelli D. 2004. Predator–prey body size, interaction strength and the stability of a real food web. J. Anim. Ecol. 73, 399–409 10.1111/j.0021-8790.2004.00818.x (doi:10.1111/j.0021-8790.2004.00818.x) [DOI] [Google Scholar]
- 46.Brose U., Williams R. J., Martinez N. D. 2006. Allometric scaling enhances stability in complex food webs. Ecol. Lett. 9, 1228–1236 10.1111/j.1461-0248.2006.00978.x (doi:10.1111/j.1461-0248.2006.00978.x) [DOI] [PubMed] [Google Scholar]
- 47.Arendt J. D. 1997. Adaptive intrinsic growth rates: an integration across taxa. Q. Rev. Biol. 72, 149–177 10.1086/419764 (doi:10.1086/419764) [DOI] [Google Scholar]
- 48.Heath D. D., Bernier N. J., Heath J. W., Iwama G. K. 1993. Genetic, environmental, and interaction effects on growth and stress-response of chinook salmon (Oncorhynchus tshawytscha) fry. Can. J. Fish. Aquat. Sci. 50, 435–442 10.1139/f93-049 (doi:10.1139/f93-049) [DOI] [Google Scholar]
- 49.Uhl G., Schmitt S., Schafer M. A., Blanckenhorn W. 2004. Food and sex-specific growth strategies in a spider. Evol. Ecol. Res. 6, 523–540 [Google Scholar]
- 50.Akimoto S. I. 1998. Heterogeneous selective pressures on egg-hatching time and the maintenance of its genetic variance in a Tetraneura gall-forming aphid. Ecol. Entomol. 23, 229–237 10.1046/j.1365-2311.1998.00127.x (doi:10.1046/j.1365-2311.1998.00127.x) [DOI] [Google Scholar]
- 51.Vellend M. 2006. The consequences of genetic diversity in competitive communities. Ecology 87, 304–311 10.1890/05-0173 (doi:10.1890/05-0173) [DOI] [PubMed] [Google Scholar]
- 52.Vellend M., Geber M. A. 2005. Connections between species diversity and genetic diversity. Ecol. Lett. 8, 767–781 10.1111/j.1461-0248.2005.00775.x (doi:10.1111/j.1461-0248.2005.00775.x) [DOI] [Google Scholar]
- 53.Berlow E. L., Dunne J. A., Martinez N. D., Stark P. B., Williams R. J., Brose U. 2009. Simple prediction of interaction strengths in complex food webs. Proc. Natl Acad. Sci. USA 106, 187–191 10.1073/pnas.0806823106 (doi:10.1073/pnas.0806823106) [DOI] [PMC free article] [PubMed] [Google Scholar]
- 54.Ruesink J. L. 1998. Variation in per capita interaction strength: thresholds due to nonlinear dynamics and nonequilibrium conditions. Proc. Natl Acad. Sci. USA 95, 6843–6847 10.1073/pnas.95.12.6843 (doi:10.1073/pnas.95.12.6843) [DOI] [PMC free article] [PubMed] [Google Scholar]
- 55.Moya-Laraño J., Wise D. H. 2007. Direct and indirect effects of ants on a forest-floor food web. Ecology 88, 1454–1465 10.1890/05-1474 (doi:10.1890/05-1474) [DOI] [PubMed] [Google Scholar]
- 56.Foelix R. F. 1996. Biology of spiders. Oxford, UK: Oxford University Press [Google Scholar]
- 57.Wise D. H. 1993. Spiders in ecological webs. Cambridge, UK: Cambridge University Press [Google Scholar]
- 58.Lensing J. R., Wise D. H. 2004. A test of the hypothesis that a pathway of intraguild predation limits densities of a wolf spider. Ecol. Entomol. 29, 294–299 10.1111/j.0307-6946.2004.00601.x (doi:10.1111/j.0307-6946.2004.00601.x) [DOI] [Google Scholar]
- 59.Wagner J. D., Wise D. H. 1996. Cannibalism regulates densities of young wolf spiders: evidence from field and laboratory experiments. Ecology 77, 639–652 10.2307/2265637 (doi:10.2307/2265637) [DOI] [Google Scholar]
- 60.Mayntz D., Toft S. 2001. Nutrient composition of the prey's diet affects growth and survivorship of a generalist predator. Oecologia 127, 207–213 10.1007/s004420000591 (doi:10.1007/s004420000591) [DOI] [PubMed] [Google Scholar]
- 61.Von Bertalanffy L. 1960. Principles and theory of growth. In Fundamental aspects of normal and malignant growth (ed. Nowinski W. W.), pp. 137–259 Amsterdam, The Netherlands: Elsevier [Google Scholar]
- 62.Zotin A. A. 2006. Equations describing changes in weight and mass-specific rate of oxygen consumption in animals during postembryonic development. Biol. Bull. 33, 323–331 10.1134/S1062359006040029 (doi:10.1134/S1062359006040029) [DOI] [Google Scholar]
- 63.Hódar J. A. 1996. The use of regression equations for estimation of arthropod biomass in ecological studies. Acta Oecol. 17, 421–433 [Google Scholar]
- 64.Biro P. A., Abrahams M. V., Post J. R., Parkinson E. A. 2006. Behavioural trade-offs between growth and mortality explain evolution of submaximal growth rates. J. Anim. Ecol. 75, 1165–1171 10.1111/j.1365-2656.2006.01137.x (doi:10.1111/j.1365-2656.2006.01137.x) [DOI] [PubMed] [Google Scholar]
- 65.Mangel M., Stamps J. 2001. Trade-offs between growth and mortality and the maintenance of individual variation in growth. Evol. Ecol. Res. 3, 583–593 [Google Scholar]
- 66.Kaston B. J. 1981. Spiders of Connecticut. Hartford, CT: Department of Environmental Protection, State Geological and Natural History Survey of Connecticut [Google Scholar]
- 67.Morse D. H. 1983. Foraging patterns and time budgets of the crab spiders Xysticus emertoni Keyserling and Misumena vatia (Clerck) (Araneae, Thomisidae) on flowers. J. Arachnol. 11, 87–94 [Google Scholar]
- 68.Speakman J. R. 2005. Body size, energy metabolism and lifespan. J. Exp. Biol. 208, 1717–1730 10.1242/jeb.01556 (doi:10.1242/jeb.01556) [DOI] [PubMed] [Google Scholar]
- 69.Schluter D. 2000. The ecology of adaptive radiation. Oxford, UK: Oxford University Press [Google Scholar]
- 70.Moya-Laraño J. 2010. Can temperature and water availability contribute to the maintenance of latitudinal diversity by increasing the rate of biotic interactions? Open Ecol. J. 3, 1–13 10.2174/1874213001003010001 (doi:10.2174/1874213001003010001) [DOI] [Google Scholar]
- 71.Rabaneda-Bueno R., Rodríguez-Gironés M. A., Aguado-De-La-Paz S., Fernández-Montraveta C., De Mas E., Wise D. H., Moya-Laraño J. 2008. Sexual cannibalism: high incidence in a natural population with benefits to females. PLoS ONE 3, e3484. 10.1371/journal.pone.0003484 (doi:10.1371/journal.pone.0003484) [DOI] [PMC free article] [PubMed] [Google Scholar]
- 72.Jonsson T., Karlsson P., Jonsson A. 2006. Food web structure affects the extinction risk of species in ecological communities. Ecol. Modell. 199, 93–106 10.1016/j.ecolmodel.2006.06.012 (doi:10.1016/j.ecolmodel.2006.06.012) [DOI] [Google Scholar]
- 73.Finke D. L., Denno R. F. 2005. Predator diversity and the functioning of ecosystems: the role of intraguild predation in dampening trophic cascades. Ecol. Lett. 8, 1299–1306 10.1111/j.1461-0248.2005.00832.x (doi:10.1111/j.1461-0248.2005.00832.x) [DOI] [Google Scholar]
- 74.Wyckmans M., Van Wassenbergh S., Adriaens D., Van Damme R., Herrel A. 2007. Size-related changes in cranial morphology affect diet in the catfish Clariallabes longicauda. Biol. J. Linn. Soc. 92, 323–334 10.1111/j.1095-8312.2007.00846.x (doi:10.1111/j.1095-8312.2007.00846.x) [DOI] [Google Scholar]
- 75.Bauwens D., Garland T., Castilla A. M., Vandamme R. 1995. Evolution of sprint speed in lacertid lizards—morphological, physiological, and behavioral covariation. Evolution 49, 848–863 10.2307/2410408 (doi:10.2307/2410408) [DOI] [PubMed] [Google Scholar]
- 76.Rooney N., McCann K., Gellner G., Moore J. C. 2006. Structural asymmetry and the stability of diverse food webs. Nature 442, 265–269 10.1038/nature04887 (doi:10.1038/nature04887) [DOI] [PubMed] [Google Scholar]
- 77.Fox C. W., Czesak M. E. 2000. Evolutionary ecology of progeny size in arthropods. Ann. Rev. Entomol. 45, 341–369 10.1146/annurev.ento.45.1.341 (doi:10.1146/annurev.ento.45.1.341) [DOI] [PubMed] [Google Scholar]
- 78.Marshall S. D., Gittleman J. L. 1994. Clutch size in spiders: is more better? Funct. Ecol. 8, 118–124 10.2307/2390120 (doi:10.2307/2390120) [DOI] [Google Scholar]
- 79.Biro P. A., Stamps J. A. 2008. Are animal personality traits linked to life-history productivity? Trends Ecol. Evol. 23, 361–368 10.1016/j.tree.2008.04.003 (doi:10.1016/j.tree.2008.04.003) [DOI] [PubMed] [Google Scholar]
- 80.Stamps J. A. 2007. Growth-mortality tradeoffs and ‘personality traits’ in animals. Ecol. Lett. 10, 355–363 10.1111/j.1461-0248.2007.01034.x (doi:10.1111/j.1461-0248.2007.01034.x) [DOI] [PubMed] [Google Scholar]
- 81.Sih A., Bell A., Johnson J. C. 2004. Behavioral syndromes: an ecological and evolutionary overview. Trends Ecol. Evol. 19, 372–378 10.1016/j.tree.2004.04.009 (doi:10.1016/j.tree.2004.04.009) [DOI] [PubMed] [Google Scholar]
- 82.Sih A., Bell A. M., Johnson J. C., Ziemba R. E. 2004. Behavioral syndromes: an integrative overview. Q. Rev. Biol. 79, 241–277 10.1086/422893 (doi:10.1086/422893) [DOI] [PubMed] [Google Scholar]
- 83.Kontiainen P., Pietiainen H., Huttunen K., Karell P., Kolunen H., Brommer J. E. 2009. Aggressive Ural owl mothers recruit more offspring. Behav. Ecol. 20, 789–796 10.1093/beheco/arp062 (doi:10.1093/beheco/arp062) [DOI] [Google Scholar]
- 84.Neff B. D., Sherman P. W. 2004. Behavioral syndromes versus darwinian algorithms. Trends Ecol. Evol. 19, 621–622 10.1016/j.tree.2004.09.017 (doi:10.1016/j.tree.2004.09.017) [DOI] [Google Scholar]
- 85.Sinn D. L., Gosling S. D., Moltschaniwskyj N. A. 2008. Development of shy/bold behaviour in squid: context-specific phenotypes associated with developmental plasticity. Anim. Behav. 75, 433–442 10.1016/j.anbehav.2007.05.008 (doi:10.1016/j.anbehav.2007.05.008) [DOI] [Google Scholar]
- 86.Sol D., Timmermans S., Lefebvre L. 2002. Behavioural flexibility and invasion success in birds. Anim. Behav. 63, 495–502 10.1006/anbe.2001.1953 (doi:10.1006/anbe.2001.1953) [DOI] [Google Scholar]
- 87.West-Eberhard M. J. 2003. Developmental plasticity and evolution. Oxford, UK: Oxford University Press [Google Scholar]
- 88.Bell A. M., Sih A. 2007. Exposure to predation generates personality in threespined sticklebacks (Gasterosteus aculeatus). Ecol. Lett. 10, 828–834 10.1111/j.1461-0248.2007.01081.x (doi:10.1111/j.1461-0248.2007.01081.x) [DOI] [PubMed] [Google Scholar]
- 89.Beckerman A. P., Petchey O. L., Warren P. H. 2006. Foraging biology predicts food web complexity. Proc. Natl Acad. Sci. USA 103, 13 745–13 749 10.1073/pnas.0603039103 (doi:10.1073/pnas.0603039103) [DOI] [PMC free article] [PubMed] [Google Scholar]
- 90.Kondoh M. 2003. Foraging adaptation and the relationship between food-web complexity and stability. Science 299, 1388–1391 10.1126/science.1079154 (doi:10.1126/science.1079154) [DOI] [PubMed] [Google Scholar]
- 91.Kondoh M. 2007. Anti-predator defence and the complexity–stability relationship of food webs. Proc. R. Soc. B 274, 1617–1624 10.1098/rspb.2007.0335 (doi:10.1098/rspb.2007.0335) [DOI] [PMC free article] [PubMed] [Google Scholar]
- 92.Loeuille N. 2010. Consequences of adaptive foraging in diverse communities. Funct. Ecol. 24, 18–27 10.1111/j.1365-2435.2009.01617.x (doi:10.1111/j.1365-2435.2009.01617.x) [DOI] [Google Scholar]
- 93.Petchey O. L., Beckerman A. P., Riede J. O., Warren P. H. 2008. Size, foraging, and food web structure. Proc. Natl Acad. Sci. USA 105, 4191–4196 10.1073/pnas.0710672105 (doi:10.1073/pnas.0710672105) [DOI] [PMC free article] [PubMed] [Google Scholar]
- 94.Abrams P. A. 2010. Implications of flexible foraging for interspecific interactions: lessons from simple models. Funct. Ecol. 24, 7–17 10.1111/j.1365-2435.2009.01621.x (doi:10.1111/j.1365-2435.2009.01621.x) [DOI] [Google Scholar]
- 95.Schmitz O. J., Krivan V., Ovadia O. 2004. Trophic cascades: the primacy of trait-mediated indirect interactions. Ecol. Lett. 7, 153–163 10.1111/j.1461-0248.2003.00560.x (doi:10.1111/j.1461-0248.2003.00560.x) [DOI] [Google Scholar]
- 96.Werner E. E., Peacor S. D. 2003. A review of trait-mediated indirect interactions in ecological communities. Ecology 84, 1083–1100 10.1890/0012-9658(2003)084[1083:AROTII]2.0.CO;2 (doi:10.1890/0012-9658(2003)084[1083:AROTII]2.0.CO;2) [DOI] [Google Scholar]
- 97.Dingemanse N. J., Kazem A. J. N., Reale D., Wright J. 2010. Behavioural reaction norms: animal personality meets individual plasticity. Trends Ecol. Evol. 25, 81–89 10.1016/j.tree.2009.07.013 (doi:10.1016/j.tree.2009.07.013) [DOI] [PubMed] [Google Scholar]
- 98.Dingemanse N. J., Van der Plas F., Wright J., Reale D., Schrama M., Roff D. A., Van der Zee E., Barber I. 2009. Individual experience and evolutionary history of predation affect expression of heritable variation in fish personality and morphology. Proc. R. Soc. B 276, 1285–1293 10.1098/rspb.2008.1555 (doi:10.1098/rspb.2008.1555) [DOI] [PMC free article] [PubMed] [Google Scholar]
- 99.Shuster S. M., Lonsdorf E. V., Wimp G. M., Bailey J. K., Whitham T. G. 2006. Community heritability measures the evolutionary consequences of indirect genetic effects on community structure. Evolution 60, 991–1003 [PubMed] [Google Scholar]
- 100.Wolf J. B., Brodie E. D., Cheverud J. M., Moore A. J., Wade M. J. 1998. Evolutionary consequences of indirect genetic effects. Trends Ecol. Evol. 13, 64–69 10.1016/S0169-5347(97)01233-0 (doi:10.1016/S0169-5347(97)01233-0) [DOI] [PubMed] [Google Scholar]
- 101.Preisser E. L., Bolnick D. I. 2008. The many faces of fear: comparing the pathways and impacts of nonconsumptive predator effects on prey populations. PLoS ONE 3, e2465. 10.1371/journal.pone.0002465 (doi:10.1371/journal.pone.0002465) [DOI] [PMC free article] [PubMed] [Google Scholar]
- 102.Wilson D. S. 1992. Complex interactions in metacommunities, with implications for biodiversity and higher levels of selection. Ecology 73, 1984–2000 10.2307/1941449 (doi:10.2307/1941449) [DOI] [Google Scholar]
- 103.Holyoak M., Leibold M. A., Holt R. D. (eds) 2005. Metacommunities: spatial dynamics and ecological communities. Chicago, IL: Chicago University Press [Google Scholar]
- 104.Amarasekare P. 2008. Spatial dynamics of foodwebs. Ann. Rev. Ecol. Evol. Syst. 39, 479–500 10.1146/annurev.ecolsys.39.110707.173434 (doi:10.1146/annurev.ecolsys.39.110707.173434) [DOI] [Google Scholar]
- 105.Holt R. D., Hoopes M. F. 2005. Food webs in a metacommunity context: modules and beyond. In Metacommunities: spatial dynamics and ecological communities (eds Holyoak M., Leibold M. A., Holt R. D.), pp. 68–93 Chicago, IL: Chicago University Press [Google Scholar]
- 106.Shmida A., Wilson M. V. 1985. Biological determinants of species-diversity. J. Biogeogr. 12, 1–20 10.2307/2845026 (doi:10.2307/2845026) [DOI] [Google Scholar]
- 107.Roff D. A. 1997. Evolutionary quantitative genetics. New York, NY: Chapman and Hall [Google Scholar]
- 108.Agrawal A. A. 2001. Ecology—phenotypic plasticity in the interactions and evolution of species. Science 294, 321–326 10.1126/science.1060701 (doi:10.1126/science.1060701) [DOI] [PubMed] [Google Scholar]
- 109.Relyea R. A. 2001. Morphological and behavioral plasticity of larval anurans in response to different predators. Ecology 82, 523–540 10.1890/0012-9658(2001)082[0523:MABPOL]2.0.CO;2 (doi:10.1890/0012-9658(2001)082[0523:MABPOL]2.0.CO;2) [DOI] [Google Scholar]
- 110.Williams R. J., Martinez N. D. 2000. Simple rules yield complex food webs. Nature 404, 180–183 10.1038/35006555 (doi:10.1038/35006555) [DOI] [PubMed] [Google Scholar]
- 111.Peters R. H. 1983. The ecological implications of body size. Cambridge, UK: Cambridge University Press [Google Scholar]
- 112.DeAngelis D. L., Mooij W. M. 2005. Individual-based modeling of ecological and evolutionary processes. Ann. Rev. Ecol. Evol. Syst. 36, 147–168 10.1146/annurev.ecolsys.36.102003.152644 (doi:10.1146/annurev.ecolsys.36.102003.152644) [DOI] [Google Scholar]
- 113.Banasek-Richter C., Cattin M. F., Bersier L. F. 2004. Sampling effects and the robustness of quantitative and qualitative food-web descriptors. J. Theor. Biol. 226, 23–32 10.1016/S0022-5193(03)00305-9 (doi:10.1016/S0022-5193(03)00305-9) [DOI] [PubMed] [Google Scholar]
- 114.Bersier L. F., Banasek-Richter C., Cattin M. F. 2002. Quantitative descriptors of food-web matrices. Ecology 83, 2394–2407 10.1890/0012-9658(2002)083[2394:QDOFWM]2.0.CO;2 (doi:10.1890/0012-9658(2002)083[2394:QDOFWM]2.0.CO;2) [DOI] [Google Scholar]
- 115.Woodward G., Speirs D. C., Hildrew A. G. 2005. Quantification and resolution of a complex, size-structured food web. Adv. Ecol. Res. 36, 85–135 10.1016/S0065-2504(05)36002-8 (doi:10.1016/S0065-2504(05)36002-8) [DOI] [Google Scholar]
- 116.Sheppard S. K., Harwood J. D. 2005. Advances in molecular ecology: tracking trophic links through predator–prey food-webs. Funct. Ecol. 19, 751–762 10.1111/j.1365-2435.2005.01041.x (doi:10.1111/j.1365-2435.2005.01041.x) [DOI] [Google Scholar]