Abstract
In a traditional sandwich assay, a DNA target hybridizes to a single copy of the signal probe. Here we employ a modified signal probe containing a methylene blue (a redox moiety) label and a “sticky end.” When a DNA target hybridizes this signal probe, the sticky end remains free to hybridize another target leading to the creation of a supersandwich structure containing multiple labels. This leads to large signal amplification upon monitoring by voltammetry.
The sandwich assay has become a mainstay for the detection of oligonucleotides.1–9 Typically in such assays a surface-bound capture probe specifically hybridizes with one region of a target oligonucleotide sequence. To complete the assay, a second probe, the signal probe, which is labeled with a fluorescent,10–12 enzymatic,5,8,13–15 or electroactive signaling moiety,2,3,9,16–19 is hybridized to a second region on the target, forming a capture probe—target oligonucleotide—signal probe “sandwich”. The utility of this approach is twofold. First, it does not require that the target oligonucleotide to be fluorescently, enzymatically, or otherwise labeled.2 Second, the capture and signal probes do not come into proximity in the absence of target, which reduces background signals, increases gain (signal change upon target binding), and leads to often impressive detection limits.
Despite their many positive attributes, a limitation of traditional sandwich assays is that each target strand hybridizes only a single copy of the capture probe and signal probe, limiting the total signal gain and thus sensitivity. In order to overcome this, gold nanoparticles, quantum dots, supramolecular polymerization, or enzymes (such as HRP) have been employed as signal-probe tags due to their ability to produce amplified signals.1,4–12,14,15,20–31 These approaches, however, typically require time-consuming, multistep processing, such as washing or amplification steps, in order to reduce false positive or negative signals arising from the nonspecific adsorption of the catalytic signaling moiety. As such, a simple and straightforward approach to improving the workflow of sandwich assays without degrading sensitivity could thus improve their utility. Motivated by this observation, we demonstrate here a sensitive, selective “supersandwich” assay that achieves a significantly higher gain than traditional sandwich assays without a concomitant requirement for additional steps after hybridization.
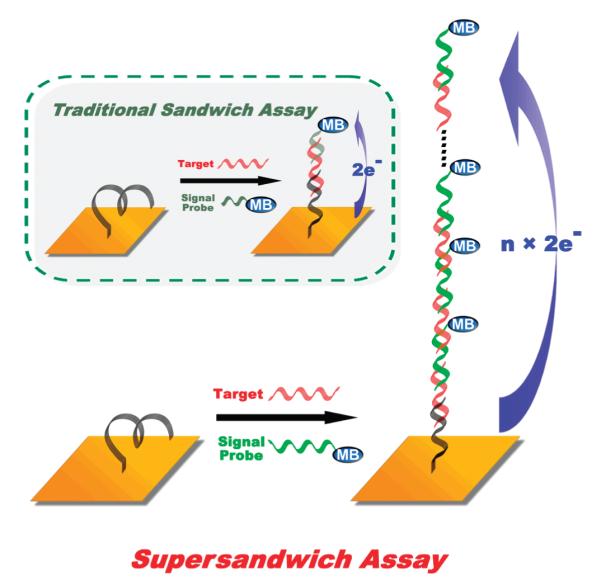
In a traditional sandwich assay, a single target molecule hybridizes with a single signal probe (Figure 1, inset). Here we have modified this approach by using signal probes that hybridize to two regions of a target DNA in such a manner that a single signal probe hybridizes more readily to complementary regions on each of two target molecules than to two regions on a single target molecule.12 Hybridization thus creates long concatamers containing multiple target molecules and signal probes (Figure 1). As a first step toward this goal, we have fabricated supersandwich signal probes directed against a specific target sequence and employed gel electrophoresis to confirm the formation of the proposed “supersandwich” structure. This analysis (Supporting Information Figure S1, left) produces a ladder of different lengths of the supersandwich structure, with the maximum length being ~1000 base pairs. Correspondingly, the traditional sandwich structure produces only bands of less than 75 base pairs (Figure S1, right).
Figure 1.

In a traditional DNA sandwich assay, a single target molecule hybridizes with a single signal probe (inset). Here we have modified this approach by using signal probes that hybridize to two regions of the target DNA, thus creating long concatamers containing multiple target molecules and signal probes and leading to improved signaling and detection limits. In the sensor design, the capture probe DNA and the signal probe (supersandwich) DNA are actually of the same sequence except for the modifications on the two ends. Of note, the affinity of the signal probe for the target is slightly higher than the affinity of the target for the capture probe (due to steric interactions with the electrode), and thus every time a capture probe is occupied, it is occupied by a sandwich and not simply by a target probe lacking a signaling probe.
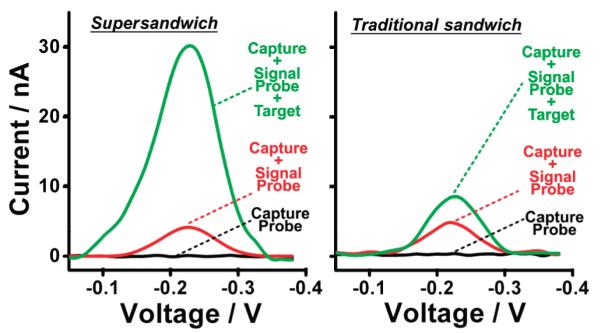
Fortified by the above gel electrophoresis results, we developed an electrochemical supersandwich assay using an electrode-bound capture probe attached to a gold electrode via a hexanethiol at its 5′ terminus. The second component of the assay, the signal probe, is modified with the redox moiety methylene blue. In the absence of targets, we observe only a small reduction peak at the potential expected for methylene blue. This background peak presumably arises due to signal probes freely diffusing in solution. After the addition of the target DNA, the concatenated supersandwich structure forms, and its multiple methylene blue tags produce a large increase in faradic current (Figure 2, left). The traditional sandwich assay, in contrast, produces a much smaller signal increase due to its 1:1 ratio of capture to signal probe (Figure 2, right). Despite the larger structures involved in the supersandwich assay, both it and the traditional assay produce similar electron transfer rates (Supporting Information Figure S2).
Figure 2.

In the absence of targets, we observe small reduction peaks at the −0.24 V (versus Ag/AgCl) potential expected for methylene blue. The background peak presumably arises due to the interaction between the capture probes and signal probes. The supersandwich structure with multiple methylene blue moieties forms after the addition of the targets, which leads to a large increase of the faradic current (left). This contrasts sharply with the traditional sandwich assay, which has a relatively small signal increase due to only one methylene blue (right).
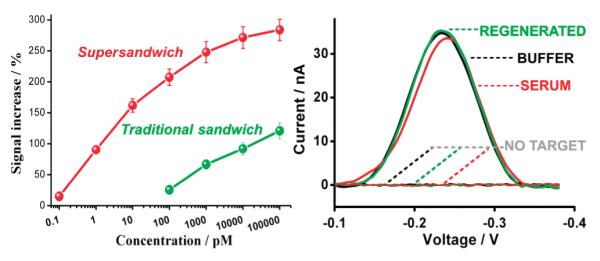
The improved gain of the supersandwich assay leads to significantly improved detection limits relative to a traditional sandwich assay. For example, we achieve a detection limit of 100 fM (defined as 3 standard deviations above the blank; the red lines in Figure 2), above which we observed monotonically increasing current with increasing target concentration until a signal gain of 300% is achieved at a target concentration of 100 nM (Figure 3). In contrast, we obtain a 100 pM detection limit using the traditional sandwich assay, some 3 orders of magnitude poorer than that of the supersandwich assay. Of note, while the improvement in gain of the supersandwich assay relative to the traditional assay is only 10-fold (at 100 pM) (Figure 3), the improvement in detection limit is much greater. We believe that this stems from two effects. First, the interplay between the two dissociation constants in the supersandwich assay (those for formation of the signal probe—target complex and for the association of this complex with a capture probe) alters the shape of the concentration versus signal response curve of the assay. Second, given the shapes of the curves for the supersandwich and traditional assays, a 10-fold change in gain pushes the detection limit (the point at which the signal rises above some detection threshold) much more than 10-fold down the concentration axis.
Figure 3.

(Left) We readily achieved statistically significant detection of target at a concentration as low as 100 fM (100 pM detection limit for traditional sandwich assay). Above this concentration we observed a monotonically increasing current with increasing target concentration until a signal gain of 300% is achieved at 100 nM. (Right) The supersandwich assay is likewise selective and reusable. For example, it performs well when challenged directly in 50% serum (here at 1 μM target) and can, via washing, be reused several times before significant degradation is observed.
Given that the formation of the supersandwich complex requires multiple binding events, the formation of the complex is likely more sensitive to mismatches than would be the formation of a simple target—probe duplex. Consistent with this, the supersandwich assay achieves its improved detection limit without sacrificing specificity. To show this, we challenged the assay using representative one-base, three-base, and five-base mismatched targets and found that it readily discriminates between these and fully complementary targets (Supporting Information Figure S3).
The electrochemical readout mechanism of our implementation of the supersandwich assay leads to good selectivity. Specifically, we find that, despite lacking washing steps, the electrochemical supersandwich assay performs well when challenged directly in complex clinical samples (Figure 3, red line). We achieve, for example, nearly indistinguishable signals when the assay is challenged either in buffered saline or in 50% blood serum despite the highly complex, multicomponent nature of the latter.
The supersandwich assay appears more straightforward than many existing amplification-based sandwich assays and competes well with them in terms of sensitivity. For example, our assay does not require either the multiple self-assembly steps required by gold nanoparticle-based amplification assays4,7,8,23 or washing steps or any of the sophisticated passivation steps required by enzymatic-based amplification and traditional ELISA assays.5,8,14 Finally, the supersandwich assay is reusable: room-temperature immersion in 8 M urea readily regenerates the sensor, even when it has been deployed in blood serum (Figure 3, right). Moreover, the supersandwich assay couples these potential benefits with detection limits comparable to those of other, much more complex amplification assays, including HRP-based amplification (femtomolar detection limits)5,8,14,15,29,31,32 or gold nanoparticle-based amplification (femtomolar detection limits).1,9,26,27
Supplementary Material
Acknowledgment
This research was supported by the Heeger presidential Chair Funds, Institute for Collaborative Biotechnologies, through Grant DAAA 19-03-D-0004 from the U.S. Army Research Office and by the DARPA Grant 00264048.
Footnotes
Supporting Information Available: Gel electrophoresis assays, studies of the specificity of the assay, materials, experimental conditions for preparation of modified electrodes, and control experiments. This material is available free of charge via the Internet at http://pubs.acs.org.
References
- (1).Cao YC, Jin R, Mirkin CA. Science. 2002;297:1536–1540. doi: 10.1126/science.297.5586.1536. [DOI] [PubMed] [Google Scholar]
- (2).Drummond TG, Hill MG, Barton JK. Nat. Biotechnol. 2003;21:1192–1199. doi: 10.1038/nbt873. [DOI] [PubMed] [Google Scholar]
- (3).Immoos CE, Lee SJ, Grinstaff MW. J. Am. Chem. Soc. 2004;126:10814–10815. doi: 10.1021/ja046634d. [DOI] [PubMed] [Google Scholar]
- (4).Syvanen AC, Soderlund H. Nat. Biotechnol. 2002;20:349–350. doi: 10.1038/nbt0402-349. [DOI] [PubMed] [Google Scholar]
- (5).Wan Y, Zhang J, Liu G, Pan D, Wang L, Song S, Fan C. Biosens. Bioelectron. 2009;24:1209–1212. doi: 10.1016/j.bios.2008.07.004. [DOI] [PubMed] [Google Scholar]
- (6).Wang J, Liu G, Jan MR. J. Am. Chem. Soc. 2004;126:3010–3011. doi: 10.1021/ja031723w. [DOI] [PubMed] [Google Scholar]
- (7).Wu L, Qiu L, Shi C, Zhu J. Biomacromolecules. 2007;8:2795–2800. doi: 10.1021/bm700487m. [DOI] [PubMed] [Google Scholar]
- (8).Zhang J, Lao R, Song S, Yan Z, Fan C. Anal. Chem. 2008;80:9029–9033. doi: 10.1021/ac801424y. [DOI] [PubMed] [Google Scholar]
- (9).Zhang J, Song S, Zhang L, Wang L, Wu H, Pan D, Fan C. J. Am. Chem. Soc. 2006;128:8575–8580. doi: 10.1021/ja061521a. [DOI] [PubMed] [Google Scholar]
- (10).Algar WR, Krull U. J. Anal. Chem. 2009;81:4113–4120. doi: 10.1021/ac900421p. [DOI] [PubMed] [Google Scholar]
- (11).Gill R, Zayats M, Willner I. Angew. Chem., Int. Ed. 2008;47:7602–7625. doi: 10.1002/anie.200800169. [DOI] [PubMed] [Google Scholar]
- (12).Takeuchi T, Matile S. J. Am. Chem. Soc. 2009;131:18048–18049. doi: 10.1021/ja908909m. [DOI] [PubMed] [Google Scholar]
- (13).Freeman R, Sharon E, Tel-Vered R, Willner I. J. Am. Chem. Soc. 2009;131:5028–5029. doi: 10.1021/ja809496n. [DOI] [PubMed] [Google Scholar]
- (14).Li J, Song S, Li D, Su Y, Huang Q, Zhao Y, Fan C. Biosens. Bioelectron. 2009;24:3311–3315. doi: 10.1016/j.bios.2009.04.029. [DOI] [PubMed] [Google Scholar]
- (15).Liu G, Wan Y, Gau V, Zhang J, Wang L, Song S, Fan C. J. Am. Chem. Soc. 2008;130:6820–6825. doi: 10.1021/ja800554t. [DOI] [PubMed] [Google Scholar]
- (16).Fan C, Plaxco KW, Heeger AJ. Proc. Natl. Acad. Sci. U.S.A. 2003;100:9134–9137. doi: 10.1073/pnas.1633515100. [DOI] [PMC free article] [PubMed] [Google Scholar]
- (17).Willner I, Zayats M. Angew. Chem., Int. Ed. 2007;46:6408–6418. doi: 10.1002/anie.200604524. [DOI] [PubMed] [Google Scholar]
- (18).Yang HB, Ghosh K, Zhao Y, Northrop BH, Lyndon MM, Muddiman DC, White HS, Stang PJ. J. Am. Chem. Soc. 2008;130:839–841. doi: 10.1021/ja710349j. [DOI] [PMC free article] [PubMed] [Google Scholar]
- (19).Zuo X, Xiao Y, Plaxco KW. J. Am. Chem. Soc. 2009;131:6944–6945. doi: 10.1021/ja901315w. [DOI] [PMC free article] [PubMed] [Google Scholar]
- (20).Cheng E, Xing Y, Chen P, Yang Y, Sun Y, Zhou D, Xu L, Fan Q, Liu D. Angew. Chem., Int. Ed. 2009;48:7660–7663. doi: 10.1002/anie.200902538. [DOI] [PubMed] [Google Scholar]
- (21).Feng KJ, Yang YH, Wang ZJ, Jiang JH, Shen GL, Yu RQ. Talanta. 2006;70:561–565. doi: 10.1016/j.talanta.2006.01.009. [DOI] [PubMed] [Google Scholar]
- (22).Liu J, Lu Y. J. Am. Chem. Soc. 2005;127:12677–12683. doi: 10.1021/ja053567u. [DOI] [PubMed] [Google Scholar]
- (23).Nam JM, Thaxton CS, Mirkin CA. Science. 2003;301:1884–1886. doi: 10.1126/science.1088755. [DOI] [PubMed] [Google Scholar]
- (24).Pu F, Hu D, Ren J, Wang S, Qu X. Langmuir. 2010;26:4540–4545. doi: 10.1021/la904173j. [DOI] [PubMed] [Google Scholar]
- (25).Song S, Liang Z, Zhang J, Wang L, Li G, Fan C. Angew. Chem., Int. Ed. 2009;48:8670–8674. doi: 10.1002/anie.200901887. [DOI] [PubMed] [Google Scholar]
- (26).Thompson DG, Enright A, Faulds K, Smith WE, Graham D. Anal. Chem. 2008;80:2805–2810. doi: 10.1021/ac702403w. [DOI] [PubMed] [Google Scholar]
- (27).Wang J, Zhu X, Tu Q, Guo Q, Zarui CS, Momand J, Sun XZ, Zhou F. Anal. Chem. 2008;80:769–774. doi: 10.1021/ac0714112. [DOI] [PubMed] [Google Scholar]
- (28).Wang S, Gaylord BS, Bazan GC. J. Am. Chem. Soc. 2004;126:5446–5451. doi: 10.1021/ja035550m. [DOI] [PubMed] [Google Scholar]
- (29).Xu W, Xue X, Li T, Zeng H, Liu X. Angew. Chem., Int. Ed. 2009;48:6849–6852. doi: 10.1002/anie.200901772. [DOI] [PubMed] [Google Scholar]
- (30).Zhu Z, Wu C, Liu H, Zou Y, Zhang X, Kang H, Yang CJ, Tan W. Angew. Chem., Int. Ed. 2010;49:1052–1056. doi: 10.1002/anie.200905570. [DOI] [PubMed] [Google Scholar]
- (31).Zuo X, Xia F, Xiao Y, Plaxco KW. J. Am. Chem. Soc. 2010;132:1816–1818. doi: 10.1021/ja909551b. [DOI] [PubMed] [Google Scholar]
- (32).Connolly AR, Trau M. Angew. Chem., Int. Ed. 2010;49:2720–2723. doi: 10.1002/anie.200906992. [DOI] [PubMed] [Google Scholar]
Associated Data
This section collects any data citations, data availability statements, or supplementary materials included in this article.


