

Abstract
A stochastic two-stage cancer model is used to analyse the relation between lung cancer and cigarette smoking. The model contains the main rate-limiting stages of carcinogenesis, which include initiation, promotion (clonal expansion of initiated cells), malignant transformation and a lag time for tumour formation. Various data sets were used to test the model. These include the data of a large prospective collaborative project carried out in 10 different European countries, the European Prospective Investigation into Cancer and Nutrition (EPIC). This new data set has not been modelled before. The model is also tested on other published data from CPS-II (Cancer Prevention Study II) of the American Cancer Society and the British doctors’ study. The analyses indicate that the EPIC data are best described with smoking dependence on the rates of malignant transformation and clonal expansion. With increasing smoking rates, saturation effects in the two exposure rate-dependent model parameters were observed. The results find confirmation in the biological literature, where both mutational effects and promotional effects of cigarette smoke are documented.
Introduction
The earliest approaches to mathematically investigate cancer began in the early 1950s. Nordling (1) and Stocks (2) proposed that several successive mutations in a cell would be necessary to explain the fact that for many carcinomas the incidence rate varies as a power of age. This has been quantitatively formulated by Armitage and Doll (3) in one of the best-known cancer models, a multi-stage model that accounts for the relation between age and cancer incidence. That was related to the number of stages needed for a normal cell to develop into a malignant cell (3). For the Armitage–Doll multi-stage model no clonal growth was assumed. Because of discrepancies with the observed number of biological stages, Armitage and Doll advanced their model into one of two stages with exponentially growing clones (4). The Armitage–Doll two-stage model has limitations in cancer risk assessment because in this model deterministic cell growth is assumed. When the growth rate is small, it is more appropriate to use a stochastic model than a deterministic one because the probability of extinction of clones, which is not considered in a deterministic model, cannot be neglected (5). This led to the development of stochastic cancer models (6-9). Stochastic cell growth of intermediate cells is assumed for the stochastic two-mutation model with clonal expansion. This two-step clonal expansion (TSCE) model is the best-known multi-step model and was developed by Moolgavkar et al. It is also known as the MVK model of Moolgavkar, Venzon and Knudson (7-9). In contrast with the Armitage–Doll model, there is a considerable amount of experimental data supporting the stochastic two-mutation model (10). A number of generalizations of the Armitage–Doll model and of the two-mutation model have been developed (10,11).
Several studies have been performed using multi-stage models to estimate cancer incidence and other biological end-points. The currently most widely used cancer models originate from the above-mentioned stochastic two-mutation model with clonal expansion (7-9). Extensive scientific investigations applied this model and its versions to study various aspects of carcinogenesis (12-15). Others have used multi-stage models and State-Vector Models to describe neoplastic transformation in vitro (16-20) and lung carcinogenesis (21).
The two-stage cancer model with clonal expansion, applied in the current study, has a long history of development (15,22-28). The model simulates the main rate-limiting stages of carcinogenesis. They include a dose-dependent initiation stage (also referred to as first mutation rate), a net clonal expansion rate of initiated cells (also referred to as promotion), a second mutation rate (malignant transformation) and a lag time of tumour formation.
The present study applies this well-established stochastic cancer model with the aim to mathematically describe the effects of cigarette smoking with respect to lung cancer incidence. To achieve this goal, different data sets are used, including those of a large prospective collaborative project carried out in 10 different European countries, the European Prospective Investigation into Cancer and Nutrition (EPIC) (29). This investigation, including 519 978 individuals, is the largest ever conducted specifically on the relation between diet and cancer. The EPIC sub-data set applied in this study is new and has not been modelled before. The results of this effort are compared with the results from analysing two readily available older data sets with the aim to find a consistent mathematical description of smoking effects on lung carcinogenesis among different important data sets.
The effects of cigarette smoke are well documented in the literature. Tumour-promoting and co-carcinogenic (30-36) but also mutagenic effects of cigarette smoke have been described (35,37-46). Tobacco smoke contains DNA-reactive carcinogens, such as nitrosamines, polycyclic aromatic hydrocarbons and pyrolysis products, such as carbolines. Enhancing and promotional factors, e.g. catechols, other phenols and terpenes, are also an important component. Cigarette smoke is a combination of genotoxic and non-genotoxic agents (47). Rubin (34) reports that the full range of experimental results favours the active participation of promoters and co-carcinogens as selective agents in addition to mutagens in the induction of lung cancer by cigarette smoking. Somatic mutations caused by cigarette smoke are very common and give rise to patches of clonally expanded epithelium harbouring one or more mutations (35). This justifies that in our model analysis cigarette smoke is allowed to influence both the mutation rates and the rate of clonal expansion. In addition to mutagenic and promotional effects, cytotoxic effects of cigarette smoke have also been reported (48-51).
Materials and methods
The two-stage model
In the two-stage model, normal stem cells (N-cells) can be transformed into cells of an intermediate form (I-cells) at a stochastic event rate μ1, often referred to as first mutation rate. These intermediate cells can divide into two intermediate cells at a stochastic rate α and die or differentiate at rate β. In addition, intermediate cells can divide into one intermediate and one malignant cell (M-cell) with a second stochastic event rate μ2. The malignant cells are assumed to develop into a tumour (T) after a deterministic lag time, tlag. A conceptual view of the two-stage model is given in Figure 1. The mathematical and statistical properties of this stochastic cancer model have been discussed in great detail in the literature and will not be repeated here (13,15,23,26,27,52).
Fig. 1.
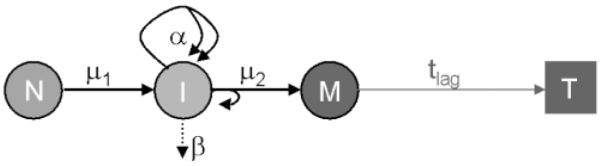
Conceptual view of the two-stage model with clonal expansion. See the Materials and methods section for an explanation of the symbols.
The parameterizations used for the two mutation rates and the clonal expansion rate allow these parameters to increase linearly at low smoking rates and to saturate at high smoking rates. A function f(s; p1, p2) is used that has the following form:
| (1) |
where p1 (day per cigarette) is the slope of the linear part in f(s; p1, p2) and p2 is the plateau value. The dose rate (in cigarette per day) is denoted as s. For the time-independent mutation rates μ1, μ2 and the net clonal expansion rate of intermediate cells, ε = α – β, exposure rate-dependent saturation functions are used as given in Table I together with the associated free parameters.
Table I.
Parameterizations used in the model analyses
| Model rates | Parameters to estimate |
Description |
|---|---|---|
| μ1(s) = μ01[1 + f(s; y1, y2)] | μ0, y1, y2 | First mutation rate (initiation) |
| μ2(s) = μ02[1 + f(s; m1, m2)] | m1, m2 | Rate of malignant transformation |
| ε(s) = α – β = ε0[1 + f(s; ε1, ε2)] | ε0, ε1, ε2 | Rate of net clonal expansion of I-cells |
The model rates and their parameterizations are given together with the free parameters and a description of the model rates. The restriction μ01 = μ02 = μ0 is used together with N = 107.
The background mutation rate of first and second mutation is denoted as μ0 (per year). The background rate of net clonal expansion is ε0 (per year). The baseline incidence is described by μ0 and ε0. The use of the f-functions was indicated because originally the function μi(s) = μ0(1 + ais)m with i = 1, 2 was applied. Here, the parameters ai (day per cigarette) are the linear mutation induction coefficients. Initial model fits pointed to saturation effects in the dose-response relations and the function μi(s) = μ0(1 + ai s)m can describe such behaviour. Testing this model on the EPIC data for males led to m < 1, which indicates a saturation behaviour. When the f-functions were used to parameterize μ1, μ2 and ε, the quality of the fit improved significantly compared with the use of the power functions mentioned above.
For the lung cancer modelling at RIVM, a linear increase of sensitive lung cells (normal stem cells) during childhood is simulated until a constant number of N = 107 cells is reached at an age of 20 years. The restriction μ01 = μ02 = μ0 was applied because only the product N × μ01 × μ02 can be identified from the data. In addition, the restriction β = 0 was used. The motivation for this approach in RIVM’s implementation of the stochastic two-stage model was discussed (53). Briefly, this approach avoids the levelling of the hazard at very high ages due to the stochasticity of separate birth and death processes of I-cells. At RIVM the exact analytical solution of the stochastic two-stage model (23,52) has been used for the present study with recent adaptations to the software (25). The specific details associated with the two-stage model as used at RIVM have been described earlier (22,24).
From the model solution the age-specific tumour hazard can be calculated for specific exposures. Lifetime risks are calculated from the age-integrated hazard function at an age of 75 years (H75) with and without exposure:
| (2) |
where LEAR and LERR are the lifetime excess absolute and relative risks, respectively.
Simultaneously to the RIVM model analyses, our colleagues at ISI also performed fits of the EPIC data using the well-established TSCE model (15,26,27) in the parameterization presented in ref. (13). In the ISI studies, different optimization routines were used than the ones applied at RIVM (described below).
The data
While the main part of this study is focussed on the EPIC data set, two other sets of data are also considered for a comparison of the smoking dependencies found by analysing them.
EPIC data
EPIC is a multi-centre prospective cohort study designed to investigate the relation between diet, nutritional and metabolic characteristics, various lifestyle and environmental factors and the incidence of different forms of cancer. The study is based in 23 collaborating centres in 10 European countries and includes populations characterized by large variations in dietary habits and cancer risk. Data are collected on diet, physical activity, reproductive history, lifetime consumption of alcohol and tobacco, previous and current illnesses and current medication (29). Estimations based on the incidence of specific cancer sites suggested that national studies of the order of 35 000–50 000 subjects, for a total European cohort of 400 000 subjects, would provide sufficient power to detect statistically significant relative risks as low as 1.2 for all major cancer sites in the entire cohort (29).
The questionnaires on non-dietary variables contained a major core component, common to all EPIC centres, which includes detailed questions on life history of tobacco smoking, past and current illnesses and health problems (29). The 519 978 eligible study subjects were mostly aged 25–70 years. In the 1 939 011 person-years of follow-up since 1992, 1074 incident lung cancers had been included in the database of the International Agency for Research on Cancer (IARC) by June 2002 (54). For various reasons (such as a history of previous cancer of another site, missing date of diagnosis of lung cancer and lack of follow-up information), some of these cases had to be excluded, which left 860 with satisfactory case data to be used in the analysis (54).
In addition to the above-mentioned exclusions performed on the original EPIC data, additional individuals were excluded when the EPIC sub-data set, which was used in the present study, was created. These were individuals who smoked pipe or cigar and those with missing or incomplete smoking information. Persons who stopped smoking and later started again and who stopped for longer than 20% of the total time between the very first start and the final stop of smoking were not included either. This exclusion was made because the timing of the non-smoking period was unknown in most countries. In addition, any data from France were excluded because in the primary data collection in France no difference is made between primary lung cancer and metastases from primary cancers in locations other than the lung. Such a distinction can only be made after follow-up through medical records, which had not yet been completed in all cases. Table II shows the number of lung cancer cases and person-years for males and females in the EPIC sub-data set as used in the present study. For every individual the data contain information on the following aspects: smoking status (1 = never smoker, 2 = former smoker, 3 = current smoker), code for country centre, code for lung cancer (1 = lung cancer diagnosed, 2 = no cancer), age when smoking was started, age when smoking was stopped and the number of cigarettes smoked per day at the ages of 20, 30, 40 and 50 years. The data also comprise the year, month and day of birth; the year, month and day when the follow-up ended (i.e. the last day for which the data set is valid for that person); and the year, month and day that the person was included in the study. For every individual the data set also includes a mean number of cigarettes smoked per day in the past. Only individuals who did not have a lung tumour were allowed to enter the study. For those study subjects who had a lung cancer diagnosed during their follow-up time, the end date of their follow-up is identical to the date of tumour diagnosis.
Table II.
Number of individuals, lung cancer cases and person-years of follow-up in males and females of the EPIC sub-data set
| Number of individuals |
Number of lung cancer cases |
Number of person-years |
|
|---|---|---|---|
| Males | 113 874 | 308 | 517 567.91 |
| Females | 248 923 | 270 | 1 101 086.88 |
| Total | 362 797 | 578 | 1 618 654.79 |
To facilitate extensive analyses by limiting the computer time in the model fits, the individual EPIC sub-data sets for males and females used for the current study were also lumped into grouped person-year strata. Therefore, the five categories shown in Table III were introduced.
Table III.
Categories used to condense the EPIC data, bin size of the different categories and number of categories
| Category | Bin size | Number of categories |
|---|---|---|
| Age into study | 5 years | 21 |
| Cigarettes per day | 10 cigarettes per day | 8 |
| Start smoking age | 10 years | 8 |
| Stop smoking age | 10 years | 8 |
| Age at end of study | 5 years | 21 |
This led to 2118 groups for the EPIC data for males and 1834 groups for the females. First, the grouped data were used to test the model and to find the simplest model description. Final model fits were then performed with the individual EPIC data using the best estimates of the grouped data fits as starting point. This is further described in the Results section. Similarly, condensed data sets for males and females per country were made. This yielded 18 data sets with the grouped information for the 9 different countries that were used to study countrywise differences in the lung cancer incidence.
CPS-II data
Using the American Cancer Society’s Cancer Prevention Study II (ACS-CPS II), a prospective cohort study with six years of follow-up, Halpern et al. (55) analysed the absolute risk of lung cancer mortality in individuals who had never smoked and in current and former smokers. The data used for our analysis include person-years of exposure and lung cancer deaths for never, current and former smokers (males and females) by age (40–43, 44–48, …, 74–80 years). The age-at-quitting includes those quitting in the following age ranges: 30–39, 40–49, 50–54, 55–59, 60–64 and 65–69 years (55). Current and former smokers started smoking at 18 years (55). For the current and former smokers Table I in ref. (55) provides mean smoking rates of 23.25 and 22.8 cigarettes per day, respectively. The total number of person-years and lung cancer deaths among never, current and former smokers are 4 735 950 and 4152, respectively (55).
British doctors’ data
Doll and Peto (56) present the age-specific lung cancer incidence data from the 20-year follow-up in the prospective study of male British doctors (57). Table II in ref. (56) provides man-years for age groups 20–24, 25–29, …, and 85+ and for different ranges of cigarettes smoked per day. To fit the two-stage model to these data, the given mean number of cigarettes per day was used. Table III in ref. (56) provides the numbers of lung cancers for the same age groups and by amount smoked. Following some restrictions given in ref. (56), we only use data with lung cancers incident in the age range 40–79 and exclude men who reported smoking over 40 cigarettes per day. With these restrictions the total number of person-years and lung cancer deaths among never smokers and regular smokers are 179 273 and 201, respectively. The age when smoking started was taken to be 20.5 years [i.e. since early adult life, defined as ages 16–25 (56)].
Likelihoods used
The maximum likelihood method is used to estimate the values of the free model parameters by fitting the model to the data. The total likelihood is given by the product of the individual likelihoods: L = Πi Li. Because maximizing the likelihood is equivalent to minimizing the –loglikelihood: −ln(L) = −∑i ln (Li), the latter problem, which is numerically better tractable, Li the latter be solved to find the best model solution.
For the individual EPIC data, the loglikelihood is calculated as follows. The probability of tumour, P(ti), is calculated with the model (23) at age of observation (ti) from the exposure pattern of that individual. The individual likelihood is then given by
| (3) |
| (4) |
where P′(t) is the time-derivative of P(t) and tinclusion,i is the age at start of observation of that individual in the study.
For grouped person-year data such as the grouped EPIC data, the likelihood corresponding to a Poisson model is used:
| (5) |
where ni is the observed number of cases (i.e. the number of fatal tumours in group i) and Λi is the calculated (expected) number of cases in group i. To calculate the expected number of tumours per group, Λi, the age-dependent hazard is multiplied with the number of person-years per group.
For sufficiently large data sets, the difference in –loglikelihood, −lnL, between two models is approximately distributed as , where n is the extra number of free parameters. This allows to test whether additional free parameters lead to significant statistical improvements of the model fits using the likelihood ratio test. For joint (i.e. simultaneous) fits of separate data sets we introduce the Δcorr symbol. It is the difference in –loglikelihood between the joint fit and the corresponding separate fits minus the increase in –loglikelihood associated with the reduced number of free parameters of the joint fit. Because of the reduced number of free parameters a joint fit has a larger value of –loglikelihood than the sum of the –loglikelihood values of the separate fits. That does not necessarily indicate that the joint fit is a worse description than the separate fits because the reduced number of free paramet-rs associated with the joint fit has to be corrected for. A negative value for Δcorr signals a significant statistical improvement of a joint fit compared with the separate fits.
Although the largest uncertainty in the parameter values depends on the choices made for the functions chosen for the model parameters (see above), confidence intervals (CIs) for the parameter estimates are reported for the fitted parameters. The upper (and lower) limits for the CIs are determined by adjusting one parameter and performing a local refit of the other free parameters, until a specified increase in –loglikelihood is obtained (see ref. 58 for the method). Ninety-five per cent CIs are reported for the parameters (corresponding to an increase in –loglikelihood of 1.92).
Best estimates of the free model parameters are gained by minimizing the –loglikelihood in a global search using the Adaptive Simulated Annealing (ASA) software (59,60), followed by two local optimization routines, Powell and Amoeba. The method of Simulated Annealing is a technique that has attracted significant attention as suitable for optimization problems of large scale, especially ones where a desired global maximum is hidden among many, poorer, local maxima. Both Amoeba and Powell are local search methods capable of finding the best local solution when approximate best parameters are already known. The Powell method (61) is a direction-set (steepest descent) method. Amoeba is a minimization routine that is based upon the Downhill Simplex Method (62).
Results
EPIC data
The following model parameters were estimated by data fitting: μ0, ε0, yi, mi, and εi, i = 1, 2. Here, index i = 1 indicates the slope parameters and index i = 2 refers to the plateau parameters [see eq. (1) and Table I]. The slope parameters for first and second mutation rates and for the rate of net clonal expansion are y1, m1, ε1, respectively. The corresponding three plateau parameters are y2, m2, ε2. Starting with a linear smoking-rate dependence for μ1(s) and μ2(s) without any saturation effects and with a constant ε, systematic fits of the grouped EPIC data for males and females were performed to evaluate whether adding additional free parameters out of those mentioned above, lead to a statistically significant improvement of the model fits. The likelihood ratio test was used to achieve this. The best estimate results from the model fits of the grouped data were taken as starting values for fits of the individual EPIC data for males and females using the two local search algorithms. When identical slope parameters (y1 = m1 = ε1) were used for μ1(s), μ2(s) and ε(s), the fits turned out to be equally good on statistical grounds compared with the fits that allowed for different slopes (results not shown).
The best model fits were those that allowed for saturation in μ1(s), μ2(s) and ε(s). The parameter y2, however, was associated with infinitely large CIs, which indicated that the smoking dependence in μ1(s) was highly uncertain. Follow-up fits indeed revealed that when no smoking dependence was allowed for μ1 in the fits of EPIC males and females (individual data), the increase in −loglikelihood was not significant for the males and borderline significant for the females. Detailed results are given in Table IV. For the lag time, tlag, a constant of 5 years was used (24). When tlag was allowed to be free in the fit of EPIC males, it was found that the best estimate was very close to 5 years and the best estimates of the other free parameters were very close to those reported in Table IV.
Table IV.
Best estimates with 95% CIs (in parentheses) and –loglikelihood values for different model fits with ε1 = m1
| 1 | 2 |
3 |
4 |
|---|---|---|---|
| EPIC males, fit-RIVM1 | EPIC females, fit-RIVM2 | Males and females, fit-RIVM3 | |
| Initiation | |||
| μ0 (per year) | 2.03·10−7 (1.36·10−7–2.60·10−7) | 1.85·10−7 (1.36·10−7–2.47·10−7) | 1.87·10−7 (1.79·10−7–1.95·10−7) |
| y1 (day per cigarette) | – | – | – |
| y 2 | – | – | – |
| Promotion | |||
| ε0 (per year) | 6.6·10−2 (5.1·10−2–8.6·10−2) | 6.3·10−2 (4.5·10−2–7.9·10−2) | 6.5·10−2 (5.3·10−2–7.7·10−2) |
| ε1 (day per cigarette) | m 1 | m 1 | m 1 |
| ε 2 | 1.08 (0.65–1.63) | 1.28 (0.82–2.14) | 1.19 (0.88–1.64) |
| Malignant transformation | |||
| m1 (day per cigarette) | 0.16 (0.11–0.26) | 0.15 (0.11–0.26) | 0.15 (0.12–0.21) |
| m 2 | 1.78 (0.91–6.12) | 1.75 (0.59–10.99) | 1.83 (0.98–3.96) |
| –loglikelihood | 2213.16 | 2204.79 | 4420.56 |
| Sum: | 4417.96 | (Δcorr = −2.93) |
In the fourth column the EPIC data for males and females were fitted simultaneously.
The differences in the background parameters (μ0 and ε0) in columns 2 and 3 in Table IV are not very large and it cannot be said a priori whether male and female data sets together can be simulated with the same set of parameters. All joint fits were performed with identical slope parameters ε1 = m1. In the joint fit-RIVM3 the number of free parameters was reduced from 2 × 5 to 5. When the same background parameters were used, the resulting –loglikelihood was 4420.56 (fit-RIVM3), which is 2.61 points larger than the –loglikelihoods of the separate fits (fit-RIVM1 and fit-RIVM2). Considering that at the 5% significance level a reduction by 5 free parameters corresponds to an increase of 5.54 points in –loglikelihood, it is evident that the joint fit of the EPIC data for males and females is preferable to the separate fits (Δcorr −2.93, Table IV).
The ISI group also performed fits of the individual EPIC data using the TSCE model (15,26,27) in the parameterization presented in ref. (13). They found very similar tendencies for the smoking dependence of first and second mutation rate and of the net clonal expansion rate, ε. Analogous to the findings at RIVM, it was found that on the basis of statistical grounds a joint fit of EPIC males and females is preferable to the separate fits (results not shown). Because of these similarities in the findings of both groups it was decided to only show the results based on the RIVM analyses. Figure 2 shows the exposure-dependence of the relative rates for the first and second mutation and the net clonal expansion for fit-RIVM3.
Fig. 2.
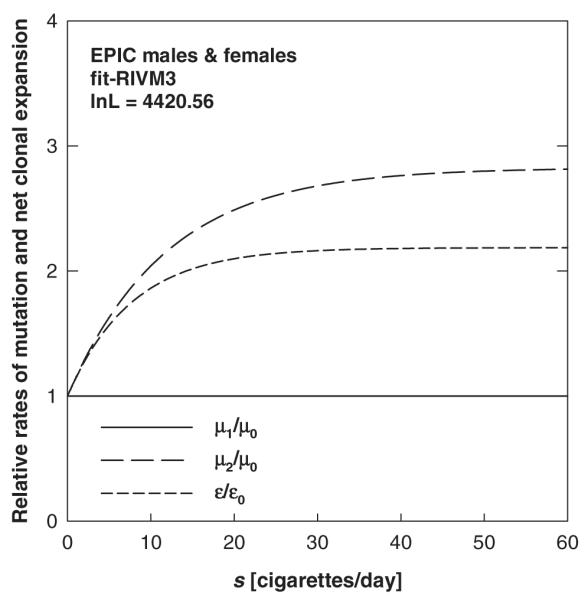
Relative rates of first and second mutation (μ1/μ0, μ2/μ0) and net clonal expansion (ε/ε0) versus exposure rate s. The curves refer to fit-RIVM3, the joint fit of EPIC males and females (Table IV).
The agreement between data and model fits cannot be easily illustrated graphically, since the fit is based on individual information such as the age at time of inclusion and the age-dependent exposure pattern. In Figure 3, a comparison of observed and modelled lung cancer deaths is given for EPIC males and females in groups of exposure rate. The results from fit-RIVM1 and fit-RIVM2 (Table IV) are indicated with solid lines in Figure 3. The results found at ISI are very similar (not shown).
Fig. 3.

Comparison of observed (circles) and modelled lung cancer mortality. The distribution over exposure rates (intervals of 10 cigarettes per day) is shown. (A) Refers to fit-RIVM1, the preferred fit of EPIC males (Table IV); and (B) refers to fit-RIVM2, the preferred fit of EPIC females.
EPIC data countrywise
As described in the Materials and methods section, the two grouped EPIC data sets for males and females were also split by countries, and their information was grouped into 2 × 9 smaller data sets for the 9 different countries. No males from Norway are included in the EPIC data. The aim of this analysis is to find out whether the cancer incidence of different populations can be described using different background mutation rates and one joint set of smoking dependent parameters. Again, μ1(s) = μ0 was used in these analyses.
A joint fit of the grouped data for males split by countries was performed that allowed only for eight different free background mutation rates for the eight different countries. In this fit the best estimates of an earlier fit (results similar to fit-RIVM1, not shown) of the grouped data for males not split by countries were used as fixed input values. The best estimates together with their CIs are plotted in Figure 4A. It indicates that one joint background mutation rate could probably be used for all males from Greece, the Netherlands and Sweden; one for Spain, Italy, Denmark and the UK; and one separate μ0 for Germany. Fit-RIVM5 (Table V) confirmed that and therefore represents a consistent mathematical description of the males in the EPIC data when split by countries. The –loglikelihood of fit-RIVM5 represents also a significant improvement over a fit that allowed two free μ0s (one for Germany and one for all other countries; results not shown). The latter fit was again a significant improvement over fit-RIVM4, which only allowed for one μ0 for all countries. The –loglikelihood values reported in Table V cannot be compared with those given in Table IV because the latter refer to the individual data sets, whereas for the grouped data the Poisson likelihood from eq. (5) was evaluated.
Fig. 4.

Best estimates for the background mutation rates (μ0) for a joint fit of EPIC males (A) and EPIC females (B). The grouped data split by countries were used for this analysis. The error bars indicate the 95% CIs.
Table V.
EPIC males and females: best estimates and 95% CIs (in parentheses) for the background mutation rates are given for different model fits
| 1 | 2 | 3 Fit-RIVM4 |
4 Fit-RIVM5 |
|---|---|---|---|
| Males | μ0 (10−7 per year), for all (other) countries | 2.35 (2.28–2.43) | 2.40 (2.29–2.52) |
| μ0 (10−7 per year), for Germany | – | 2.95 (2.61–3.31) | |
| μ0 (10−7 per year), for Greece, Netherlands, Sweden | – | 1.85 (1.62–2.10) | |
| –loglikelihood | 617.42 | 605.10 | |
| fit-RIVM6 | fit-RIVM7 | ||
| Females | μ0 (10−7 per year), for all other countries | 2.54 (2.45–2.63) | 2.62 (2.52–2.72) |
| μ0 (10−7 per year), for Greece, Spain | – | 1.65 (1.20–2.16) | |
| –loglikelihood | 532.59 | 526.55 |
Similar tendencies were found for the females, where the best description allowed for a joint background mutation rate for Spain and Greece and one for all other countries (Figure 4B and Table V: fit-RIVM7). Allowing for different μ0s for Spain and Greece did not lead to a significant improvement (results not shown). Fit-RIVM7 represents a significant improvement over another fit that allowed for one μ0 for Greece and one for all other countries (results not shown), which was also a significant statistical improvement over fit-RIVM6.
Age-dependent cumulative incidence and hazard
Rather similar patterns were found among males and females for the cumulative incidence, the hazard rate and the excess relative hazard. It was therefore decided to show these curves based on the best estimated values of fit-RIVM3, the joint fit of EPIC males and females. Figure 5A gives the cumulative incidence (lifetime probability for lung cancer) with the best estimates taken from fit-RIVM3. The results given in this figure were calculated for hypothetical smoking histories, that is, a non-smoker, two ex-smokers and one lifelong smoker. The ex-smokers started to smoke at age 20 and stopped smoking at age 50. The smoking rates for the two ex-smokers were 10 and 20 cigarettes per day, respectively. The lifelong smoker also started at age 20 and smoked 20 cigarettes per day. The corresponding hazard rates are plotted versus age in Figure 5B. Figure 5C gives the excess relative hazard (excess relative risk), which is defined as [hazard (smoker)/hazard (non-smoker)] – 1.
Fig. 5.

Cumulative incidence (A), hazard rate (B) and excess relative hazard (C) versus age for non-smokers, smokers and ex-smokers starting to smoke at age 20 for life or until age 50 years. The smoking rates were either 10 or 20 cigarettes per day. The risk estimates were calculated with the best estimates from fit-RIVM3.
In Figure 6 the lifetime excess absolute risk (LEAR) and lifetime excess relative risk (LERR) versus smoking rate are given for a lifelong male and female smoker who started smoking at age 20. Results are also given for a population of males and females on the basis of fit-RIVM3. LEAR and LERR are calculated from the age-integrated hazard at an age of 75 years [see eq. (2)]. The saturation behaviour that is observable results from the plateaus in μ2(s) and ε(s) associated with these fits (Figure 2). The error bars at 10 and 20 cigarettes per day denote the uncertainties associated with the 95% CIs of the free parameters in fit-RIVM3. Because the parameters are correlated with each other, the 95% CIs for each free parameter corresponds to a different set of values for the other parameters. These sets of parameter values at the CI boundaries were then used to assess the uncertainties in LEAR and LERR.
Fig. 6.

Lifetime excess absolute and excess relative risk versus exposure rate s calculated from the age-integrated hazard at age 75 years for lifelong smokers. Smoking was started at an age of 20 years. The various curves in A and B refer to the best estimates given in Table IV. The error bars at 10 and 20 cigarettes per day denote the uncertainties associated with the 95% CIs of the free parameters in fit-RIVM3.
Joint analysis with other data
In addition to the EPIC data, other sets of smoking data have also been analysed with the aim of finding a consistent description. From the analyses of the EPIC data the effect of smoking on μ1 is indeterminable. This was an additional motivation to include other data sets with larger follow-up. At first, these additional data sets were analysed separately from the EPIC data to find the trends for μ1, μ2 and ε associated with these data.
CPS-II
Because of the limited number of different exposure rates in this data set, it was not possible to determine the slope parameters and the plateau values for μ1, μ2 and ε by fitting the model to the data. Different approaches were taken instead. In all of them the background rates, μ0 and ε0, were always estimated by data fitting. It was found that it is possible to determine the values of the three different plateaus (y2, m2 and ε2) when the value for the joint slope parameter is taken as a fixed input. In fit-RIVM8 (Table VI) the value for y1 = m1 = ε1 was used from a joint fit of EPIC males and females (grouped data) and values for the plateaus were determined by data fitting. To find a consistent description with the EPIC data, a series of model fits was performed that applied a constant μ1(s) = μ0. In all of these fits the –loglikelihood was significantly elevated compared with fit-RIVM8. That points to a smoking rate-dependent first mutation rate for the CPS-II data. A sensitivity analysis was conducted with respect to the start age of smoking, which was assumed to be 18 years. Except for y2 the best estimate values from Table VI are very insensitive to changes in the start age. The sensitivity found for y2 can be expected on the basis of the rather large 95% CI for this free parameter as reported in Table VI.
Table VI.
Best estimates with 95% CIs (in parentheses) and –loglikelihood values for different model fits: CPS-II data (fit-RIVM8), British doctors’ data (fit-RIVM9), the grouped EPIC data for males and females and the CPS-II data (fit-RIVM10), and the grouped EPIC data for males and the British doctors’ data (fit-RIVM11)
| 1 | 2 |
3 |
4 |
5 |
|---|---|---|---|---|
| CPS-II, fit-RIVM8 | British doctors’ data, fit-RIVM9 | EPIC males and females and CPS-II, fit-RIVM10 | EPIC males and British doctors’ data, fit-RIVM11 | |
| Initiation | ||||
| μ0 (per year) | 2.84·10−7 (2.45·10−7–3.28·10−7) | 1.07·10−7 (7.96·10−8–1.44·10−7) | 2.51·10−7 (2.24·10−7–2.77·10−7) | 1.65·10−7 (1.36·10−7–1.86·10−7) |
| y1 (day per cigarette) | 0.20 (0.16–0.25) | 0.15 (0.10–0.30) | ||
| y 2 | 2.89 (1.40–9.40) | 9.95·104 (6.10–∞) | 4.87 (2.43–20.40) | 12.85 (0.89–∞) |
| Promotion | ||||
| ε0 (per year) | 4.6·10−2 (3.8·10−2–5.4·10−2) | 9.8·10−2 (7.3·10−2–0.117) | 5.1·10−2 (4.4·10−2–5.7·10−2) | 7.2·10−2 (5.7·10−2–9.0·10−2) |
| ε1 (day per cigarette) | y 1 | y 1 | y 1 | y 1 |
| ε 2 | 1.19 (0.86–1.76) | 0.16 (0–0.48) | 0.96 (0.75–1.26) | 0.56 (0.25–1.02) |
| Malignant transformation | ||||
| m1 (day per cigarette) | y 1 | y 1 | y 1 | y 1 |
| m 2 | 0.56 (0.39–0.74) | 9.76·104 (7.93–∞) | 0.70 (0.54–0.88) | 6.76 (2.16–∞) |
| –loglikelihood | 82.39 | 28.73 | 766.55 (Δcorr = +14.81) |
394.54 (Δcorr = +0.50) |
Values given in italic were used as fixed input and not estimated by model fits.
British doctors’ data
Although the British doctors’ data comprise more different exposure rates than the CPS-II data (from 2.7 to 38 cigarettes per day there are eight different smoking rate strata versus only two in the CPS-II), it was not possible to determine all three slope parameters and the plateau parameters in one fit and with finite CIs. When fixed values for the slope parameters were used, the best estimates for the plateau parameters y2 and m2 were always found to be as large as allowed by the input ranges, indicating that the data are consistent with linear mutation rates over the smoking rates in the data set (Table VI: fit-RIVM9, –loglikelihood = 28.73, 5 free parameters). Another model fit applied μ1(s) = μ0 but led to a somewhat larger −loglikelihood with the same number of free parameters. This suggests that the British doctors’ data are consistent with a smoking dependence in the first mutation rate.
Because of the very low value found for ε2, the net rate of clonal expansion is nearly constant over the whole exposure range. The fitted values for y2 and m2 are associated with a very high degree of uncertainty (Table VI). Therefore, it is not possible to determine at which exposure rates the first and second mutation rates saturate.
EPIC data (males and females) and CPS-II data
The grouped EPIC data for males and females and the CPS-II data were then used within joint model fits. This was done in an approach where smoking dependence was allowed in μ1 but also for a constant μ1 [i.e. μ1(s) = μ0]. With this approach we aimed at exploring whether the EPIC data might still be consistent with a smoking dependence in the first mutation rate. Table VI gives the results of a joint fit of the grouped EPIC data for males and females with the CPS-II data (fit-RIVM10). This fit allowed for smoking dependence in μ1. The resulting –loglikelihood (766.55) needs to be compared with the sum of the –loglikelihood values achieved by fitting the grouped EPIC data for males and females jointly and the CPS-II data (fit-RIVM8) separately: –loglikelihood = 663.80 + 82.39 = 746.19. In these separate fits, 11 free parameters were used, whereas for fit-RIVM10 6 free parameters were used. At the 5% significance level, fit-RIVM10 is therefore a worse description than the separate fits. Using μ0 for EPIC males, females and CPS-II data as three separate free parameters in the joint fit instead of one leads to a significant improvement of 5.29 points in –loglikelihood (not shown). However, this joint fit is still not significantly better than the separate model fits. When a constant smoking independent μ1 was applied in a joint fit, the resulting value of the –loglikelihood was much higher than the one from fit-RIVM10.
EPIC data (males) and British doctors’ data
A joint fit of the grouped EPIC data for males and the British doctors’ data was performed, allowing for one joint background mutation rate and for one joint set of smoking rate-related parameters (Table VI: fit-RIVM11). The resulting value for the –loglikelihood (394.54) needs to be compared with the sum of the –loglikelihood values of a fit of the grouped EPIC males data and fit-RIVM9: –loglikelihood = 359.77 + 28.73 = 388.5. Considering the reduction of the free parameters, fit-RIVM11 is at the 5% level slightly worse than the separate fits. Another joint model fit that allowed for two different μ0s for the two sets of data only led to a small not significant improvement in –loglikelihood (results not shown). A joint fit that did not allow for smoking dependence in μ1 led to a much higher value for the −loglikelihood (i.e. to a worse description than fit-RIVM11).
Figure 7 gives the risk predictions calculated with the best estimate values of the fits of EPIC males (grouped and individual data), the British doctors’ data (fit-RIVM9) and the joint fit of EPIC males and the British doctors’ data (fit-RIVM11). The curves refer to lifelong model smokers who started smoking at age 20, smoking 0–60 cigarettes per day. The British doctors’ data comprise 8 mean smoking rates from 2.7 to 38 cigarettes per day (56). In the EPIC study a majority of the individuals also have smoking rates in this range. The similar –loglikelihood values for the joint and the separate fits (Table VI) therefore confirm the similar risk values at low exposure rates. Figure 7 shows that the various risk predictions are similar for low smoking rates but different at higher rates. When the grouped EPIC data were fitted, the resulting best estimate values for the plateau parameters turned out to be larger compared with the results from fit-RIVM1. This is reflected in the faster saturation of the risk functions that are based on the individual fit. It should be emphasized that this fit of the grouped data allowed for a smoking dependence in μ1, whereas fit-RIVM1 did not.
Fig. 7.

Lifetime excess absolute (A) and excess relative risk (B) versus exposure rate s for lifelong smokers. Smoking was started at an age of 20 years. Three of the curves are based on best estimates given in Tables IV and VI.
Discussion
The aim of the present analysis was to describe the smoking-related lung cancer risk in a large European epidemiological cohort data set using the stochastic two-stage model. Two other historical data sets have also been analysed with the aim to find a consistent mathematical description with the EPIC data.
EPIC data
The analyses started out by using the EPIC data in a grouped form to do extensive global searches in the large parameter space. With the best estimates from these analyses as starting values, follow-up fits were then performed with the individual EPIC data. Model fits to the EPIC data for males and females revealed a smoking dependence for the second mutation rate, μ2, and the clonal expansion parameter, ε. A saturation behaviour for high smoking rates was also found (Figure 2). It should be emphasized that the very large CIs that were found for y2 in the fit, that still allowed for μ1 to be smoking dependent, do not prove the absence of smoking dependence for this rate. It merely shows that the information that is contained in the EPIC data does not allow the determination of any possible smoking dependence of μ1 with reasonable certainty. The findings of smoking action presented here reflect those of an earlier study with the TSCE model. There, smoking had an effect on promotion and malignant transformation but not on initiation (63). Another study by Heidenreich et al. (64) confirmed these trends for smoking and radon-exposed rats. As it can be seen in Figure 3, the model fits the data well at low, medium and at high exposure rates.
One fit of the individual data set of EPIC males has also been performed with β as a free parameter in addition to the other free parameters. This fit did not lead to very different results for the other free parameters. The –loglikelihood was, however, significantly improved compared with fit-RIVM1 (Table IV). Arguments for not including β as a free parameter have been given (53).
A consistent model description for males and females was achieved by fitting the two different individual EPIC data sets for males and females jointly with one set of free parameters for males and for females. The fact that consistent descriptions of the EPIC data for males and females were found is an important result. Only one set of smoking-dependent parameters is necessary to describe these data. From the analysis of the EPIC data with the two-stage model we found no differences in the background rates and in the smoking-related parameters for males and females. In our modelling approach, all differences in lung cancer incidence between males and females can be attributed to differences in their smoking habits.
To investigate the relative importance of smoking rate, age at start of smoking and the smoking duration on the cancer risk, a series of simulations was performed using the best estimates of the joint fit of EPIC males and females (fit-RIVM3). The first simulation used a set of model smokers who all started smoking at age 20 and smoked their entire life at smoking rates of 20, 30, 40, 50 and 60 cigarettes per day. The data set also contained a non-smoker. Ratios of the excess relative risks (ERR) for various smoking rates were then calculated at an age of 70 years. Analogous simulations were also performed for a group of men and women who started at various ages and smoked 20 cigarettes per day for life. To assess the influence of smoking duration, another simulation was performed for a set of model smokers who all started smoking at age 20 and who stopped at various times after smoking 20 cigarettes per day. The results are summarized in Table VII. They indicate that with respect to cancer risk it is mainly the ages (age of smoking initiation and duration of smoking) that matter and that the smoking rates make a smaller difference. The latter reflects the saturation behaviour found for μ2 and ε (refer to Figure 2). With respect to public health interventions these findings imply that teenage smoking should be prevented and that smoking should be stopped as early as possible.
Table VII.
Ratios of the excess relative risk (ERR) for three different simulations of male and female model smokers
| Start age 20, lifelong smokers | |
| ERR (s = 60 cigarettes per day)/ERR (s = 20 cigarettes per day) | 1.5 |
| ERR (s = 50 cigarettes per day)/ERR (s = 20 cigarettes per day) | 1.4 |
| ERR (s = 40 cigarettes per day)/ERR (s = 20 cigarettes per day) | 1.4 |
| ERR (s = 30 cigarettes per day)/ERR (s = 20 cigarettes per day) | 1.3 |
| s = 20 cigarettes per day, lifelong smokers | |
| ERR (start age 15)/ERR (start age 55) | 13.6 |
| ERR (start age 25)/ERR (start age 55) | 8.5 |
| ERR (start age 35)/ERR (start age 55) | 4.5 |
| ERR (start age 45)/ERR (start age 55) | 2.2 |
| s = 20 cigarettes per day, start age 20 | |
| ERR (stop age 70)/ERR (stop age 30) | 72.2 |
| ERR (stop age 60)/ERR (stop age 30) | 18.5 |
| ERR (stop age 50)/ERR (stop age 30) | 8.3 |
| ERR (stop age 40)/ERR (stop age 30) | 3.4 |
The best estimates of fit-RIVM3 were applied. The ERRs refer to an age of 70 years.
The EPIC data were also analysed countrywise. We found that, if countrywise variations are allowed, it was preferable to describe the eight different data sets for males with the same set of smoking coefficients but with three different background mutation rates. Similar results were found for the females. The differences in baseline cancer incidence in different populations were described by different background mutation rates with one joint set of smoking parameters. This suggests the possibility of risk transfer between populations of different countries. Figure 4B shows the finding that the women from Greece and Spain have lower background mutation rates than the women from other countries. This corresponds to the fact that in the EPIC cohort the lung cancer incidence rate per 100 000 person-years is lowest for women from Greece and second lowest for women from Spain (Table I in ref. 54). In this comparison, however, one has to bear in mind that Miller et al. (54) give the incidence rates for the whole EPIC cohort, including smokers and ex-smokers. The differences in μ0 also reflect differences in dietary habits, environmental pollution, radon concentrations, genetic make-up and also possible differences in detection rates and diagnostic criteria for lung cancer in different EPIC study centres.
The age-specific cumulative incidence given in Figure 5A shows that quitting to smoke at a certain age (here 50 years) shows an instantaneous effect in the cumulative incidence with a time delay due to tlag of 5 years. The sudden increase in the hazard tlag after smoking was started is due to the smoking effect on μ2. The same holds for the pronounced decrease of the hazard rate tlag after smoking was stopped. After the initial sudden increase of the hazard an additional smaller increasing effect is visible in Figure 5B, reflecting the influence of ε(s). The hazard for non-smokers increases roughly exponentially (lower curve in Figure 5B) and so do the hazards for ex-smokers, with sharp decreases 5 years after smoking was stopped. In reality, tlag, the growth time from a malignant cell into a fatal tumour, would follow a distribution and that would attenuate the decrease. The hazard for ex-smokers does not reduce to the hazard of non-smokers. This has also been found by others (63,65). Similar to the findings of the most recent study on smoking-related mortality in male British doctors (66), we found that smoking cessation at an age of 50 approximately halves the hazard. The results given in Figure 5C indicate that cigarette smoking leads to a marked increase in excess relative risk. The hazard rates given in Figure 5B do not level at high ages as found by others (63,67). This has to do with the fact that β = 0 was used in the RIVM fits together with the setting μ01 = μ02. Very similar risk patterns have been found by the ISI group.
The saturation in the risk functions in Figure 6 means that there is not much difference in lung cancer risk between smokers of, for example, 40 and 50 cigarettes per day. At low smoking rates the risk predictions for males and females turn out to be rather similar, reflecting the similarities in the best estimates of the slope parameter m1 with largely overlapping 95% CIs (Table IV). Figure 6A and B shows that the predicted risks for males who smoke heavily are lower than those for females at high smoking rates. This reflects the lower best estimate value for ε2 found in fit-RIVM1 compared with fit-RIVM2 (Table IV). The risk predictions for males and females at high smoking rates are associated with some uncertainties due to the larger 95% CIs for m2 in the associated model fits (Table IV). Again, it was found that ISI predicts similar risks at all exposure rates.
The bio-mathematical model description of smoking effects presented in this paper could also be important in analyses of the joint effects of radiation and smoking on lung cancer risk among atomic bomb survivors. A recent study on this subject points out the possibility of misleading inferences about radiation risks among A-bomb survivors when smoking effects are ignored (68).
Possible influence of first mutation rate
When μ1 = μ1(s) was allowed in the model fits of EPIC males and females, the largest smoking dependence was found in μ1 with very large CIs and a somewhat smaller influence on μ2. At higher smoking rates saturation occurs. The smallest exposure rate dependence was associated with ε, which consequently saturated fastest. As mentioned above, the large uncertainties associated with the estimated value for y2 indicated the use of a constant μ1 = μ0. The EPIC data could, however, still be consistent with a smoking rate-dependent first mutation rate. Concerning risk estimates, any possible smoking influence on μ1 would lead to a slightly stronger increase and decrease in the hazard rate after smoking was started and stopped, respectively.
Although the follow-up time available in the EPIC study is limited (the average follow-up duration is 5 years), the data contain a reconstruction of the smoking histories of all individuals in the study. This reconstruction, however, is subject to errors and biases. That might explain the large uncertainties that were found for the plateau value y2 of μ1 because it is the initiation part that depends on the smoking history from a longer time ago. For radiation this has been illustrated (69). They showed that an effect on initiation only appeared ~60 years after the exposure ended (see Figure 3 in ref. 69), as cells that were initiated by an exposure still need to undergo clonal expansion, malignant transformation and the lag time until they can be detected as a lung cancer. Because most person-years in the EPIC study are in the age range of 40–65 years, not many subjects are observed with smoking exposure more than 50 years ago, which might explain the large uncertainty in estimating the effects of smoking on μ1.
An interesting question to consider relates to the influence that a smoking-dependent first mutation rate would have on the risk patterns. This was investigated using the results from fit-RIVM3 (joint fit of EPIC males and females) and another analogous model fit that allowed for μ1 = μ1(s). With the best estimated values from these fits the excess relative hazards and the lifetime risks (LEAR and LERR) were calculated for different model smokers who started smoking at different ages and for different periods of time. It was found that the ratio of the excess relative hazards for model fits with and without smoking-dependent μ1 was largest for those model smokers who started smoking earlier. The ratio was highest for smokers who started smoking at young ages and who only smoked for short periods of time. For example, for individuals who started smoking 20 cigarettes per day at an age of 15 years and who smoked for 5 years, the ratio in excess relative hazard was ~3.5. These findings are in accordance with the patterns detected by Luebeck and Hazelton (69) as pointed out in the previous paragraph (refer to Figure 3 in ref. 69). To find any influence that an exposure might have on initiation it is therefore advisable to include many individuals in epidemiological studies who started smoking very early in their life and who also quit smoking early.
Discussion of joint analysis with other data
Fitting the CPS-II data showed the strongest carcinogenic action of cigarette smoke at the first mutation rate with smaller smoking dependencies in μ2(s) and ε(s) and saturation in all three model parameters (Table VI). Any approach that applied a constant and smoking rate-independent μ1(s) = μ0 led to strongly increased –loglikelihood values. This suggested a smoking rate-dependent first mutation rate for the CPS-II data. The analysis of the British doctors’ data showed a strong linear smoking dependence in μ1(s) and μ2(s) with almost no influence on ε(s). Because of the small number of smoking rate values available in these two data sets, only limited information on the smoking action could be extracted by fitting the model to the data. The exposure rate dependence on the first mutation rate that has been detected for the joint fit of the EPIC data with either the CPS-II or the British doctors’ data (Table VI) is clearly associated with these two historic sets of data. These joint fits are at the 5% significance level statistically worse descriptions than the separate fits, indicated by positive values for Δcorr in Table VI. The joint fit of EPIC males and British doctors’ data was, however, only slightly worse than the separate fits.
The British doctors’ data had previously been analysed (24,70). Moolgavkar et al. (70) found that with these data it was not possible to distinguish among various hypotheses regarding the relative roles of the two mutation rates and the kinetics of intermediate cell growth in cigarette smoke-induced lung cancer. In their study, however, an approximate solution of the two-mutation model was applied. In a later analysis the exact solution was used and it was found that cigarette smoking affected the first mutation rate and the kinetics of intermediate cell division but not the second mutation rate (12).
The results of the present study demonstrate that the simplest model description of the EPIC data did not allow for any smoking rate dependence in the first mutation rate. For the exposure rate dependencies of the second mutation rate and the rate of net clonal expansion a saturating behaviour was found. When the TSCE model was applied to the EPIC data, the results found for the biological action of cigarette smoke in lung carcinogenesis were consistent with the findings of the group at RIVM. This includes the strong similarities found in the risk patterns.
Earlier analyses that also used the two-stage model but other data sets came to different conclusions. Little et al. (14), for example, tested two- and three-mutation models on a case-control and on a cohort data set of lung cancer mortality in the Colorado Plateau uranium miners. They found that the first mutation rate was dependent on cigarette-smoke exposure in accordance with the findings of Luebeck et al. (71). In addition, the latter group also found a strong effect of cigarette smoke on the proliferation rate of initiated cells (71). It should, however, be mentioned that these earlier studies involved individuals with significant radiation exposure. The modelling presented here shows that for the EPIC data it is difficult to separate effects of smoking on different stages but that more information on effects on the first mutation rate could be found when studies are done with early starters–early stoppers. In the EPIC study the follow-up time may be too short to make a conclusive inference about the smoking influence on the different stages that are involved in carcinogenesis. Therefore, public health implications also should be considered with caution at the present stage.
From the abundance of scientific studies conducted on the biological effects caused by cigarette smoke, it is evident that both mutational and promoting effects can be induced. This reflects the findings of the present study.
Acknowledgements
The authors would like to thank Dr Andrew Roddam, Cancer Research, UK, Epidemiology Unit, and Dr Kurt Hoffmann, German Institute of Human Nutrition, Potsdam-Rehbrücke, for critically reading the manuscript and for their valuable comments. This work was supported by a Marie Curie Individual Fellowship EC Contract No. FIGH-CT-2002-50513, by a Marie Curie European Reintegration Grant within the 6th European Community Frame-work Program (EC Contract No. MERG-CT-2004-006610) and in part by the ‘RISC-RAD’ project EC Contract No. FI6R-CT-2003-508842 and by the Austrian Science Foundation FWF (project P18055-N02). The project was made possible by a grant of the European Community (5th Framework Program) to P.V. (GENAIR investigation, grant QLK4-CT-1999-00927) and a grant of the Compagnia di San Paolo to the ISI Foundation.
Abbreviations
- CI
confidence interval
- CPS
Cancer Prevention Study
- EPIC
European Prospective Investigation into Cancer and Nutrition
- ERR
excess relative risk
- LEAR
lifetime excess absolute risk
- LERR
lifetime excess relative risk
- TSCE
two-step clonal expansion model
Appendix: Epic Collaborators
Drs Rodolfo Saracci, International Agency for Research on Cancer, Lyon, France; Elio Riboli, International Agency for Research on Cancer, Lyon, France; Kim Overvad, Department of Clinical Epidemiology, Aalborg Hospital, Aarhus University Hospital, Aalborg, Denmark; Ole Raaschou-Nielsen, Institute of Cancer Epidemiology, Danish Cancer Society, Copenhagen, Denmark; Francoise Clavel-Chapelon, INSERM U521, Institut Gustave Roussy, Villejuif, France; Jacob Linseisen, Division of Clinical Epidemiology, Deutsches Krebsforschungszentrum, Heidelberg, Germany; Heiner Boeing, German Institute of Human Nutrition, Potsdam-Rehbrücke, Germany; Antonia Trichopoulou, Department of Hygiene and Epidemiology, Medical School, University of Athens, Greece; Domenico Palli, Cancer Risk Factor Branch, CSPO Scientific Institute of Tuscany Region, Florence, Italy; Marco Peluso, Cancer Risk Factor Branch, CSPO, Scientific Institute of Tuscany Region, Florence, Italy; Vittorio Krogh, Department of Epidemiology, National Cancer Istitute, Milan, Italy; Rosario Tumino, Cancer Registry, Azienda Ospedaliera ‘Civile M.P. Arezzo’, Ragusa, Italy; Salvatore Panico, Dipartimento di Medicina Clinica e Sperimentale, Università Federico II, Naples, Italy; H. Bas Bueno-De-Mesquita, Centre for Nutrition and Health, National Institute for Public Health and the Environment, Bilthoven, The Netherlands; Petra H. Peeters, Julius Center for Health Sciences and Primary Care, University Medical Center, Utrecht, The Netherlands; Eiliv Lund, Institute of Community Medicine, University of Tromsø, Norway; Carlos A. Gonzalez, Department of Epidemiology, Catalan Institute of Oncology, Barcelona, Spain. Consejería de Sanidad y Servicios Sociales; Carmen Martinez, Andalusian School of Public Health, Granada, Spain; Miren Dorronsoro, Department of Public Health of Guipuzkoa, San Sebastian, Spain; Aurelio Barricarte, Public Health Institute, Navarra, Spain; Lluis Cirera, Department of Epidemiology, Regional Health Council, Murcia, Spain; J. Ramón Quirós, Public Health and Health Planning Directorate, Asturias, Spain; Goran Berglund, Malmö Diet and Cancer Study, Lund University, Malmö, Sweden; Bertil Forsberg, Department of Public Health and Clinical Medicine, University of Umeå, Sweden; Nicholas E. Day, MRC Dunn Human Nutrition Unit, Cambridge, UK; Tim J. Key, Cancer Research UK Epidemiology Unit, University of Oxford, UK.
Footnotes
Conflict of Interest Statement: None declared.
References
- 1.Nordling CO. A new theory on cancer-inducing mechanism. Br. J. Cancer. 1953;7:68–72. doi: 10.1038/bjc.1953.8. [DOI] [PMC free article] [PubMed] [Google Scholar]
- 2.Stocks P. A study of the age curve for cancer of the stomach in connection with a theory of the cancer producing mechanism. Br. J. Cancer. 1953;7:407–417. doi: 10.1038/bjc.1953.39. [DOI] [PMC free article] [PubMed] [Google Scholar]
- 3.Armitage P, Doll R. The age distribution of cancer and a multi-stage theory of carcinogenesis. Br. J. Cancer. 1954;8:1–12. doi: 10.1038/bjc.1954.1. [DOI] [PMC free article] [PubMed] [Google Scholar]
- 4.Armitage P, Doll R. A two-stage theory of carcinogenesis in relation to the age distribution of human cancer. Br. J. Cancer. 1957;11:161–169. doi: 10.1038/bjc.1957.22. [DOI] [PMC free article] [PubMed] [Google Scholar]
- 5.Chen CW. Armitage-Doll two-stage model: implications and extension. Risk Anal. 1993;13:273–279. doi: 10.1111/j.1539-6924.1993.tb01079.x. [DOI] [PubMed] [Google Scholar]
- 6.Knudson AG., Jr Mutation and cancer: statistical study of retino-blastoma. Proc. Natl Acad. Sci. USA. 1971;68:820–823. doi: 10.1073/pnas.68.4.820. [DOI] [PMC free article] [PubMed] [Google Scholar]
- 7.Moolgavkar SH. The multistage theory of carcinogenesis and the age distribution of cancer in man. J. Natl Cancer Inst. 1978;61:49–52. doi: 10.1093/jnci/61.1.49. [DOI] [PubMed] [Google Scholar]
- 8.Moolgavkar SH, Venzon D. Two-event models for carcinogenesis: incidence curves for childhood and adult tumors. Math. Biosci. 1979;47:55–77. [Google Scholar]
- 9.Moolgavkar SH, Knudson AG., Jr Mutation and cancer: a model for human carcinogenesis. J. Natl Cancer Inst. 1981;66:1037–1052. doi: 10.1093/jnci/66.6.1037. [DOI] [PubMed] [Google Scholar]
- 10.Tan W. Stochastic Models of Carcinogenesis. Marcel Dekker; New York: 1991. [Google Scholar]
- 11.Little MP. Are two mutations sufficient to cause cancer? Some generalizations of the two-mutation model of carcinogenesis of Moolgavkar, Venzon, and Knudson, and of the multistage model of Armitage and Doll. Biometrics. 1995;51:1278–1291. [PubMed] [Google Scholar]
- 12.Moolgavkar SH, Luebeck EG, Krewski D, Zielinski JM. Radon, cigarette smoke, and lung cancer: a re-analysis of the Colorado Plateau uranium miners’ data. Epidemiology. 1993;4:204–217. [PubMed] [Google Scholar]
- 13.Hazelton WD, Luebeck EG, Heidenreich WF, Moolgavkar SH. Analysis of a historical cohort of Chinese tin miners with arsenic, radon, cigarette smoke, and pipe smoke exposures using the biologically based two-stage clonal expansion model. Radiat. Res. 2001;156:78–94. doi: 10.1667/0033-7587(2001)156[0078:aoahco]2.0.co;2. [DOI] [PubMed] [Google Scholar]
- 14.Little MP, Haylock RG, Muirhead CR. Modelling lung tumour risk in radon-exposed uranium miners using generalizations of the two-mutation model of Moolgavkar, Venzon and Knudson. Int. J. Radiat. Biol. 2002;78:49–68. doi: 10.1080/09553000110085797. [DOI] [PubMed] [Google Scholar]
- 15.Heidenreich WF. On the parameters of the clonal expansion model. Radiat. Environ. Biophys. 1996;35:127–129. doi: 10.1007/BF02434036. [DOI] [PubMed] [Google Scholar]
- 16.Scott BR. Mechanistic state vector model for cell killing by ionizing radiation. Radiat. Environ. Biophys. 1977;14:195–211. doi: 10.1007/BF01323939. [DOI] [PubMed] [Google Scholar]
- 17.Scott BR. A mechanistic model for neoplastic transformation of cells by high LET radiation and its implication for low dose, low dose rate risk assessment. Radiat. Prot. Dosim. 1997;72:105–117. [Google Scholar]
- 18.Crawford-Brown DJ, Hofmann W. A generalized state-vector model for radiation-induced cellular transformation. Int. J. Radiat. Biol. 1990;57:407–423. doi: 10.1080/09553009014552501. [DOI] [PubMed] [Google Scholar]
- 19.Schöllnberger H, Scott BR, Hanson TE. Application of Bayesian inference to characterize risks associated with low doses of low-LET radiation. Bull. Math. Biol. 2001;63:865–883. doi: 10.1006/bulm.2001.0243. [DOI] [PubMed] [Google Scholar]
- 20.Schöllnberger H, Mitchel REJ, Azzam EI, Crawford-Brown DJ, Hofmann W. Explanation of protective effects of low doses of gamma-radiation with a mechanistic radiobiological model. Int. J. Radiat. Biol. 2002;78:1159–1173. doi: 10.1080/0955300021000034693. [DOI] [PubMed] [Google Scholar]
- 21.Schöllnberger H, Stewart RD, Mitchel REJ, Hofmann W. An examination of radiation hormesis mechanisms using a multi-stage carcinogenesis model. Nonlin. Biol. Tox. Med. 2004;2:317–352. doi: 10.1080/15401420490900263. [DOI] [PMC free article] [PubMed] [Google Scholar]
- 22.Leenhouts HP, Chadwick KH. A two-mutation model of radiation carcinogenesis: application to lung tumours in rodents and implications for risk evaluation. J. Radiol. Prot. 1994;14:115–130. [Google Scholar]
- 23.Moolgavkar SH, Luebeck EG. Two-event model for carcinogenesis: biological, mathematical, and statistical considerations. Risk Anal. 1990;10:323–341. doi: 10.1111/j.1539-6924.1990.tb01053.x. [DOI] [PubMed] [Google Scholar]
- 24.Leenhouts HP. Radon-induced lung cancer in smokers and non-smokers: risk implications using a two-mutation carcinogenesis model. Radiat. Environ. Biophys. 1999;38:57–71. doi: 10.1007/s004110050138. [DOI] [PubMed] [Google Scholar]
- 25.Brugmans MJP, Rispens SM, Bijwaard H, Laurier D, Rogel A, Tomášek L, Tirmarche M. Radon-induced lung cancer in French and Czech miner cohorts described with a two-mutation cancer model. Radiat. Environ. Biophys. 2004;43:153–163. doi: 10.1007/s00411-004-0247-6. [DOI] [PubMed] [Google Scholar]
- 26.Heidenreich WF, Luebeck EG, Moolgavkar SH. Some properties of the hazard function of the two-mutation clonal expansion model. Risk Anal. 1997;17:391–399. doi: 10.1111/j.1539-6924.1997.tb00878.x. [DOI] [PubMed] [Google Scholar]
- 27.Heidenreich WF, Jacob P, Paretzke HG. Exact solutions of the clonal expansion model and their application to the incidence of solid tumors of atomic bomb survivors. Radiat. Environ. Biophys. 1997;36:45–58. doi: 10.1007/s004110050054. [DOI] [PubMed] [Google Scholar]
- 28.Heidenreich WF, Paretzke HG. The two-stage clonal expansion model as an example of a biologically based model of radiation-induced cancer. Radiat. Res. 2001;156:678–681. doi: 10.1667/0033-7587(2001)156[0678:ttscem]2.0.co;2. [DOI] [PubMed] [Google Scholar]
- 29.Riboli E, Kaaks R. The EPIC project: rationale and study design. Int. J. Epidemiol. 1997;26(Suppl. 1):S6–S14. doi: 10.1093/ije/26.suppl_1.s6. [DOI] [PubMed] [Google Scholar]
- 30.Van Duuren BL, Sivak A, Katz C, Melchionne S. Cigarette smoke carcinogenesis: importance of tumor promoters. J. Natl Cancer Inst. 1971;47:235–240. [PubMed] [Google Scholar]
- 31.Miyashita M, Willey JC, Sasajima K, Lechner JF, LaVoie EJ, Hoffmann D, Smith M, Trump BF, Harris CC. Differential effects of cigarette smoke condensate and its fractions on cultured normal and malignant human bronchial epithelial cells. Exp. Pathol. 1990;38:19–29. doi: 10.1016/s0232-1513(11)80192-1. [DOI] [PubMed] [Google Scholar]
- 32.Hainaut P, Vähäkangas K. p53 as a sensor of carcinogenic exposures: mechanisms of p53 protein induction and lessons from p53 gene mutations. Pathol. Biol. (Paris) 1997;45:833–844. [PubMed] [Google Scholar]
- 33.Brambilla E, Brambilla C. p53 and lung cancer. Pathol. Biol. (Paris) 1997;45:852–863. [PubMed] [Google Scholar]
- 34.Rubin H. Selective clonal expansion and microenvironmental permissiveness in tobacco carcinogenesis. Oncogene. 2002;21:7392–7411. doi: 10.1038/sj.onc.1205800. [DOI] [PubMed] [Google Scholar]
- 35.Anderson GP, Bozinovski S. Acquired somatic mutations in the molecular pathogenesis of COPD. Trends Pharmacol. Sci. 2003;24:71–76. doi: 10.1016/S0165-6147(02)00052-4. [DOI] [PubMed] [Google Scholar]
- 36.Thilly WG. Have environmental mutagens caused oncomutations in people? Nat. Genet. 2003;34:255–259. doi: 10.1038/ng1205. [DOI] [PubMed] [Google Scholar]
- 37.Denissenko MF, Pao A, Tang M, Pfeifer GP. Preferential formation of benzo[a]pyrene adducts at lung cancer mutational hotspots in P53. Science. 1996;274:430–432. doi: 10.1126/science.274.5286.430. [DOI] [PubMed] [Google Scholar]
- 38.Roland M, Rudd RM. Genetics and pulmonary medicine. 7. Somatic mutations in the development of lung cancer. Thorax. 1998;53:979–983. doi: 10.1136/thx.53.11.979. [DOI] [PMC free article] [PubMed] [Google Scholar]
- 39.Hussain SP, Harris CC. p53 mutation spectrum and load: the generation of hypotheses linking the exposure of endogenous or exogenous carcinogens to human cancer. Mutat. Res. 1999;428:23–32. doi: 10.1016/s1383-5742(99)00028-9. [DOI] [PubMed] [Google Scholar]
- 40.Bennett WP, Hussain SP, Vähäkangas KH, Khan MA, Shields PG, Harris CC. Molecular epidemiology of human cancer risk: gene–environment interactions and p53 mutation spectrum in human lung cancer. J. Pathol. 1999;187:8–18. doi: 10.1002/(SICI)1096-9896(199901)187:1<8::AID-PATH232>3.0.CO;2-Y. [DOI] [PubMed] [Google Scholar]
- 41.Forgacs E, Zöchbauer-Müller S, Olah E, Minna JD. Molecular genetic abnormalities in the pathogenesis of human lung cancer. Pathol. Oncol. Res. 2001;7:6–13. doi: 10.1007/BF03032598. [DOI] [PubMed] [Google Scholar]
- 42.Hainaut P, Pfeifer GP. Patterns of p53 G-T transversions in lung cancers reflect the primary mutagenic signature of DNA-damage by tobacco smoke. Carcinogenesis. 2001;22:367–374. doi: 10.1093/carcin/22.3.367. [DOI] [PubMed] [Google Scholar]
- 43.Pfeifer GP, Denissenko MF, Olivier M, Tretyakova N, Hecht SS, Hainaut P. Tobacco smoke carcinogens, DNA damage and p53 mutations in smoking-associated cancers. Oncogene. 2002;21:7435–7451. doi: 10.1038/sj.onc.1205803. [DOI] [PubMed] [Google Scholar]
- 44.Vähäkangas K. TP53 mutations in workers exposed to occupational carcinogens. Hum. Mutat. 2003;21:240–251. doi: 10.1002/humu.10182. [DOI] [PubMed] [Google Scholar]
- 45.DeMarini DM. Genotoxicity of tobacco smoke and tobacco smoke condensate: a review. Mutat. Res. 2004;567:447–474. doi: 10.1016/j.mrrev.2004.02.001. [DOI] [PubMed] [Google Scholar]
- 46.de la Chica RA, Ribas I, Giraldo J, Egozcue J, Fuster C. Chromosomal instability in amniocytes from fetuses of mothers who smoke. JAMA. 2005;293:1212–1222. doi: 10.1001/jama.293.10.1212. [DOI] [PubMed] [Google Scholar]
- 47.United Nations . Report to the General Assembly, with scientific annexes. New York: 2000. Sources and Effects of Ionizing Radiation. Volume I: Sources; Volume II: Effects. , United Nations Scientific Committee on the Effects of Atomic Radiation. 2000. United Nations sales publication E.00.IX.3 and E.00.IX.4. United Nations. [Google Scholar]
- 48.Hoshino Y, Mio T, Nagai S, Miki H, Ito I, Izumi T. Cytotoxic effects of cigarette smoke extract on an alveolar type II cell-derived cell line. Am. J. Physiol. Lung Cell. Mol. Physiol. 2001;281:L509–L516. doi: 10.1152/ajplung.2001.281.2.L509. [DOI] [PubMed] [Google Scholar]
- 49.Ishii T, Matsuse T, Igarashi H, Masuda M, Teramoto S, Ouchi Y. Tobacco smoke reduces viability in human lung fibroblasts: protective effect of glutathione S-transferase P1. Am. J. Physiol. Lung Cell. Mol. Physiol. 2001;280:L1189–L1195. doi: 10.1152/ajplung.2001.280.6.L1189. [DOI] [PubMed] [Google Scholar]
- 50.Pouli AE, Hatzinikolaou DG, Piperi C, Stavridou A, Psallidopoulos MC, Stavrides JC. The cytotoxic effect of volatile organic compounds of the gas phase of cigarette smoke on lung epithelial cells. Free Radic. Biol. Med. 2003;34:345–355. doi: 10.1016/s0891-5849(02)01289-3. [DOI] [PubMed] [Google Scholar]
- 51.Wickenden JA, Clarke MC, Rossi AG, Rahman I, Faux SP, Donaldson K, MacNee W. Cigarette smoke prevents apoptosis through inhibition of caspase activation and induces necrosis. Am. J. Respir. Cell Mol. Biol. 2003;29:562–570. doi: 10.1165/rcmb.2002-0235OC. [DOI] [PubMed] [Google Scholar]
- 52.Harris MD, Leenhouts HP, Uijt de Haag PAM. A two-mutation model of carcinogenesis: application to lung tumours using rat experimental data. 1998. RIVM Report No. 610065006.
- 53.Brugmans MJ, Bijwaard H, Leenhouts HP. The overrated role of ‘promotion’ in mechanistic modelling of radiation carcinogenesis. J. Radiol Prot. 2002;22:A75–A79. doi: 10.1088/0952-4746/22/3a/314. [DOI] [PubMed] [Google Scholar]
- 54.Miller AB, Altenburg HP, Bueno-de-Mesquita B, et al. Fruits and vegetables and lung cancer: findings from the European Prospective Investigation into Cancer and Nutrition. Int. J. Cancer. 2004;108:269–276. doi: 10.1002/ijc.11559. [DOI] [PubMed] [Google Scholar]
- 55.Halpern MT, Gillespie BW, Warner KE. Patterns of absolute risk of lung cancer mortality in former smokers. J. Natl Cancer Inst. 1993;85:457–464. doi: 10.1093/jnci/85.6.457. [DOI] [PubMed] [Google Scholar]
- 56.Doll R, Peto R. Cigarette smoking and bronchial carcinoma: dose and time relationships among regular smokers and lifelong non-smokers. J. Epidemiol. Community Health. 1978;32:303–313. doi: 10.1136/jech.32.4.303. [DOI] [PMC free article] [PubMed] [Google Scholar]
- 57.Doll R, Hill AB. Mortality in relation to smoking: ten years observations of British doctors. British Medical J. 1964;1:1399–1410. 1460–1467. doi: 10.1136/bmj.1.5395.1399. [DOI] [PMC free article] [PubMed] [Google Scholar]
- 58.Venzon DJ, Moolgavkar SH. A method for computing profile-likelihood-based confidence intervals. Appl. Statist. 1988;37:87–94. [Google Scholar]
- 59.Ingber L. Simulated annealing: practice versus theory. Mathl. Comput. Modelling. 1993;18:29–57. Available at www.ingber.com. [Google Scholar]
- 60.Ingber L. Adaptive Simulated Annealing (ASA) 2004. Copyright © 1993–2004 Lester Ingber. Available at http://www.ingber.com/ASA-README.html.
- 61.Powell MJD. An efficient method for finding the minimum of a function of several variables without calculating derivatives. Computer J. 1964;7:155–162. [Google Scholar]
- 62.Nelder JA, Mead R. A simplex method for function minimization. Computer J. 1964;7:308–313. [Google Scholar]
- 63.Heidenreich WF, Wellmann J, Jacob P, Wichmann HE. Mechanistic modelling in large case-control studies of lung cancer risk from smoking. Stat. Med. 2002;21:3055–3070. doi: 10.1002/sim.1246. [DOI] [PubMed] [Google Scholar]
- 64.Heidenreich WF, Morlier JP, Monchaux G. Interaction of smoking and radon in rats: a biologically based mechanistic model. Radiat. Environ. Biophys. 2005;44:145–148. doi: 10.1007/s00411-005-0006-3. [DOI] [PubMed] [Google Scholar]
- 65.Simonato L, Agudo A, Ahrens W, et al. Lung cancer and cigarette smoking in Europe: an update of risk estimates and an assessment of inter-country heterogeneity. Int. J. Cancer. 2001;91:876–887. doi: 10.1002/1097-0215(200102)9999:9999<::aid-ijc1139>3.0.co;2-7. [DOI] [PubMed] [Google Scholar]
- 66.Doll R, Peto R, Boreham J, Sutherland I. Mortality in relation to smoking: 50 years’ observations on male British doctors. BMJ. 2004;328:1519–1527. doi: 10.1136/bmj.38142.554479.AE. [DOI] [PMC free article] [PubMed] [Google Scholar]
- 67.Becker N. Cigarette smoking and lung cancer: a reconsideration of the British doctors’ data with cumulative damage models. Epidemiology. 1994;5:27–34. [PubMed] [Google Scholar]
- 68.Pierce DA, Sharp GB, Mabuchi K. Joint effects of radiation and smoking on lung cancer risk among atomic bomb survivors. Radiat. Res. 2003;159:511–520. doi: 10.1667/0033-7587(2003)159[0511:jeoras]2.0.co;2. [DOI] [PubMed] [Google Scholar]
- 69.Luebeck EG, Hazelton WD. Multistage carcinogenesis and radiation. J. Radiol. Prot. 2002;22:A43–A49. doi: 10.1088/0952-4746/22/3a/308. [DOI] [PubMed] [Google Scholar]
- 70.Moolgavkar SH, Dewanji A, Luebeck EG. Cigarette smoking and lung cancer: reanalysis of the British doctors’ data. J. Natl Cancer Inst. 1989;81:415–420. doi: 10.1093/jnci/81.6.415. [DOI] [PubMed] [Google Scholar]
- 71.Luebeck EG, Heidenreich WF, Hazelton WD, Paretzke HG, Moolgavkar SH. Biologically based analysis of the data for the Colorado uranium miners cohort: age, dose and dose-rate effects. Radiat. Res. 1999;152:339–351. [PubMed] [Google Scholar]