Abstract
Bacterial biofilms are more resilient to standard killing methods than free-living bacteria. Pseudomonas aeruginosa PAO1 biofilms grown on borosilicate coupons were treated with gas-discharge plasma for various exposure times. Almost 100% of the cells were inactivated after a 5-min plasma exposure. Atomic force microscopy was used to image the biofilms and study their micromechanical properties. Results show that the adhesiveness to borosilicate and the thickness of the Pseudomonas biofilms are reduced upon plasma treatment.
Keywords: Atmospheric pressure plasma, biofilms, biofilm removal, sterilization
I. Introduction
Biofilms are microbial communities responsible for undesirable effects such as disease and biofouling.
Cooperative interactions among members of the biofilm make conventional methods of controlling microbial growth often ineffective. Therefore, there is a need to develop new sterilization techniques. The use of gas-discharge plasmas is a good alternative since plasmas contain a mixture of reactive species, free radicals, and UV photons well-known for their decontamination potential against free microorganisms. We have reported the use of plasma to inactivate Chromobacterium violaceum biofilms [1]-[5]. We are presently studying biofilm inactivation of the opportunistic pathogen Pseudomonas aeruginosa PAO1.
P. aeruginosa is a gram-negative organism that preys on victims with compromised immune systems, patients on respirators, and causes infections of burned tissue and colonization of catheters and medical devices. It is also, together with Burkholderia cenocepacia, the main cause of mortality in patients [6] with cystic fibrosis. P. aeruginosa is an extremely versatile bacterium and lives almost anywhere (in water, soil, plants, and animals) and can use almost anything for food.
Pseudomonas biofilms have been intensively studied. Many of the genes involved in biofilm formation and its regulation [7] and the physiological events leading to biofilm formation [8] are known. Different strategies were also used to control/inactivate Pseudomonas biofilms: use of biocides, antibiotics, or the combination of both [9]-[13]; use of chelators [14]; use of compounds such as furanone and signal molecules such as N-acyl homoserine lactones [15], [16]; and modification of surfaces [17], [18] just to mention a few.
In this paper, we present data on plasma-initiated inactivation of P. aeruginosa biofilm grown on borosilicate and micromechanical properties of the biofilms through force versus distance curves.
II. Materials and Methods
A. Biofilm Growth
P. aeruginosa one-, three-, and seven-day-old biofilms were produced in batch culture using the CDC biofilm reactor (Bio-Surface Tech., MT). The biofilms were grown on borosilicate (glass) coupons in tryptic soy broth (TSB) at 37 °C with agitation. After the selected growth time, the coupons were aseptically removed from the reactor, and unbound bacteria were removed by rinsing the coupons twice with saline. Coupons were air-dried prior to being subjected to gas-discharge plasma for various exposure times (5, 10, 15, 30, and 60 min) under sterile conditions. A control without plasma treatment (0-min exposure time) was included. After treatment, the coupons were placed in a wet chamber and incubated with 50 μL of sterile saline for 10 min. Biofilms were then scrapped off the coupons and suspended in 1 mL of sterile saline, serially diluted, and suspensions were plated in duplicates on an agarized solid TSB medium. Plates were incubated at 37 °C and evaluated for colony-forming-units (CFU) formation by counting the colonies. Data (CFUs/mL) were transformed to percentages assigning the control a 100% of survival. Short-exposure-time experiments (0, 1, 2, 3, and 5 min) were carried out as described above for three-day old biofilms.
B. Plasma Generation and Conditions
The gas-discharge plasma was produced using a commercially available inductively coupled Atomflo 300 reactor (Surfx Technologies, CA) that delivers an atmospheric plasma jet [19]. The reactor consists of two perforated rectangular plates separated by a gap of 1.6 mm across. The upper aluminum electrode is connected to a 100-W RF power supply (13.56 MHz), and the lower electrode is grounded. The size of the plasma showerhead is 0.63 cm wide by 2.54 cm across. For the experiments, an atmospheric-pressure plasma jet was generated using a He flow of 20.4 L/min, a secondary gas flow (N2) of 0.15 L/min, and an input power of 35 W. Both gases were industrial grade. The plasma applicator was mounted such that the showerhead was 4 mm away from the biofilm.
C. AFM
Three-day-old biofilms were grown on glass coupons, treated with plasma for 0, 5, 30, and 60 min, and processed as indicated above. The coupons were rinsed twice and air-dried, and atomic force microscopy (AFM) images were obtained in air in contact mode using the Quesant Instrument's universal scanning probe microscope. Commercial silicon cantilevers from MikroMasch were employed with spring constants from 0.1 to 0.5 N/m. For each coupon, at least four widely separated regions were imaged to obtain a representative sample and ensure reproducibility. Images consisted of 500 lines of 500 points per line for a total of 250 000 pixels of data.
To ascertain the micromechanical properties of the biofilm, force–displacement curves were obtained. The procedure consisted of bringing the AFM tip in contact with the sample and then moving the sample upward in a set distance while monitoring the deflection of the cantilever. At each sampling location where force–displacement curves were obtained, the tip was brought in and out of contact at a rate of 0.5 Hz to the maximum set sample deflection (1.8 μm), and the displacement curve was recorded upon the fifth trial. This technique helped to reduce hysteresis that was often observed in the first few trials. The process was then repeated so that at least five force–displacement curves were recorded at each sampling location. For comparing samples with different plasma treatments, all of the force–displacement data were recorded on the same day using the same cantilever. This method ensured control for humidity and cantilever-dependent factors (such as spring constant) that can influence the shape of these curves [20].
III. Results and Discussion
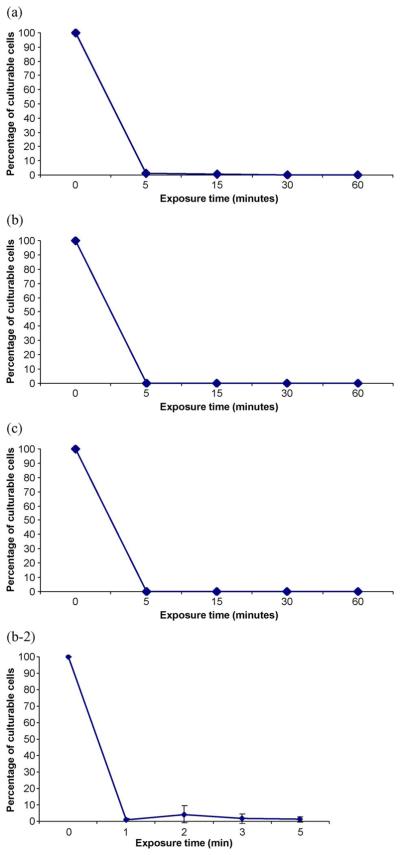
The percentage of remaining culturable cells versus plasma exposure time for borosilicate-grown P. aeruginosa biofilms is shown in Fig. 1. At time zero, the percentage of culturable cells is 100% and corresponds to the control without plasma treatment. The graph shows that regardless of the biofilm age, there is a clear decrease in the percentage of cells versus time. Seven-day-old biofilms do not seem to be more resilient than younger biofilms, and there are no significant differences in the percentage of remaining culturable cells for the different sampling dates. Similar results were reported for C. violaceum biofilms grown for four or seven days on polystyrene microtiter plates [1]-[5]. In the case of P. aeruginosa biofilms, the decrease in the percentage of cells is even more dramatic since there are almost no culturable cells after a 5-min treatment with plasma. The inset to Fig 1(b) shows that most of the inactivation occurs before biofilm exposure to plasma of less than 1 min.
Fig. 1.
Percentage of culturable cells versus plasma exposure time. P. aeruginosa biofilms were grown on borosilicate for (a) one day, (b) three days, and (c) seven days and were subjected to plasma for various exposure times and processed, as indicated in materials and methods. Results are the average of at least four independent experiments. Platings for colony counting were performed in duplicates. The bars represent the standard error of the mean. (b-2) Inset to part b.
To rule out the effect of temperature on biofilm inactivation, we measured the temperature of the gas reaching the coupon surface by placing a thermometer on its surface. Equilibrium temperatures of 31 °C were reached within a few minutes and remained constant over time. Therefore, temperature is not responsible for biofilm inactivation.
In a previous work, we studied the chemistry of the generated plasma by spectroscopy, and we reported the presence of NO γ-bands around 250 nm and an OH band around 309 nm [3]. These reactive species have direct impact on microorganisms, particularly on their outermost membranes [21]-[23]. The presence of these radicals can, therefore, compromise the function and viability of the membrane and the cell wall. The plasma conditions chosen for our experiments were those that maximized OH and NO emissions and produced stable plasma [3].
Cell concentration (in log CFU/mL) for biofilms not subjected to plasma treatment is 5.96±0.24, 7.12±1.52, and 5.82±0.42 for one-, three-, and seven-day-old biofilms, respectively. As cell concentration is slightly higher for three-day-old biofilms, experiments for AFM imaging were carried out with those biofilms.
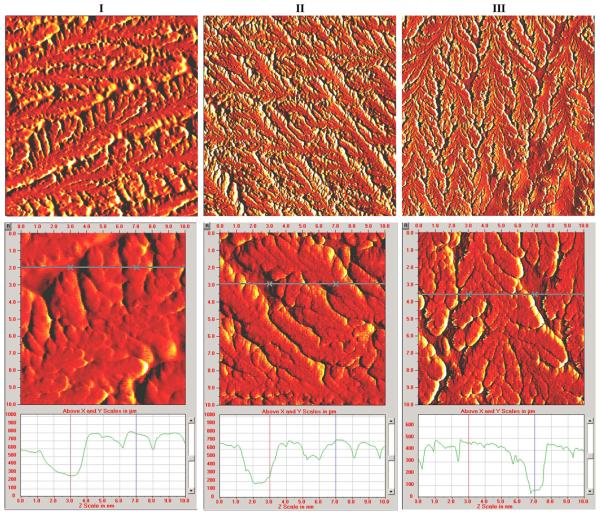
Fig. 2 displays typical AFM images for P. aeruginosa biofilms grown on glass coupons and treated with plasma for different exposure times, as indicated in materials and methods. The upper and bottom rows display 40 μm × 40 μm and 10 μm × 10 μm area scans, respectively, and cross sections of the 10 μm × 10 μm area scans are included. For each image, removal of any overall background tilt was performed. This procedure involved subtracting a plane determined from the average slope between the top and bottom edges and right and left edges of the scan. There are no obvious qualitative differences that we interpret from these images. From the cross sections of the 10 μm × 10 μm images, the overall thickness of the biofilm can be determined as the distance between the lowest features (the flat surface of the glass coupon) and the highest features (the “peak” of the biofilm). Examining these differences yields biofilm thicknesses of ~750, 700, and 450 nm for the 0-, 5-, and 60-min plasma treatment samples, respectively. A more precise method for quantifying the surface topography of the biofilms was also employed by examining the 40 μm × 40 μm images, the largest scan area obtainable from the AFM. For each scan, the average height of the surface features was determined as relative to the lowest point in the scan (assigned the value of zero height). Using this method from the 8, 4, and 4 regions, sampled for the control, 5- and 60-min plasma treated samples yielded mean values of the average heights of 1123, 1190, and 940 nm, respectively. Therefore, the trend of reduction of the average height after a long period of plasma treatment (60 min) was consistent with the reduction of biofilm thickness seen in the images of Fig. 2 and the reduction in culturable cells in Fig. 1. However, there was a wide variability in the average heights measured for each of the samples, and the reported mean values differed by less than one standard deviation.
Fig. 2.
AFM images of P. aeruginosa bacterial biofilm treated with gas-discharge plasmas for 0 (column I), 5 (column II), and 60 min (column III). The top and bottom rows consist of 40 μm × 40 μm and 10 μm × 10 μm scan areas, respectively. Cross sections of each 10 μm × 10 μm scan are included, with the location of the cross section indicated by a horizontal line on the image.
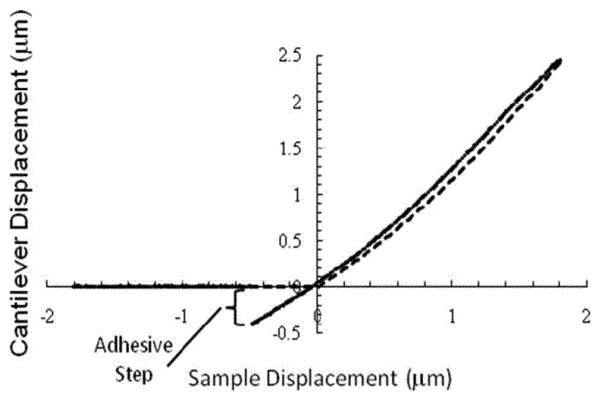
Fig. 3 shows a typical force–displacement curve obtained on the P. aeruginosa biofilm grown on the glass coupon for the control sample. The curve displays the same general features that were exhibited in all of our measured force–displacement curves. Upon (dashed line) approach, the tip encounters the sample's surface at the origin of the graph and deflects upward with a slope that increases. Upon (solid line) retraction, the tip roughly retraces the approaching curve with some hysteresis that mainly occurs around the middle of the first quadrant of the graph. Upon (in the third quadrant of the graph) further retraction, the tip adheres to the surface until it breaks free, and the points retrace the approaching data along the negative x-axis of the graph. For the purposes of analysis, two sections of the curve were considered. For approaching, the slope of the curve for positive sample displacements up to 0.2 μm was determined. For significantly higher sample displacements, the data are less reliable since the optical detection of the cantilever deflection becomes increasingly nonlinear. Others have performed similar analyses on bacteria, employing force–displacement curves over comparable scales [24]-[26]. For retracting, the height of the adhesive step, as indicated in Fig. 3, was measured.
Fig. 3.
P. aeruginosa biofilm force–displacement curve for the control sample on the glass coupon. Data for (dashed line) tip-sample approach and (solid line) tip-sample retraction are shown. The negative displacement of the cantilever that occurred due to tip adhesion to the biofilm upon retraction is designated as the adhesive step.
The slope of the force–displacement curves can be used to determine an elastic constant or stiffness of the biofilm. The derivation involves the analysis of the relative compression due to the contact between two effective springs, the cantilever and the biofilm. The biofilm stiffness, S, is related to the unitless slope, m (cantilever displacement/sample displacement), and the cantilever spring constant, k, through the following: [25],
| (1) |
Therefore, when using the same cantilever for comparisons between different plasma treatments, relative changes in bacterial stiffness are a function of the slope of the force–displacement curves only.
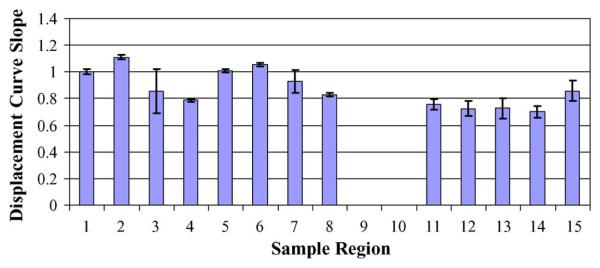
Fig. 4 shows comparisons between the initial slope of the force–displacement curve for the 0-min treatment (control) and 30-min plasma-treated samples on glass coupons. Curves at a number of regions for each sample were obtained. Although there appears to be an overall reduction in the slope of the displacement curves after 30 min of plasma treatment versus the control sample, the results differ by just slightly more than one standard deviation. Specifically, the mean slope value of the eight regions measured for the control sample is 0.947 with a standard deviation of 0.115. For the 30-min treated sample, the mean slope value for the five regions measured is 0.754 with a standard deviation of 0.062. Therefore, this reduction in the slope is consistent with a reduction in the stiffness constant, S, of the biofilm and indicates softening of the biofilm with plasma treatment.
Fig. 4.
P. aeruginosa biofilm force–displacement curve slopes for (control, first eight bars) 0- and (bars 11–15) 30-min plasma-treated samples. Eight and five different regions were examined on the 0- and 30-min treated samples, respectively. The height of each bar on the graph corresponds to the mean slope of five curves obtained for each region. Error bars represent plus and minus one standard deviation about this mean.
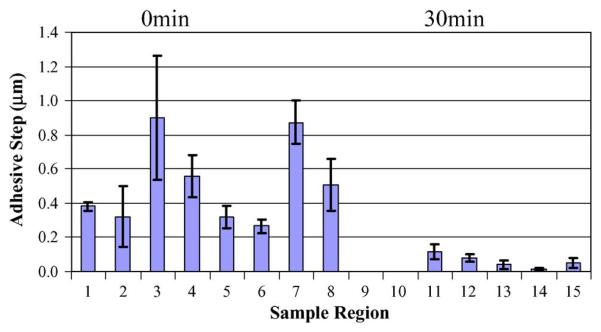
From the same force–displacement curves obtained for the sample regions shown in Fig. 4, adhesive step data were extracted and displayed in Fig. 5.
Fig. 5.
P. aeruginosa biofilm force–displacement curve adhesive step data for (control) 0- and 30-min plasma-treated samples. Eight and five different regions were examined on the 0- and 30-min treated samples, respectively. The height of each bar on the graph corresponds to the mean adhesive step height of five curves obtained for each region. Error bars represent plus and minus one standard deviation about this mean.
It is apparent from this graph that there is a wide variability in adhesive step values over the various regions of each sample. Even considering this variability, there is an obvious overall reduction in this adhesion with plasma treatment. The mean adhesive step height of the eight regions measured for the control sample is 0.516 μm with a standard deviation of 0.249 μm. For the 30-min treated sample, the mean adhesive step height for the five regions measured is 0.061 μm with a standard deviation of 0.039 μm. Therefore, there is an order of magnitude reduction in adhesion with 30 min of plasma treatment, and the two means differ by well beyond one standard deviation. This reduction of adhesion with plasma treatment indicates that the biofilm would exhibit less adhesion to surfaces, prohibiting its retention.
We previously reported that C. violaceum biofilm-forming cells undergo sequential morphological changes after plasma treatment. Bacterial cells may undergo modifications ranging from minimal changes to putative loss of cell walls. In another contribution, we verified the relative “roughness” of cells by examining an image's cross sections and analyzing the standard deviation of the surface height. These surface features are consistent with cells undergoing damage [4], [27]. The present study goes beyond those reports suggesting that the architecture and the stability of the biofilm as a whole may be impacted by plasma treatment.
IV. Conclusion
Our results clearly show that bacterial biofilms can be inactivated by using gas-discharge plasma. The architecture and stability, together with cell culturability, are impacted by the plasma treatment. These results are evidences of the potential for plasma as an alternative sterilization method against biofilms. However, based on our previous results, [4] we are aware that viability experiments should always be carried out before drawing the conclusion that plasma is useful to kill cells based solely on measurement of culturable cells. It is widely accepted that the lack of culturability does not imply that there are no viable cells in the sample. When cells are viable but nonculturable (VBNC), they are unable to produce colonies in an agarized medium but they are still alive and may retain pathogenicity. The VBNC state is a survival mechanism of bacteria facing environmental stress conditions that has been reported for many gram-negative organisms [28]-[30]. Bacteria enter into this dormant state in response to one or more environmental stresses, which might otherwise be ultimately lethal to the cell. Research is being carried out in our laboratories to try to better understand the mechanism leading to cell inactivation.
Acknowledgment
The authors would like to thank S. S. Lwin for the technical support and Dr. Nina Abramzon for allowing the authors to use her plasma reactor.
This work was supported by the U.S. National Institutes of Health under Grant SCORE SC3 1SC3GM088070-01 and in part by the National Science Foundation Nanotechnology Undergraduate Education Program under Award 0406533 for the atomic force microscopy. The work of A. J. Zelaya was supported by a fellowship from the U.S. National Institutes of Health RISE Program 2R25GM061190-05A2.
Biographies
 Anna J. Zelaya received the B.S. degree in environmental biology from the California State Polytechnic University, Pomona, in 2010, where she is currently working toward the M.S. degree in the Department of Biological Sciences. She is currently a scholar in the MBRS-Research Initiative for Scientific Enhancement Intensive-Graduate Program funded by the National Institutes of Health and does research under the supervision of Dr. G. Brelles-Mariño.
She is currently with the Biological Sciences Department, California State Polytechnic University.
 Gregory Stough is currently working toward the B.S. degree in the Physics Department, California State Polytechnic University, Pomona. He is a CCRAA apprentice doing research under Dr. E. Salik and works with Dr. K. Vandervoort during the academic year.
 Navid Rad received the B.S. degree in physics from California State Polytechnic University, Pomona, in 2010 and did research under the guidance of Dr. K. Vandervoort. He is currently working toward the M.S. degree in particle physics at California State University, Fresno.
 Kurt Vandervoort received the B.S. degree in physics from Humboldt State University, Arcata, CA, in 1986 and the M.S. and Ph.D. degrees in physics from the University of Illinois at Chicago, in 1988 and 1991, respectively.
He was a Postdoctoral Fellow with Argonne National Laboratory, Argonne, IL, from 1991 to 1993 and was an Assistant and then Associate Professor in physics with Western Carolina University, Cullowhee, NC, from 1993 to 2002. Since 2002, he has been an Associate and currently a Full Professor in physics with California State Polytechnic University, Pomona. His present research interest includes atomic force microscopy as applied to biological systems.
 Graciela Brelles-Mariño received the B.S. degree in chemistry and the M.S. and Ph.D. degrees in biochemical sciences from the Universidad Nacional de La Plata, La Plata, Argentina, in 1984, 1985, and 1993, respectively.
She was with the University of Puerto Rico, Arecibo, Puerto Rico, from 1996 to 2001. She was a Postdoctoral Fellow with the Consejo Superior de Investigaciones Cientificas, Granada, Spain, in 1999–2000 and a Research Associate with the Laboratoire des Interactions Plantes-Microorganismes, Toulouse, France, in 2001–2002. Since 2003, she has been an Assistant Professor in microbiology and then an Associate Professor with the California State Polytechnic University, Pomona. She is also currently an Associate Professor with the Center for Research and Development of Industrial Fermentations (CINDEFI), Facultad de Ciencias Exactas, Universidad Nacional de La Plata. Her research interest focuses on biofilm inactivation by atmospheric-pressure plasmas.
References
- 1.Brelles-Mariño G, Joaquin JC, Bray JD, Abramzon N. Gas discharge plasma as a novel tool for biofilm destruction; Proc. 2nd Int. Workshop Cold Atmos. Pressure Plasmas; 2005. pp. 69–72. [Google Scholar]
- 2.Becker K, Koutsospyros A, Yin SM, Christodoulatos C, Abramzon N, Joaquin JC, Brelles-Mariño G. Environmental and biological applications of microplasmas. Plasma Phys. Control. Fusion. 2005 Dec.47(no. 12B):B513–B523. [Google Scholar]
- 3.Abramzon N, Joaquin JC, Bray JD, Brelles-Mariño G. Biofilm destruction by RF high-pressure cold plasma jet. IEEE Trans. Plasma Sci. 2006 Aug.34(no. 4):1304–1309. [Google Scholar]
- 4.Joaquin JC, Bray JD, Kwan C, Abramzon N, Vandervoort K, Brelles-Mariño G. Understanding plasma assisted biofilm inactivation. Microbiology. 2009;175:724–732. doi: 10.1099/mic.0.021501-0. [DOI] [PubMed] [Google Scholar]
- 5.Brelles-Mariño G. Bacterial biofilm inactivation by gas-discharge plasmas. In: Brelles-Mariño G, editor. Biological and Environmental Applications of Gas Discharge Plasmas. Nova; Commack, NY: 2010. [Google Scholar]
- 6.Tümmler B, Kiewitz C. Cystic fibrosis: An inherited susceptibility to bacterial respiratory infections. Mol. Med. Today. 1999 Aug.5(no. 8):351–358. doi: 10.1016/s1357-4310(99)01506-3. [DOI] [PubMed] [Google Scholar]
- 7.Whiteley M, Bangera MG, Bumgarner RE, Parsek MR, Teitzel GM, Lory S, Greenberg EP. Gene expression in Pseudomonas aeruginosa biofilms. Nature. 2001 Oct.413(no. 6858):860–864. doi: 10.1038/35101627. [DOI] [PubMed] [Google Scholar]
- 8.Davies DG. Regulatory events in biofilm development. In: McLean RS, Decho AW, editors. Molecular Ecology of Biofilms. Horizon Scientific Press; Norwich, U.K.: 2002. [Google Scholar]
- 9.Gillis RJ, Iglewski BH. Azithromycin retards Pseudomonas aeruginosa biofilm formation. J. Clin. Microbiol. 2004 Dec.42(no. 12):5842–5845. doi: 10.1128/JCM.42.12.5842-5845.2004. [DOI] [PMC free article] [PubMed] [Google Scholar]
- 10.Huang CT, Stewart PS. Reduction of polysaccharide production in Pseudomonas aeruginosa biofilms by bismuth dimercaprol (BisBAL) treatment. J. Antimicrobiol. Chem. 1999 Nov.44(no. 5):601–605. doi: 10.1093/jac/44.5.601. [DOI] [PubMed] [Google Scholar]
- 11.Mikuniya T, Kato Y, Kariyama R, Monden K, Hikida M, Kumon H. Synergistic effect of fosfomycin and fluoroquinolones against Pseudomonas aeruginosa growing in a biofilm. Acta Med. Okayama. 2005 Oct.59(no. 5):209–216. doi: 10.18926/AMO/31977. [DOI] [PubMed] [Google Scholar]
- 12.Owusu-Ababio G, Rogers JA, Morck DW, Olson ME. Efficacy of sustained release ciprofloxacin microspheres against device-associated Pseudomonas aeruginosa biofilm infection in a rabbit peritoneal model. J. Med. Microbiol. 1995 Nov.43(no. 5):368–376. doi: 10.1099/00222615-43-5-368. [DOI] [PubMed] [Google Scholar]
- 13.Tanaka G, Shigeta M, Komatsuzawa H, Sugai M, Suginaka H, Usui T. Effect of Clarithromycin on Pseudomonas aeruginosa biofilms. Chemotherapy. 2000 Jan./Feb.46(no. 1):36–42. doi: 10.1159/000007254. [DOI] [PubMed] [Google Scholar]
- 14.Banin E, Vasil ML, Greenberg EP. Iron and Pseudomonas aeruginosa biofilm formation. Proc. Nat. Acad. Sci. 2005;102:11 076–11 081. doi: 10.1073/pnas.0504266102. [DOI] [PMC free article] [PubMed] [Google Scholar]
- 15.Hentzer M, Riedel K, Rasmussen TB, Heydorn A, Andersen JB, Parsek MR, Rice SA, Eberl L, Molin S, Høiby N, Kjelleberg S, Givskov M. Inhibition of quorum sensing in Pseudomonas aeruginosa biofilm bacteria by a halogenated furanone compound. Microbiology. 2002 Jan.148:87–102. doi: 10.1099/00221287-148-1-87. [DOI] [PubMed] [Google Scholar]
- 16.Davies D, Parsek M, Pearson J, Iglewski B, Costerton JW, Greenberg EP. The use of signal molecules to manipulate the behavior of biofilm bacteria. Clin. Microbial. Infect. 1999;5:5S7–5S8. [Google Scholar]
- 17.Balazs DJ, Triandafillu K, Wood P, Chevolot Y, van Delden C, Harms HC, Hollenstein C, Mathieu HJ. Inhibition of bacterial adhesion on PVC endotracheal tubes by RF-oxygen glow discharge, sodium hydroxide and silver nitrate treatments. Biomaterials. 2004 May;25(no. 11):2139–2151. doi: 10.1016/j.biomaterials.2003.08.053. [DOI] [PubMed] [Google Scholar]
- 18.Bryers JD, Ratner BD. Bioinspired implant materials befuddle bacteria. ASM News. 2004;70(no. 5):232–237. [Google Scholar]
- 19.Schutze JY, Jeong SE, Park J, Selwyn GS, Hicks RF. The atmospheric plasma jet: A review and comparison to other plasma sources. IEEE Trans. Plasma Sci. 1998 Dec.26(no. 6):1685–1694. [Google Scholar]
- 20.Jones R, Pollock HM, Cleaver JAS, Hodges CS. Adhesion forces between glass and silicon surfaces in air studied by AFM: Effects of relative humidity, particle size, roughness, and surface treatment. Langmuir. 2002 Oct.18(no. 21):8045–8055. [Google Scholar]
- 21.Laroussi M, Alexeff I, Kang W. Biological decontamination by non-thermal plasmas. IEEE Trans. Plasma Sci. 2000 Feb.28(no. 1):184–188. [Google Scholar]
- 22.Laroussi M, Leipold F. Evaluation of the roles of reactive species, heat, and UV radiation in the inactivation of bacterial cells by air plasmas at atmospheric pressure. Int. J. Mass Spectrom. 2004 Apr.233(no. 1–3):81–86. [Google Scholar]
- 23.Laroussi M. Low temperature plasma-based sterilization/decontamination of biological matter; Proc. 2nd Int. Workshop Cold Atmos. Pressure Plasmas; 2005. pp. 18–27. [Google Scholar]
- 24.Oh YJ, Jo W, Yang Y, Park S. Influence of culture conditions on Escherichia coli O157:H7 biofilm formation by atomic force microscopy. Ultramicroscopy. 2007 Oct.107(no. 10/11):869–874. doi: 10.1016/j.ultramic.2007.01.021. [DOI] [PubMed] [Google Scholar]
- 25.Zhao L, Schaefer D, Marten MR. Assessment of elasticity and topography of Aspergillus nidulans spores via atomic force microscopy. Appl. Environ. Microbiol. 2005 Feb.71(no. 2):955–960. doi: 10.1128/AEM.71.2.955-960.2005. [DOI] [PMC free article] [PubMed] [Google Scholar]
- 26.Oh YJ, Lee NR, Jo W, Jung WK, Lim JS. Effects of substrates on biofilm observed by atomic force microscopy. Ultramicroscopy. 2009 Jul.109(no. 8):874–880. doi: 10.1016/j.ultramic.2009.03.042. [DOI] [PubMed] [Google Scholar]
- 27.Vandervoort KG, Abramzon N, Brelles-Mariño G. Plasma interactions with bacterial biofilms as visualized through atomic force microscopy. IEEE Trans. Plasma Sci. 2008 Aug.36(no. 4):1296–1297. [Google Scholar]
- 28.Oliver JD. Formation of viable but nonculturable cells. In: Kjelleberg S, editor. Starvation in Bacteria. Plenum; New York: 1993. pp. 239–272. [Google Scholar]
- 29.Colwell RR, Huq A. Vibrios in the environment: Viable but nonculturable Vibrio cholera. In: Kaye T, editor. Vibrio Cholerae and Cholera: Molecular Global Perspectives. ASM; Washington, DC: 1994. [Google Scholar]
- 30.Rozak DB, Colwell RR. Survival strategies of bacteria in the natural environment. Microbiol. Rev. 1987 Sep.51(no. 3):365–379. doi: 10.1128/mr.51.3.365-379.1987. [DOI] [PMC free article] [PubMed] [Google Scholar]


