

Abstract
Amyloid plaques are one of the pathological hallmarks of Alzheimer's disease (AD). The visualization of amyloid plaques in the brain is important to monitor AD progression and to evaluate the efficacy of therapeutic interventions. Our group has developed several contrast agents to detect amyloid plaques in vivo using magnetic resonance microimaging (μMRI) in AD transgenic mice, where we used intra-carotid mannitol to enhance blood brain barrier (BBB) permeability. In the present study, we used ultrasmall superparamagnetic iron oxide (USPIO) nanoparticles, chemically coupled with Aβ 1-42 peptide to detect amyloid deposition along with mannitol for in vivo μMRI by femoral intravenous injection. A 3D gradient multi-echo sequence was used for imaging with a 100 μm isotropic resolution. The amyloid plaques detected by T2*-weighted μMRI were confirmed with matched histological sections. Furthermore, two different quantitative analyses were used. The region of interest-based quantitative measurement of T2* values showed contrast injected APP/PS1 mice had significantly reduced T2* values compared to wild-type mice. In addition, the scans were examined with voxel-based morphometry (VBM) using statistical parametric mapping (SPM) for comparison of contrast injected AD transgenic and wild-type mice. The regional differences seen in VBM comparing USPIO-Aβ1-42 injected APP/PS1 and wild type mice correlated with the amyloid plaque distribution histologically, contrasting with no differences between the two groups of mice without contrast agent injection in regions of the brain with amyloid deposition. Our results demonstrated that both approaches were able to identify the differences between AD transgenic mice and wild type mice, after injected with USPIO-Aβ1-42. The feasibility of using less invasive intravenous femoral injections for amyloid plaque detection in AD transgenic mice facilitates using this method for longitudinal studies in the pathogenesis of AD.
Keywords: Amyloid plaques, amyloid β, Alzheimer's disease, magnetic resonance microimaging, ultrasmall superparamagnetic iron oxide nanoparticles (USPIO), voxel-based morphometry
Introduction
Alzheimer's disease (AD) is the most common cause of dementia in the elderly. The extracellular accumulations of amyloid β (Aβ) peptides as amyloid plaques, intracellular neurofibrillary tangles as well as neuronal loss are pathological hallmarks of Alzheimer's disease (AD) (Perl, 2010). The definitive diagnosis of AD is still based on histological confirmation of these pathological features at postmortem examination. According to the amyloid cascade hypothesis, abnormal accumulation of Aβ in the brain is a critical event in the pathogenesis of AD (Hardy and Selkoe, 2002; Tanzi and Bertram, 2005). AD remains without an effective therapy; however, numerous therapeutic interventions which target amyloid deposition are under investigation both in animal models and in clinical trials (Rafii and Aisen, 2009). These investigational disease altering interventions appear in animal models and in more limited human data to have the greatest likelihood of success if initiated very early in the progression of illness (Lemere and Masliah, 2010; Wisniewski and Boutajangout, 2010). Hence, better ways to detect and diagnosis AD related pathology in pre-clinical stages of the disease are urgently needed. Such techniques would be beneficial, for the early initiation of therapeutic interventions and the evaluation of putative amyloid targeting therapies, in both transgenic mice and AD patients.
Positron emission tomography (PET) based imaging of amyloid deposits is already successfully being used as a research protocol in patients with a number of radioligands (Huddleston and Small, 2005; Nordberg et al., 2010; Rabinovici and Jagust, 2009). However, there are numerous potential advantages to magnetic resonance imaging (MRI) based amyloid imaging methods, including the lack of a requirement for a radioligand, better spatial resolution, lower cost, more widespread availability and greater ease of use for AD models such as transgenic mice (Huddleston and Small, 2005). Visualization of individual Aβ plaques on T2* weighted MRI has been reported in postmortem human tissue from AD patients (Benveniste et al., 1999). However, the 20 hr imaging time used in this study is not feasible for in vivo studies. Because the chemical constituents of senile plaques affect MRI signal, a small proportion of mature plaques with high levels of iron have been detected ex vivo and in vivo without contrast agents in old transgenic mice by μMRI (Borthakur et al., 2006; Braakman et al., 2006; Helpern et al., 2004; Jack et al., 2004; Lee et al., 2004; Meadowcroft et al., 2009; Sigurdsson et al., 2008; Vanhoutte et al., 2005; Wadghiri et al., 2005). However, this method is not specific for amyloid plaques and detects other iron-containing structures, such as remnants of old hemorrhages and calcification. Therefore, a plaque specific contrast targeting agent is required to selectively visualize amyloid plaques, as well as to increase sensitivity, in particular for earlier deposits, which are less likely to be associated with iron co-deposition. Prior studies from our group have shown that Aβ1-40 magnetically labeled with either gadolinium-diethylenetriaminepentaacetic acid (Gd-DTPA) or monocrystalline iron oxide nanoparticles (MION), can be used to detect Aβ plaques ex vivo and in vivo in both APP and APP/PS1 transgenic AD mice after intracarotid administration with mannitol to transiently open the BBB (Scholtzova et al., 2008; Sigurdsson et al., 2008; Zaim Wadghiri et al., 2003). The Gd-DTPA-Aβ1-40 contrast agent has been applied to follow the therapeutic response to amyloid burden reduction (Scholtzova et al., 2008). Our recent study used Gd-DTPA-K6Aβ1-30, which is homologous to Aβ but non-toxic, to detect amyloid burden in vivo (Sigurdsson et al., 2008). The μMRI scans in this study were analyzed with voxel-based analysis (VBA) using statistical parametric mapping (SPM), for un-biased quantitative comparison of pre and post ligand injection scans in groups of contrast-injected AD model mice and controls (Sigurdsson et al., 2008). In this past study significant differences were found between the pre and post contrast injection scans in AD model mice and not in the control mice. These studies indicate that contrast-enhanced MRI combined with VBA may be useful approaches for detecting amyloid plaques in transgenic mouse models. Voxel-based morphometry (VBM) involves a voxel-based comparison of the local intensity/concentration of gray matter between two groups. The procedure of VBM involves spatially normalization, followed by segmentation of the gray matter from the normalized images and smoothing the gray matter segments (Ashburner and Friston, 2000). In the present study we evaluated the use of VBM to compare post-ligand injection μMRI in wild-type mice versus AD transgenic (Tg) model mice, as well as in AD Tg mice and wild-type mice without contrast injection. We also evaluated the utility of using absolute T2* values in the cortex, hippocampus and cerebellum for differentiating these experimental mouse groups. Transverse (T2) relaxation time and apparent transverse (T2*) relaxation time, are intrinsic MR parameters sensitive to changes in the biophysical environment of water. Therefore, the presence of amyloid plaques in the brain would impact these transverse measurements. Several studies have reported that reduced mean T2 values was associated with high amyloid-iron load in different brain regions of APP/PS transgenic mice, such as cortex, hippocampus, and subiculum (El Tannir El et al., 2006; Falangola et al., 2007). In addition, other and our previous studies have shown that T2* values correlate with amyloid plaque burden (Chamberlain et al., 2009; Scholtzova et al., 2008). Therefore, the absolute T2* values were measured in cortex, hippocampus and cerebellum in this study.
Despite the significant progress, each of our past studies used intra-carotid injection of ligands with mannitol in order to gain sufficient BBB penetration. This is highly invasive and not feasible for human studies or longitudinal studies in AD model animals. Therefore, a safer and less invasive method of ligand administration is required in order to reduce morbidity and gain sufficient BBB penetration at the same time. In the present study, we use ultrasmall superparamagnetic iron oxide (USPIO) nanoparticles coupled to Aβ1-42 to detect amyloid deposition for in vivo μMRI by femoral intravenous injection. Such an improvement would allow for longitudinal studies on AD transgenic mice. USPIO is superparamagnetic with potent T2 and T2* relaxation acceleration effects. Therefore, the USPIO labeled plaques appear as focal dark spots devoid of MRI signal against the background of normal tissue on T2*-weighted MRI images. A potential advantage of developing USPIO for AD amyloid imaging is that USPIO is a well tolerated contrast agent which has already been widely used in humans for CNS imaging in conditions such as multiple sclerosis, brain tumors and stroke (Bernd et al., 2009; Stoll and Bendszus, 2009). Hence if we are able to further refine this technology in AD models, this would have the potential to be used diagnostically in patients.
Materials and methods
Animals
13 to 17-month old APP/PS1 transgenic mice, and age-matched wild-type (C57Bl/6J) control mice were used in these studies (Table 1). This transgenic line is based on the overexpression of both amyloid precursor protein mutations (APPK670N/M671L) and mutant presenilin-1 (PS1M146L) (Holcomb et al., 1998). The genotype of each mouse was confirmed by PCR analysis using samples of mouse-tail DNA. All mice used in these studies were maintained according to the protocols approved by the Institutional Animal Care and Use Committee at the New York University School of Medicine.
Table 1. Summary of Scans from wild type and AD Transgenic (Tg) Mice Imaged with μMRI.
| Mice | Set 1 (in vivo scans with USPIO-Aβ1-42 injection) | Set 2 (ex vivo scans with USPIO-Aβ1-42 injection) | Set 3 (ex vivo scans without contrast agent) |
|---|---|---|---|
| APP/PS1 Tg | 6 | 13 (6 mice from Set1) | 12 |
| Wild-type | 6 | 12 | 12 |
Contrast agents
Aβ 1-42 peptide was synthesized in the W.M. Keck Facility at Yale University (New Haven, CT). Details of synthesis, purification, and sequence verification were described previously (Sigurdsson et al., 2001). The ultrasmall superparamagnetic iron oxide (USPIO) nanoparticles (10mgFe/ml, Ocean Nanotech) were linked to Aβ1-42 peptide using standard EDC/NHS coupling methods, according to the manufacturer's instructions. After coupling, the free Aβ peptide was separated from the nanoparticles by centrifugation at 25,000rpm for 25 min. This produced a clear supernatant and a brownish pellet. The supernatant was taken for protein assay. We verified that chemical coupling was 90% efficient with ∼1mg of Aβ peptides coupling to 1mg of USPIO particles using the BCA protein assay. The pellet was washed several times with PBS and an aliquot was run on 16.5% SDS-PAGE under nonreducing conditions, followed by immunoblotting using anti-Aβ antibodies (4G8) to verify the coupling of the peptide to the USPIO. Briefly, samples were separated by SDS-PAGE and transferred to nitrocellulose membranes. After blocking with 5% milk, the membrane was incubated with monoclonal anti-Aβ antibody 4G8 (1:2000) (Covance, Emeryville, CA), and subsequently with horseradish peroxidase-conjugated goat anti-mouse secondary antibody (1:5000, Thermo Scientific, Rockford, IL). The signal was detected by the enhanced chemiluminescence (ECL) Western blotting detection reagents (Amersham Biosciences, Piscataway, NJ).
Binding affinity and toxicity studies
Experiments were performed to assess the ability of USPIO-Aβ1-42 to bind to Aβ1-40 which is an abundant peptide in AD amyloid deposits. The interaction between USPIO-Aβ1-42 and Aβ1-40 was evaluated by enzyme-linked immunosorbent solid phase assays (ELISA), as described previously (Golabek et al., 1996). Briefly, freshly dissolved Aβ1-40 was coated overnight onto polystyrene microtiter plates and then the plates were blocked with superblock. Increasing concentrations of USPIO-Aβ1-42 in Tris-buffered saline were applied to Aβ1-40 coated wells for 3h. Bound USPIO-Aβ1-42 was detected with an Aβ1-42 specific antibody (R165) that does not cross react with Aβ1-40 (Scholtzova et al., 2008). All binding studies were performed in triplicate. After washing, the plates were incubated for 1 hr with an anti-rabbit horseradish peroxidase-linked antibody (Amersham Life Science), developed for 15 min with a TMB peroxidase kit (Bio-Rad, Hercules, CA), and quantified at 450 nm on a a Spectramax M2 microplate reader (Molecular Devices, Sunnyvale, CA). The data were analyzed by a nonlinear regression fit algorithm in Prism5.0 (GraphPad Software, San Diego, CA). Negative controls for nonspecific binding included wells without coating Aβ1-40 and omission of the anti-Aβ1-42 or secondary antibodies, as well as wells incubated with non-coupled USPIO.
The potential neurotoxicity of USPIO-Aβ1-42 was assessed in N2a mouse neuroblastoma cells (ATCC line CCL-131) using the 3-(4,5-dimethylthiazol-2-yl)-5-(3-carboxymethoxyphenyl)-2-(4-sulfophenyl)-2H-tetrazolium (MTS) Cell Proliferation Assay (Promega, Madison, WI) and compared to the known toxicity of Aβ1-42 (Pike et al., 1991; Sadowski et al., 2004), using methods as we have previously described (Sadowski et al., 2004; Sigurdsson et al., 2008). Cells were plated onto 6-well plates and were treated with USPIO-Aβ1-42, Aβ1-42 alone and uncoupled USPIO for 72 hrs. The Aβ1-42 alone and uncoupled USPIO were positive and negative controls, respectively. The concentration of Aβ1-42 alone and bound Aβ1-42 on the USPIO-Aβ1-42 particles was 10μM. This concentration of Aβ1-42 has been shown to be toxic in this culture model (Sadowski et al., 2004). The concentration of USPIO particles in the media of the cells treated with USPIO alone was matched to the cells treated with USPIO-Aβ1-42. The cells were then transferred to a 96-well plate and allowed to attach overnight. Subsequently, the MTS colorimetric solution was added and allowed to incubate at 37 °C for 2-3 hours. MTS was bio-reduced by cells into a formazan product that was soluble in tissue culture medium. The absorbance of the formazan at 490 nm was measured directly from 96-well plates in a Spectramax M2 and using SoftMaxPro software Version 4.8. Cell viability were determined as percent of control, with control being non-treated cells. The statistical significance of USPIO-Aβ1-42, Aβ1-42 alone and uncoupled USPIO toxicity was analyzed by one way ANOVA followed by a Neuman-Keuls post-hoc test (GraphPad Prism, version 5; GraphPad Inc., San Diego, CA, USA).
Contrast injections
Since USPIO nanoparticles do not cross the BBB, we co-injected them with mannitol via the femoral vein. USPIO-Aβ1–42 was dissolved in 200 μl of 15% mannitol in PBS at a dose of 0.2 mmol Fe/kg body weight immediately before infusion. The peptides were infused via the right femoral vein using a PHD2000 computer-controlled syringe pump (Harvard Apparatus, Hollison, MA), as we previously described (Sigurdsson et al., 2008). The USPIO-Aβ1-42/mannitol mixture was injected at a rate of 60μl/min. Anesthesia was induced with 2.5% isoflurane in air for 3–5 min, followed by 1–1.5% isoflurane in air to maintain anesthesia.
In vivo MRI brain imaging
All mice were scanned 6hs after intravenous injection of the contrast agent to ensure maximum plaque detection with minimal nonspecific labeling of blood vessels (Wadghiri et al., 2003). For in vivo imaging the mice were anesthetized with 2.5% isoflurane in 75% NO2 plus 22% O2. For maintenance of anesthesia the isoflurane was reduced to 1%. Body temperature of the mice was maintained at 37°C using a warm-water blanket. All MRI scans were performed on a 7T micro-MRI system consisting of a 7-Telsa 200-mm horizontal bore magnet (Magnex Scientific, UK) equipped with an actively shielded gradient coil (Bruker BGA-9S; ID 90 mm, 750 mT/m gradient strength, 100 μs rise time) interfaced to a Bruker Biospec console.
For in vivo μMRI a modified 3D spoiled gradient recalled multi-echo (SPGRME) sequence was used to acquire an additional self-gated signal on the readout dephasing gradient within each TR (Nieman et al., 2009). The gating signal was used retrospectively to generate artifact free four-echo image reconstruction sets with the following parameters: 100μm isotropic spatial resolution; repetition time (TR) = 80 ms; bandwidth (BW) = 75kHz, matrix =256 × 256 × 128; first echo time (TE) = 4.1 ms with echo spacing (ES) = 4.1 ms (effective subsequent echo times are as follow: 8.2, 12.3, 16.4 ms), flip angle (FA) = 20° and imaging time = 2 hr 20 min. The advantage of the 3D-imaging approach is that the image set can be reprocessed in any desired slice orientation using Analyze software (AnalyzeDirect, Overland Park, KS), facilitating image comparison during co-registration with histology. Among the four-echo train image sets acquired, the third echo was used to generate a T2*-weighted (TE=12.3 ms) image subset for both plaque visualization and VBA.
The apparent transverse relaxation time T2* was measured using the four-echo train image sets described above in several brain regions defined by region of interest (ROI). ROIs were manually drawn at the level of the hippocampus and cortex with NIH imageJ software (imagej.nih.gov/ij). The cortical ROIs were defined as dorsomedial from the cingulate cortex and extended ventrolaterally to the rhinal fissure within the left or right hemisphere. Fourteen ROIs in the cortex and eight ROIs in the hippocampus were measured per animal. A ROI in the cerebellum was used as an internal control. The mean signal intensity of all voxels contained within each ROI was subsequently used for fitting. The four-point decay curves obtained from the echo-train dataset were fit to a single exponential using a non linear least square algorithm with Origin 7.5 (OriginLab Corp., Northampton, MA) to obtain the T2* measurements.
Ex vivo MRI brain imaging
Animals were anesthetized with sodium pentobarbital (150 mg/kg, i.p.) and perfused transaortically with 0.1 M PBS, pH 7.4, followed by 4% paraformaldehyde, and their brains were extracted for ex vivo MRI and histology. For ex vivo imaging, a dedicated apparatus was designed to scan up to four brains simultaneously overnight using a Quadrature Birdcage Coil (ID= 28mm, length 29mm) designed in-house to fit a 35 cc syringe (ID = 24 mm). Individual brains were glued into place in each quadrant of the syringe plunger and immersed in Fomblin (Solvay Solexis Inc., Thorofare, NJ). Fomblin provided a completely dark background around the brains being imaged (Scholtzova et al., 2008). A 3D multi-gradient echo (MGE) sequence was used for absolute T2* quantitation with the following parameters: 100μm isotropic spatial resolution, TR = 50 ms, bandwidth (BW) = 50 kHz, matrix =256 × 256 × 256, TE = 4.07ms, ES = 6.7ms (effective subsequent echo times are as follow: 10.8, 17.5, 24.2 ms), FA =20°, imaging time = 8 hr 11 min.
Histological Studies
After ex vivo MRI, the brains were removed from Fomblin and placed in 2% DMSO/20% glycerol in PBS overnight or until sectioning. Serial coronal sections (40 μm) were cut and every third section were stained with a combination of 6E10 and 4G8, both monoclonal anti-Aβ antibodies (Covance, Emeryville, CA), as previously described (Scholtzova et al., 2008; Sigurdsson et al., 2004; Sigurdsson et al., 2008; Wadghiri et al., 2003). Briefly, free floating sections were incubated in 6E10/4G8 antibodies at a dilution of 1:1000 for 2 h. An immunodetection kit (MOM; Vector Laboratories, Burlingame, CA) was used with the anti-mouse IgG secondary antibody reacted for 1 hr at a 1:1000 dilution. Antibody staining was revealed with 3,3′-diaminobenzidine (DAB; Sigma-Aldrich, St. Louis, MO) with nickel ammonium sulfate intensification.
Voxel-based morphometry (VBM) analysis
VBM analysis was performed using MATLAB 9 (the MathWorks, Natick, MA) and SPM5 (Wellcome Department of Clinical Neurology, London) with SPMMouse toolbox (Sawiak et al., 2009). The steps involved in processing data were similar to that of human data processing as reviewed previously (Ashburner, 2009). Briefly, the acquired mouse brain images were spatially normalized to the control C57Bl/6J mouse brain template in the SPMMouse toolbox and segmented into grey matter probabilistic density maps. Then these maps were smoothed with a 500μm isotropic Gaussian kernel to correct for imperfect registration and make the distribution of data more Gaussian. Two group t tests were then performed on these tissue maps to identify group-wise changes in grey matter structure in the framework of the general linear model (GLM).
After injection of the USPIO-Aβ1-42, amyloid plaques were visualized on MRI as hypointense spots characterized by loss of signal intensity, as we have observed following MION-Aβ1–40 injections (Wadghiri et al., 2003). Regional specific differences were assessed statistically using the GLM/univariate analysis with a one-tailed T statistics, showing voxels of lower intensity in APP/PS1 Tg mice compared to wild-type mice. We considered p <0.01 (uncorrected for multiple comparisons) to indicate statistical significance for individual voxels, with a minimum cluster size of 500 voxels as previously reported for rodent VBM analysis(Dubois et al., 2008; Dubois et al., 2010). Cluster locations were identified with an anatomical atlas of the mouse brain (Franklin and Paxinos, 2001).
Results
Analysis of Aβ1-42 coupled USPIO
The coupling of Aβ1-42 to USPIO was evaluated by immunoblotting using monoclonal anti-Aβ 4G8 antibody (Figure 1). The majority of the USPIO-Aβ1-42 (Lane1) did not transfer onto the nitrocellulose membrane. Of the proportion of the USPIO-Aβ1-42 that was transferred, the majority of the beads stayed in the stacking gel; a small portion of the Aβ1-42 that was not covalently bound to the beads entered the running gel and can be seen as 4.5, 9.0 and higher kDa bands, corresponding to monomeric, dimeric and aggregated Aβ1-42. This portion of Aβ1-42 was presumably bound to the beads by hydrophobic interactions, which is how we previously had bound Aβ1-40 to MION particles (Wadghiri et al., 2003). USPIO beads without coupled Aβ1-42 were run in lane 2 and no bands were seen. Synthetic Aβ1-42 peptide alone was run in lane 3 with two bands being seen, corresponding to monomeric and dimeric Aβ1-42.
Figure 1.
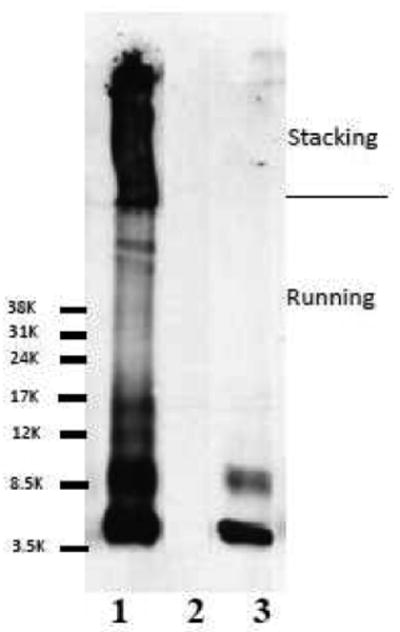
Immunoblotting showed the coupling of Aβ1-42 to USPIO using anti-Aβ monoclonal antibody 4G8. Lane 1 shows USPIO-Aβ1-42 in which Aβ1-42 coupled to nanoparticles is mainly in the stacking gel. A small proportion of Aβ1-42 which was not covalently bound to the particles entered the running gel. Lane 2 shows USPIO alone as negative control, with no bands seen. Lane 3 shows synthetic Aβ1-42 as a positive control, where the two bands seen are monomeric and dimeric Aβ1-42.
The binding affinity between Aβ and USPIO-Aβ1-42 was assessed by ELISA. The KD of USPIO-Aβ1-42 to Aβ1-40 was calculated to be 121.2 nM ± 25.76, which was higher than our previously reported binding of MION-Aβ1-40 to Aβ1-42 (Wadghiri et al., 2003). In our toxicity studies we found that Aβ1-42 alone at 10 μM was toxic, as expected, producing a 50% reduction in cell viability (Figure 2). One way ANOVA analysis gave a p=0.0095 for a difference between the groups. Newman-Keuls post-hoc analysis showed Aβ1-42 versus control, Aβ1-42 versus USPIO-Aβ1-42 and Aβ1-42 versus USPIO to be significantly different (p<0.01, p<0.01, p<0.05, respectively). USPIO versus control untreated cells, USPIO-Aβ1-42 versus control untreated cells and USPIO versus USPIO-Aβ1-42 did not differ significantly. Hence there was no evidence of significant toxicity of bound Aβ1-42 on the USPIO particles at a concentration of 10μM as compared to Aβ1-42 alone at the same concentration, under these conditions.
Figure 2.
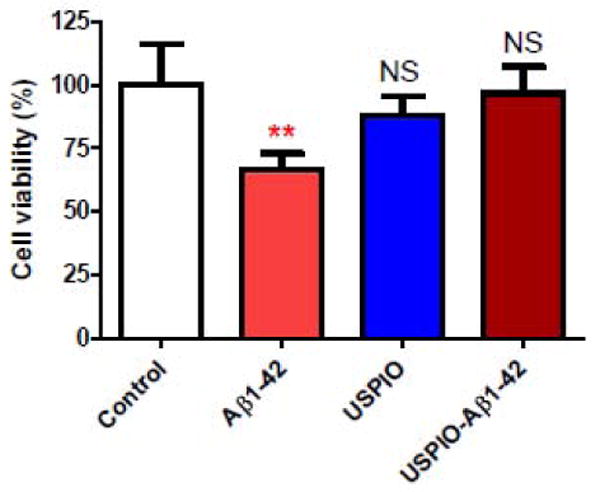
Bar graph illustrating tissue culture toxicity studies using USPIO-Aβ1-42, Aβ1-42 alone and uncoupled USPIO on N2a cells (mean ± s.d.). Cell viability of untreated control cells is set at 100%. There was no evidence of significant toxicity of bound Aβ1-42 on the USPIO particles at a concentration of 10μM as compared to Aβ1-42 alone at the same 10 μM concentration, under these conditions. One way ANOVA analysis gave a p=0.0095 for a difference between the groups. Newman-Keuls post-hoc analysis showed Aβ1-42 versus control, Aβ1-42 versus USPIO-Aβ1-42 and Aβ1-42 versus USPIO to be significantly different (**p<0.01, **p<0.01, p<0.05, respectively). USPIO versus control untreated cells, USPIO-Aβ1-42 versus control untreated cells and USPIO versus USPIO-Aβ1-42 did not differ significantly.
NS: not significant
μMRI studies
Femoral injection of USPIO-Aβ1-42 along with 15% mannitol, resulted in the detection of numerous dark spots in APP/PS1 mice using in vivo (N=6) T2*-based gradient echo (Third echo, TE = 12.3 ms) μMRI (Figure 3). The patterns of hypointense spots were similar to the Aβ distribution seen in matched histological sections, and the larger spots corresponded exactly to amyloid plaques (see arrowhead in Figure 3). In addition, two 14-month-old APP/PS1 mice imaged in vivo before injection and then again 6 hs after contrast injection. Amyloid plaques were only detected in the postinjection images (data not shown).
Figure 3.
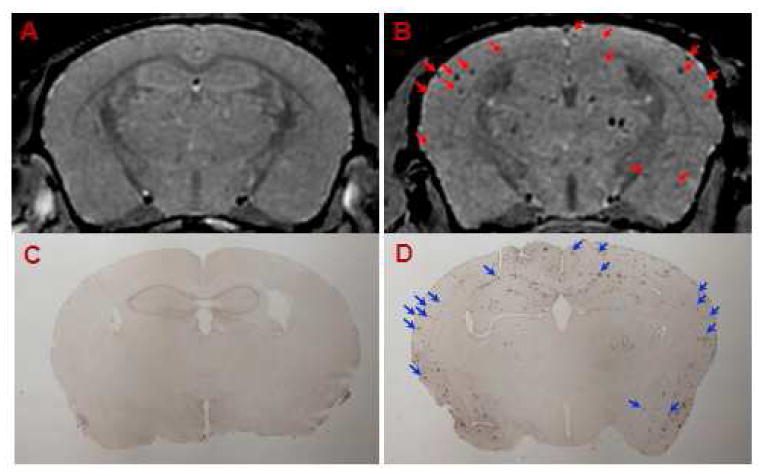
Amyloid plaques were detected with in vivo μMRI after intravenous femoral injection of USPIO-Aβ1-42 with mannitol. In vivo T2*-weighted MRI images show a 14 month-old wild-type (A) and APP/PS1 Tg (B) mouse brain. Note the matching of many large plaques (arrowheads) between immunohistochemistry (D) and μMRI (B) in the APP/PS1 Tg mice. C shows the lack of plaque detection in a wild type mouse following USPIO-Aβ1-42 injection.
Amyloid plaques were also detected in USPIO-Aβ1-42 injected transgenic mice on ex vivo T2*-weighted μMRI (Third echo, TE = 17.5) extracted from the four-echo dataset (Figure 4). In non-injected transgenic mice, very rare amyloid plaques were detected although there were numerous plaques present on immunostained tissue sections.
Figure 4.
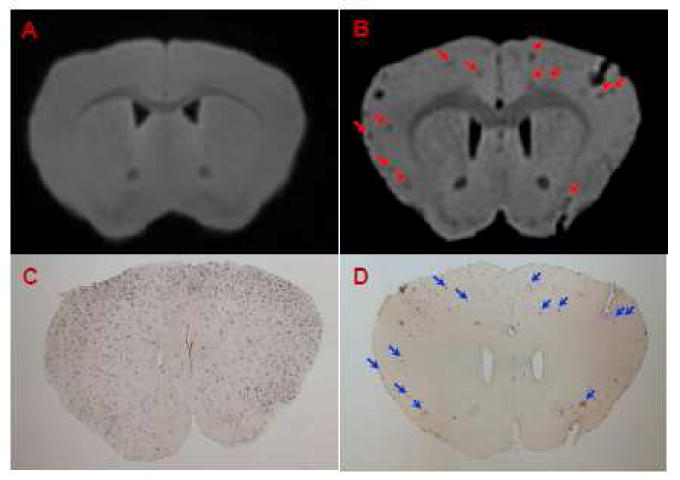
Amyloid plaques were detected with ex vivo T2*-weighted μMRI after intravenous femoral injection of USPIO-Aβ1-42 with mannitol. Many plaques can be detected in APP/PS1 mice injected with USPIO-Aβ1-42 (B). These lesions can be matched to immunostained amyloid plaques (D, arrowheads). μMRI failed to show significant numbers of amyloid plaques in a 16 month old APP/PS1 Tg mouse (A) which was not contrast injected but has histologically confirmed plaques (C).
T2* measurement
APP/PS1 mice injected with USPIO-Aβ1-42 showed a significant decrease in T2* value in both the cortex and hippocampus, compared with wild-type mice (Figure 5 and Table 2). There was no difference in T2* value in the cerebellum comparing transgenic and wild-type mice. This was expected since the cerebellum is an area of the brain not subject to amyloid deposition in this mouse model (Holcomb et al., 1998). Therefore, T2* change in USPIO-Aβ1-42 injected APP/PS1 mice was attributed to Aβ plaque deposition.
Figure 5.
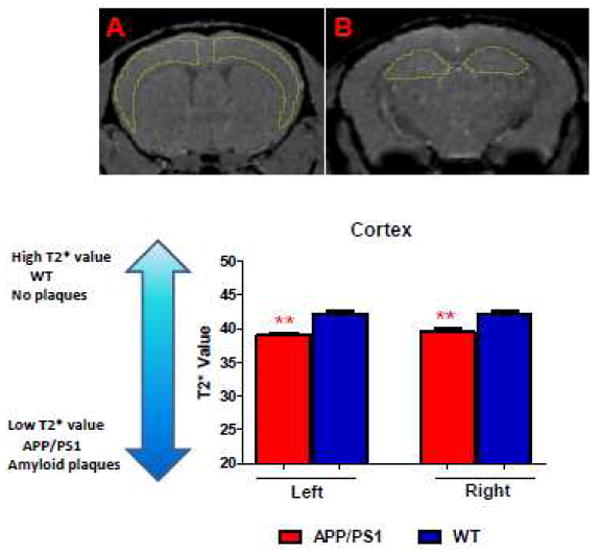
In vivo μMRI was used to measure absolute T2* values in regions of interest (ROI), which were the hippocampus, cortex and cerebellum. A and B showed representative anatomical localizations of the ROIs corresponding to the cortex and hippocampus, respectively. Panel C shows bar graphs corresponding to the differences in the left and right cortex in the contrast injected APP/PS1 Tg mice versus contrast injected wild-type mice. (** p<0.01).
Table 2. T2* values for wild type (WT) and APP/PS1 Tg mice after USPIO-Aβ1-42 injection.
| Genotype | Left CO | Right CO | Left HP | Right HP | Cerebellum |
|---|---|---|---|---|---|
| APP/PS1 Tg | 39.08±0.37 | 39.52±0.41 | 40.59±0.20 | 40.31±0.44 | 42.43±0.56 |
| WT | 42.23±0.44 | 42.13±0.40 | 43.00±0.61 | 42.55±0.43 | 41.17±0.53 |
| p-values | |||||
| APP/PS1 vs. WT | 0.0022* | 0.0043* | 0.0087* | 0.020* | 0.132 |
CO: Cortex; HP: Hippocampus.
non-parametric Mann-Whitney tests were used to compare groups.
VBM using SPM
Compared to MRI images from wild-type mice (n=12), significant loss of signal intensity, reflecting amyloid plaques was observed on the MRI scans of APP/PS1 mice (n=13) injected with USPIO-Aβ1-42 by VBM analysis (Figure 6). Clusters of voxels representing statistically significant darker areas of the brain corresponding to amyloid deposits are listed in Table 3. The largest significantly different clusters were found in the cortex, hippocampus and colliculus. The regional distribution of differences between the two groups mirrors the distribution of amyloid plaques histologically. No differences were seen in the cerebellum where there are no plaques.
Figure 6.
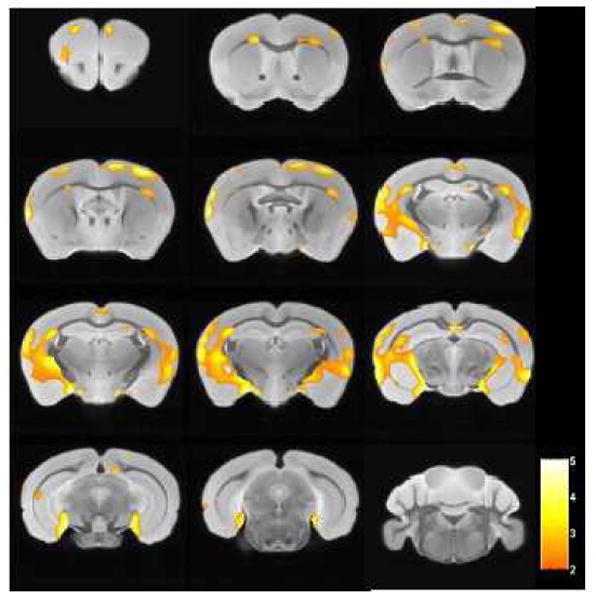
Areas of the brain are shown which differed by voxel-based analysis of ex vivo μMRI comparing USPIO-Aβ1-42 injected wild type (n=12) and APP/PS1 Tg (n=13) mice (p<0.01). The regions of differences mirror the distribution of amyloid plaques histologically, being mainly in the cortex and hippocampus. Color bar units are the T-score.
Table 3. Clusters with significant differences between WT (n=12) and AD transgenic mice (n=13) after contrast injection, with cluster extent greater than 500 voxels (p <0.01 uncorrected for multiple comparisons).
| Extent | P value | T-score | Cluster position | Brain region |
|---|---|---|---|---|
| 1123 | 0.000021 | 5.03 | FrA | Cortex (L) |
| 1624 | 0.000023 | 5.00 | RSG | Cortex (L) |
| 36911 | 0.000028 | 4.92 | S1BF | Cortex (L) |
| 2194 | 0.000047 | 4.72 | SuG | Colliculus (R) |
| 20830 | 0.000097 | 4.42 | PoDG | Hippocampus (R) |
| 4637 | 0.00014 | 4.27 | S1FL | Cortex (R) |
| 685 | 0.00027 | 4.02 | HDB | Cortex (R) |
| 656 | 0.00049 | 3.78 | LEnt | Cortex (L) |
| 770 | 0.00058 | 3.71 | M2 | Cortex (R) |
| 814 | 0.0010 | 3.48 | M1 | Cortex (L) |
| 653 | 0.0016 | 3.30 | S1FL | Cortex (L) |
| 1388 | 0.0031 | 3.02 | AuD | Cortex (R) |
Cluster position is given as the abbreviation used in the Paxinos and Franklin mouse brain atlas (Franklin and Paxinos, 2001). If a specific structure is not listed, there was no significantly different cluster in this structure.
A similar analysis was done in wild type (n=12) and APP/PS1 Tg mice (n=12) without contrast agent injection. No significant difference was detected in the cortex and hippocampus between these two groups. These are the areas of the brain with the greatest amyloid burden in these APP/PS1 transgenic mice (Gordon et al., 2002). The only difference was in the midbrain, an area of the brain without amyloid deposition (Figure 7).
Figure 7.
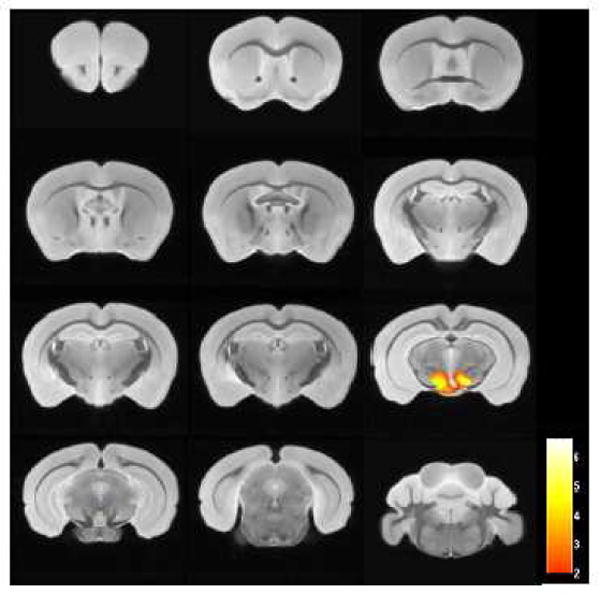
There was no difference in the cortex and hippocampus in wild type (n=12) and APP/PS1 Tg (n=12) mice without contrast injection (p<0.01), by the voxel-based analysis of the ex vivo μMRI shown. The only region that was significantly different was in the midbrain, which is likely to be due to slight atrophy of this area in the APP/PS1 Tg mice. Color bar units are the T-score.
Discussion
AD is currently the 6th commonest cause of death in the USA and represents a major global health care problem (Wimo and Prince, 2010). In vivo PET and MRI based quantitation of AD specific lesions represent an important research area to allow the early detection of AD related pathology, as well as providing a means of longitudinally following the effectiveness amyloid reducing therapeutic interventions.
Our studies document the ability of USPIO coupled to Aβ1-42 to detect amyloid plaques in AD model mice, when co-injected intravenously with mannitol to transiently open the BBB. In our prior studies using Aβ or Aβ homologous peptides to target iron nanoparticles or gadolinium to plaques we used intra-arterial carotid mannitol to open the BBB (Scholtzova et al., 2008; Sigurdsson et al., 2008; Zaim Wadghiri et al., 2003). This is a methodology which has been widely used to disrupt the BBB in order to deliver diverse substrates including enzymes, chemotherapeutic agents, antibodies and viral vectors (Doran et al., 1995; Gumerlock et al., 1992; Neuwelt et al., 1994; Rapoport, 2000); however, this method is very invasive and not suitable for longitudinal studies. The use of intravenous mannitol to disrupt the BBB has been investigated less, but recent studies document its ability, at doses similar to that used in the present study, to allow the CNS delivery of neurotrophic factors, viral vectors and USPIO (Larbanoix et al., 2010; McCarty et al., 2009; Yasuhara et al., 2010). These studies document that in rodents the maximum BBB disruption is 8 min after intravenous injection and lasts about 15 minutes, whereas after intra-arterial carotid injection the effect is maximal 5 minutes after injection, lasting about 20-30 minutes (McCarty et al., 2009). The plasma 1/2 life of USPIO has previously been shown to be ∼ 2 hr in mice (Weissleder et al., 1990), which is well within the window of BBB disruption induced by the intravenous mannitol used in our study. Intravenous mannitol is much better tolerated and is used safely in patients under a variety of clinical settings (Castillo et al., 2009; Tang and Lobel, 2009). Hence this method of BBB disruption is suitable for longitudinal studies in AD model animals and could potentially be used in patients under research settings. More widespread clinical use of our technique would require further refinement to increase the BBB permeability of the USPIO particles so that mannitol co-injection would not be required. Further potential modifications would include dual-ligand USPIO particles that in addition to being coupled to Aβ peptides for amyloid targeting are also coupled to proteins such as transferrin or lactoferrin which have been shown to aid in receptor mediated transport of nanoparticles across the BBB (Anthony et al., 2011; Gan and Feng, 2010; Huang et al., 2010; Weinstein et al., 2010). Such multifunctional USPIO particles would provide the potential of a “non-invasive biopsy” of the brain's AD related pathology (Anthony et al., 2011; McAteer and Choudhury, 2009). The binding affinity (KD) of our USPIO-Aβ1-42 to the Aβ peptide was ∼121nM, representing high affinity binding. The dosage we used of USPIO-Aβ1-42 at 0.2 mmol/kg body weight is in the range of clinical MRI applications for which contrast agents are typically injected intravenously at ∼ 0.1 mmol/kg for diagnostic purposes. Another cause of potential concern with USPIO-Aβ1-42 is the known toxicity of Aβ1-42 at micromolar concentrations (Pike et al., 1991). However, Aβ peptide toxicity is greatly dependent on its conformational/aggregation state as well as its concentration (Bharadwaj et al., 2009). We document that under our conditions where the Aβ1-42 is coupled to USPIO there is no evidence of toxicity in a standard tissue culture model and there was also no evidence of toxicity in our experimental animals. However, it would also be possible to design USPIO coupled to Aβ homologous peptides which are not toxic and non-fibrillogenic (Sigurdsson et al., 2008); such studies are underway.
To the best of our knowledge, this is the first study that combined histology, a ROI approach and VBM analysis to detect amyloid deposition in AD transgenic mice. Both ROI and VBM methods suggested that amyloid plaques can be detected after femoral injection with USPIO-Aβ1-42. It is notable that in our VBM analysis, the areas of the brain which differed significantly between the APP/PS1 Tg and wild-type contrast injected mouse groups matched well with the distribution of amyloid. VBM analysis comparing wild-type mice and APP/PS1 mice without USPIO-Aβ1-42 injection revealed almost no significant differences, highlighting the insensitivity of amyloid plaque detection without the use of a contrast agent. The comparison between the mouse groups without contrast injection only showed differences in the midbrain. This is an area of the brain where there is no amyloid deposition. It is likely the VBM analysis found this area to be different due to volume differences which have been previously reported to variably occur in the brainstem of APP/PS1 Tg mice compared to wild-type mice (Delatour et al., 2006). However, both histological and MRI morphological studies have reported the absence of hippocampal or cortical atrophy in APP/PS1 mice despite a heavy amyloid burden (Delatour et al., 2006; Manaye et al., 2007; Takeuchi et al., 2000). Therefore, the significant difference in the cortex and hippocampus we found in USPIO-Aβ1-42 injected groups was not due to brain atrophy.
Deciding whether to apply a ROI or VBM analysis will largely depend on the questions being addressed. VBM analysis can avoid manual delineation in individual subject and reduce the risk of bias and decreases variability. On the other hand, we found that ROI based analysis is more sensitive in statistical analysis so that a smaller group size is required to detect statistically significant changes. In conclusion, the two methods gave equivalent results, with the ROI method offering more sensitivity but a less anatomically informative result.
Our findings support the use of USPIO coupled to a targeting peptide which binds to Aβ as a method for the specific detection of AD plaques using μMRI. Both ROI and VBM analysis can be utilized to highlight and quantitate differences between control and Tg experimental groups. This method of plaque detection will be helpful in the evaluation and development of potential novel therapeutic interventions to reduce amyloid deposits in AD model animals. Given the prior safe use of USPIO in humans, this method also has the potential to be further developed for patient use.
Acknowledgments
We would like to thank S.J. Sawiak for providing the mouse brain atlas for the SPM analysis. This manuscript was supported by NIH grants AG20245, NS073502 and AG008051 to TW and by the American Health Assistance Foundation ADR (A2008-155) and the Alzheimer Association (IIRG-08-91618) to YZW.
Footnotes
Disclosure Statement: The authors have no actual or potential conflicts of interest.
Publisher's Disclaimer: This is a PDF file of an unedited manuscript that has been accepted for publication. As a service to our customers we are providing this early version of the manuscript. The manuscript will undergo copyediting, typesetting, and review of the resulting proof before it is published in its final citable form. Please note that during the production process errors may be discovered which could affect the content, and all legal disclaimers that apply to the journal pertain.
Reference List
- Anthony DC, Sibson NR, McAteer MA, Davis B, Choudhury RP. Detection of brain pathology by magnetic resonance imaging of iron oxide micro-particles. Methods Mol Biol. 2011;686:213–227. doi: 10.1007/978-1-60761-938-3_9. [DOI] [PubMed] [Google Scholar]
- Ashburner J. Computational anatomy with the SPM software. Magn Reson Imaging. 2009;27:1163–1174. doi: 10.1016/j.mri.2009.01.006. [DOI] [PubMed] [Google Scholar]
- Ashburner J, Friston KJ. Voxel-based morphometry- the methods. Neuroimage. 2000;11:805–821. doi: 10.1006/nimg.2000.0582. [DOI] [PubMed] [Google Scholar]
- Benveniste H, Einstein G, Kim KR, Hulette C, Johnson GA. Detection of neuritic plaques in Alzheimer's disease by magnetic resonance microscopy. Proceedings of the National Academy of Science (USA) 1999;96:14079–14084. doi: 10.1073/pnas.96.24.14079. [DOI] [PMC free article] [PubMed] [Google Scholar]
- Bernd H, De KE, Gaillard S, Bonnemain B. Safety and tolerability of ultrasmall superparamagnetic iron oxide contrast agent: comprehensive analysis of a clinical development program. Invest Radiol. 2009;44:336–342. doi: 10.1097/RLI.0b013e3181a0068b. [DOI] [PubMed] [Google Scholar]
- Bharadwaj PR, Dubey AK, Masters CL, Martins RN, Macreadie IG. Abeta aggregation and possible implications in Alzheimer's disease pathogenesis. J Cell Mol Med. 2009;13:412–421. doi: 10.1111/j.1582-4934.2009.00609.x. [DOI] [PMC free article] [PubMed] [Google Scholar]
- Borthakur A, Gur T, Wheaton AJ, Corbo M, Trojanowski JQ, Lee VM, Reddy R. In vivo measurement of plaque burden in a mouse model of Alzheimer's disease. J Magn Reson Imaging. 2006;24:1011–1017. doi: 10.1002/jmri.20751. [DOI] [PMC free article] [PubMed] [Google Scholar]
- Braakman N, Matysik J, Van Duinen SG, Verbeek F, Schliebs R, de Groot HJ, Alia A. Longitudinal assessment of Alzheimer's beta-amyloid plaque development in transgenic mice monitored by in vivo magnetic resonance microimaging. J Magn Reson Imaging. 2006;24:530–536. doi: 10.1002/jmri.20675. [DOI] [PubMed] [Google Scholar]
- Castillo LB, Bugedo GA, Paranhos JL. Mannitol or hypertonic saline for intracranial hypertension? A point of view. Crit Care Resusc. 2009;11:151–154. [PubMed] [Google Scholar]
- Chamberlain R, Reyes D, Curran GL, Marjanska M, Wengenack TM, Poduslo JF, Garwood M, Jack CR., Jr Comparison of amyloid plaque contrast generated by T2-weighted, T2*-weighted, and susceptibility-weighted imaging methods in transgenic mouse models of Alzheimer's disease. Magn Reson Med. 2009;61:1158–1164. doi: 10.1002/mrm.21951. [DOI] [PMC free article] [PubMed] [Google Scholar]
- Delatour B, Guegan M, Volk A, Dhenain M. In vivo MRI and histological evaluation of brain atrophy in APP/PS1 transgenic mice. Neurobiol Aging. 2006;27:835–847. doi: 10.1016/j.neurobiolaging.2005.04.011. [DOI] [PubMed] [Google Scholar]
- Doran SE, Ren XD, Betz AL, Pagel MA, Neuwelt EA, Roessler BJ, Davidson BL. Gene expression from recombinant viral vectors in the central nervous system after blood-brain barrier disruption. Neurosurgery. 1995;36:965–970. doi: 10.1227/00006123-199505000-00012. [DOI] [PubMed] [Google Scholar]
- Dubois A, Herard AS, Delatour B, Hantraye P, Bonvento G, Dhenain M, Delzescaux T. Detection by voxel-wise statistical analysis of significant changes in regional cerebral glucose uptake in an APP/PS1 transgenic mouse model of Alzheimer's disease. Neuroimage. 2010;51:586–598. doi: 10.1016/j.neuroimage.2010.02.074. [DOI] [PubMed] [Google Scholar]
- Dubois A, Herard AS, Flandin G, Duchesnay E, Besret L, Frouin V, Hantraye P, Bonvento G, Delzescaux T. Quantitative validation of voxel-wise statistical analyses of autoradiographic rat brain volumes: application to unilateral visual stimulation. Neuroimage. 2008;40:482–494. doi: 10.1016/j.neuroimage.2007.11.054. [DOI] [PubMed] [Google Scholar]
- El Tannir El TN, Delatour B, Le CC, Guegan M, Volk A, Dhenain M. Age-related evolution of amyloid burden, iron load, and MR relaxation times in a transgenic mouse model of Alzheimer's disease. Neurobiol Dis. 2006;22:199–208. doi: 10.1016/j.nbd.2005.10.013. [DOI] [PubMed] [Google Scholar]
- Falangola MF, Dyakin VV, Lee SP, Bogart A, Babb JS, Duff K, Nixon R, Helpern JA. Quantitative MRI reveals aging-associated T2 changes in mouse models of Alzheimer's disease. NMR in Biomedicine. 2007;20:343–351. doi: 10.1002/nbm.1163. [DOI] [PubMed] [Google Scholar]
- Franklin KBJ, Paxinos G. The mouse brain in stereotaxic coordinates. Academic Press; London: 2001. [Google Scholar]
- Gan CW, Feng SS. Transferrin-conjugated nanoparticles of poly(lactide)-D-alpha-tocopheryl polyethylene glycol succinate diblock copolymer for targeted drug delivery across the blood-brain barrier. Biomaterials. 2010;31:7748–7757. doi: 10.1016/j.biomaterials.2010.06.053. [DOI] [PubMed] [Google Scholar]
- Golabek AA, Soto C, Vogel T, Wisniewski T. The interaction between apolipoprotein E and Alzheimer's amyloid β-peptide is dependent on β-peptide conformation. Journal of Biological Chemistry. 1996;271:10602–10606. doi: 10.1074/jbc.271.18.10602. [DOI] [PubMed] [Google Scholar]
- Gordon MN, Holcomb LA, Jantzen PT, DiCarlo G, Wilcock D, Boyett KW, Connor K, Melachrino J, O'Callaghan JP, Morgan D. Time course of the development of Alzheimer-like pathology in the doubly transgenic PS1+APP mouse. Exp Neurol. 2002;173:183–195. doi: 10.1006/exnr.2001.7754. [DOI] [PubMed] [Google Scholar]
- Gumerlock MK, Belshe BD, Madsen R, Watts C. Osmotic blood-brain barrier disruption and chemotherapy in the treatment of high grade malignant glioma: patient series and literature review. J Neurooncol. 1992;12:33–46. doi: 10.1007/BF00172455. [DOI] [PubMed] [Google Scholar]
- Hardy J, Selkoe DJ. The amyloid hypothesis of Alzheimer's disease: progress and problems on the road to therapeutics. Science. 2002;297:353–356. doi: 10.1126/science.1072994. [DOI] [PubMed] [Google Scholar]
- Helpern J, Lee SP, Falangola MF, Dyankin V, Bogart A, Ardekani B, Duff K, Branch C, Wisniewski T, De Leon MJ, Wolf O, O'Shea J, Nixon R. Magnetic Resonance imaging assessment of neuropathology in a transgenic mouse model of Alzheimer's disease. Magnetic Resonance in Medicine. 2004;51:794–798. doi: 10.1002/mrm.20038. [DOI] [PubMed] [Google Scholar]
- Holcomb L, Gordon MN, McGowan E, Yu X, Benkovic S, Jantzen P, Saad WK, Mueller R, Morgan D, Sanders S, Zehr C, O'Campo K, Hardy J, Prada CM, Eckman C, Younkin S, Hsiao K, Duff K. Accelerated Alzheimer-type phenotype in transgenic mice carrying both mutant amyloid precursor protein and presenilin 1 transgenes. Nature Medicine. 1998;4:97–100. doi: 10.1038/nm0198-097. [DOI] [PubMed] [Google Scholar]
- Huang R, Ke W, Han L, Liu Y, Shao K, Jiang C, Pei Y. Lactoferrin-modified nanoparticles could mediate efficient gene delivery to the brain in vivo. Brain Res Bull. 2010;81:600–604. doi: 10.1016/j.brainresbull.2009.12.008. [DOI] [PubMed] [Google Scholar]
- Huddleston DE, Small SA. Technology insight: imaging amyloid plaques in the living brain with positron emission tomography and MRI. Nat Cllin Prac Neurol. 2005;1:96–105. doi: 10.1038/ncpneuro0046. [DOI] [PubMed] [Google Scholar]
- Jack CR, Garwood M, Wengenack TM, Borowski B, Curran GL, Lin J, Adriany G, Grohn OHJ, Grimm R, Poduslo JF. In vivo visualization of Alzheimer's amyloid plaques by magnetic resonance imaging in transgenic mice without a contrast agent. Magnetic Resonance in Medicine. 2004;52:1263–1271. doi: 10.1002/mrm.20266. [DOI] [PMC free article] [PubMed] [Google Scholar]
- Larbanoix L, Burtea C, Laurent S, Van LF, Toubeau G, Vander EL, Muller RN. Potential amyloid plaque-specific peptides for the diagnosis of Alzheimer's disease. Neurobiol Aging. 2010;31:1679–1689. doi: 10.1016/j.neurobiolaging.2008.09.021. [DOI] [PubMed] [Google Scholar]
- Lee SP, Falangola MF, Nixon RA, Duff K, Helpern JA. Visualization of β-amyloid plaques in a transgenic mouse model of Alzheimer's disease using MR microscopy without contrast reagents. Magnetic Resonance in Medicine. 2004;52:538–544. doi: 10.1002/mrm.20196. [DOI] [PMC free article] [PubMed] [Google Scholar]
- Lemere CA, Masliah E. Can Alzheimer disease be prevented by amyloid-beta immunotherapy? Nat Rev Neurol. 2010;6:108–119. doi: 10.1038/nrneurol.2009.219. [DOI] [PMC free article] [PubMed] [Google Scholar]
- Manaye KF, Wang PC, O'Neil JN, Huang SY, Xu T, Lei DL, Tizabi Y, Ottinger MA, Ingram DK, Mouton PR. Neuropathological quantification of dtg APP/PS1: neuroimaging, stereology, and biochemistry. Age (Dordr) 2007;29:87–96. doi: 10.1007/s11357-007-9035-y. [DOI] [PMC free article] [PubMed] [Google Scholar]
- McAteer MA, Choudhury RP. Chapter 4 - Applications of nanotechnology in molecular imaging of the brain. Progress in Brain Research. 2009;180:72–96. doi: 10.1016/S0079-6123(08)80004-0. [DOI] [PubMed] [Google Scholar]
- McCarty DM, Dirosario J, Gulaid K, Muenzer J, Fu H. Mannitol-facilitated CNS entry of rAAV2 vector significantly delayed the neurological disease progression in MPS IIIB mice. Gene Ther. 2009;16:1340–1352. doi: 10.1038/gt.2009.85. [DOI] [PMC free article] [PubMed] [Google Scholar]
- Meadowcroft MD, Connor JR, Smith MB, Yang QX. MRI and histological analysis of beta-amyloid plaques in both human Alzheimer's disease and APP/PS1 transgenic mice. J Magn Reson Imaging. 2009;29:997–1007. doi: 10.1002/jmri.21731. [DOI] [PMC free article] [PubMed] [Google Scholar]
- Neuwelt EA, Barnett PA, Hellstrom KE, Hellstrom I, McCormick CI, Ramsey FL. Effect of blood-brain barrier disruption on intact and fragmented monoclonal antibody localization in intracerebral lung carcinoma xenografts. J Nucl Med. 1994;35:1831–1841. [PubMed] [Google Scholar]
- Nieman BJ, Szulc KU, Turnbull DH. Three-dimensional, in vivo MRI with self-gating and image coregistration in the mouse. Magn Reson Med. 2009;61:1148–1157. doi: 10.1002/mrm.21945. [DOI] [PMC free article] [PubMed] [Google Scholar]
- Nordberg A, Rinne JO, Kadir A, Langstrom B. The use of PET in Alzheimer disease. Nat Rev Neurol. 2010;6:78–87. doi: 10.1038/nrneurol.2009.217. [DOI] [PubMed] [Google Scholar]
- Perl DP. Neuropathology of Alzheimer's disease. Mt Sinai J Med. 2010;77:32–42. doi: 10.1002/msj.20157. [DOI] [PMC free article] [PubMed] [Google Scholar]
- Pike CJ, Walencewicz AJ, Glabe C, Cotman C. In vitro aging of β-amyloid protein causes peptide aggregation and neurotoxicity. Brain Research. 1991;563:311–314. doi: 10.1016/0006-8993(91)91553-d. [DOI] [PubMed] [Google Scholar]
- Rabinovici GD, Jagust WJ. Amyloid imaging in aging and dementia: testing the amyloid hypothesis in vivo. Behav Neurol. 2009;21:117–128. doi: 10.3233/BEN-2009-0232. [DOI] [PMC free article] [PubMed] [Google Scholar]
- Rafii MS, Aisen PS. Recent developments in Alzheimer's disease therapeutics. BMC Med. 2009;7:7. doi: 10.1186/1741-7015-7-7. [DOI] [PMC free article] [PubMed] [Google Scholar]
- Rapoport SI. Osmotic opening of the blood-brain barrier: principles, mechanism, and therapeutic applications. Cell Mol Neurobiol. 2000;20:217–230. doi: 10.1023/a:1007049806660. [DOI] [PubMed] [Google Scholar]
- Sadowski M, Pankiewicz J, Scholtzova H, Ripellino JA, Li Y, Schmidt SD, Mathews P, Fryer JD, Holtzman DM, Sigurdsson EM, Wisniewski T. Blocking the apolipoprotein E/ß-amyloid interaction reduces β-amyloid toxicity and decreases β-amyloid load in transgenic mice. American Journal of Pathology. 2004;165:937–948. doi: 10.1016/s0002-9440(10)63355-x. [DOI] [PMC free article] [PubMed] [Google Scholar]
- Sawiak SJ, Wood NI, Williams GB, Morton AJ, Carpenter TA. Voxel-based morphometry in the R6/2 transgenic mouse reveals differences between genotypes not seen with manual 2D morphometry. Neurobiol Dis. 2009;33:20–27. doi: 10.1016/j.nbd.2008.09.016. [DOI] [PubMed] [Google Scholar]
- Scholtzova H, Wadghiri YZ, Douadi M, Sigurdsson EM, Li Y, Quartermain D, Banerjee P, Wisniewski T. A NMDA receptor antagonist leads to behavioral improvement and amyloid reduction in Alzheimer's disease model transgenic mice shown by micro-magnetic resonance imaging. Journal of Neuroscience Research. 2008;86:2784–2791. doi: 10.1002/jnr.21713. [DOI] [PMC free article] [PubMed] [Google Scholar]
- Sigurdsson EM, Scholtzova H, Mehta P, Frangione B, Wisniewski T. Immunization with a non-toxic/non-fibrillar amyloid-β homologous peptide reduces Alzheimer's disease associated pathology in transgenic mice. American Journal of Pathology. 2001;159:439–447. doi: 10.1016/s0002-9440(10)61715-4. [DOI] [PMC free article] [PubMed] [Google Scholar]
- Sigurdsson EM, Wadghiri YZ, Mosconi L, Blind JA, Knudsen E, Asuni A, Tsui WH, Sadowski M, Turnbull D, de Leon M, Wisniewski T. A non-toxic ligand for voxel-based MRI analysis of plaques in AD transgenic mice. Neurobiol Aging. 2008;29:836–877. doi: 10.1016/j.neurobiolaging.2006.12.018. [DOI] [PMC free article] [PubMed] [Google Scholar]
- Sigurdsson EM, Wadghiri YZ, Sadowski M, Elliot JI, Li Y, Scholtzova H, Tang CY, Aguilanldo JG, Pappolla M, Duff K, Wisniewski T. In vivo magnetic resonance of amyloid plaques in Alzheimer's disease model mice. In: Hyman B, editor. The Living Brain and Alzheimer's disease. Springer-Verlag; Berlin: 2004. [Google Scholar]
- Stoll G, Bendszus M. Imaging of inflammation in the peripheral and central nervous system by magnetic resonance imaging. Neuroscience. 2009;158:1151–1160. doi: 10.1016/j.neuroscience.2008.06.045. [DOI] [PubMed] [Google Scholar]
- Takeuchi A, Irizarry MC, Duff K, Saido T, Hsiao Ashe K, Hasegawa H, Mann DM, Hyman BT, Iwatsubo T. Age-related amyloid β deposition in transgenic mice overexpressing both Alzheimer mutant presenilin 1 and amyloid β precursor protein swedish mutant is not associated with global neuronal loss. American Journal of Pathology. 2000;157:331–339. doi: 10.1016/s0002-9440(10)64544-0. [DOI] [PMC free article] [PubMed] [Google Scholar]
- Tang ME, Lobel DA. Severe traumatic brain injury: maximizing outcomes. Mt Sinai J Med. 2009;76:119–128. doi: 10.1002/msj.20106. [DOI] [PubMed] [Google Scholar]
- Tanzi RE, Bertram L. Twenty years of the Alzheimer's disease amyloid hypothesis: a genetic perspective. Cell. 2005;120:545–555. doi: 10.1016/j.cell.2005.02.008. [DOI] [PubMed] [Google Scholar]
- Vanhoutte G, Dewachter I, Borghgraef P, Van LF, Van der LA. Noninvasive in vivo MRI detection of neuritic plaques associated with iron in APP[V717I] transgenic mice, a model for Alzheimer's disease. Magn Reson Med. 2005;53:607–613. doi: 10.1002/mrm.20385. [DOI] [PubMed] [Google Scholar]
- Wadghiri YZ, Sigurdsson EM, Sadowski M, Elliot JI, Li Q, Scholtzova H, Tang CY, Aguinaldo JG, Pappolla M, Duff K, Turnbull D, Wisniewski T. Detection of Alzheimer's amyloid in transgenic mice using magnetic resonance micro-imaging. Magnetic Resonance in Medicine. 2003;50:293–302. doi: 10.1002/mrm.10529. [DOI] [PubMed] [Google Scholar]
- Wadghiri YZ, Sigurdsson EM, Wisniewski T, Turnbull D. MR Imaging of amyloid plaques in transgenic mice. In: Sigurdsson EM, editor. Amyloid Proteins: Methods and Protocols. Humana Press Inc.; Totowa, NJ: 2005. pp. 365–379. [DOI] [PubMed] [Google Scholar]
- Weinstein JS, Varallyay CG, Dosa E, Gahramanov S, Hamilton B, Rooney WD, Muldoon LL, Neuwelt EA. Superparamagnetic iron oxide nanoparticles: diagnostic magnetic resonance imaging and potential therapeutic applications in neurooncology and central nervous system inflammatory pathologies, a review. J Cereb Blood Flow Metab. 2010;30:15–35. doi: 10.1038/jcbfm.2009.192. [DOI] [PMC free article] [PubMed] [Google Scholar]
- Weissleder R, Elizondo G, Wittenberg J, Lee AS, Josephson L, Brady TJ. Ultrasmall superparamagnetic iron oxide: an intravenous contrast agent for assessing lymph nodes with MR imaging. Radiology. 1990;175:494–498. doi: 10.1148/radiology.175.2.2326475. [DOI] [PubMed] [Google Scholar]
- Wimo A, Prince M. World Alzheimer Report 2010: the global economic impact of dementia. Alzheimer's Disease International 2010 [Google Scholar]
- Wisniewski T, Boutajangout A. Vaccination as a therapeutic approach for Alzheimer's disease. Mount Sinai Journal of Medicine. 2010;77:17–31. doi: 10.1002/msj.20156. [DOI] [PMC free article] [PubMed] [Google Scholar]
- Yasuhara T, Hara K, Maki M, Xu L, Yu G, Ali MM, Masuda T, Yu SJ, Bae EK, Hayashi T, Matsukawa N, Kaneko Y, Kuzmin-Nichols N, Ellovitch S, Cruz EL, Klasko SK, Sanberg CD, Sanberg PR, Borlongan CV. Mannitol facilitates neurotrophic factor up-regulation and behavioural recovery in neonatal hypoxic-ischaemic rats with human umbilical cord blood grafts. J Cell Mol Med. 2010;14:914–921. doi: 10.1111/j.1582-4934.2008.00671.x. [DOI] [PMC free article] [PubMed] [Google Scholar]
- Zaim Wadghiri Y, Sigurdsson EM, Sadowski M, Tang CY, Aguilanldo JG, Elliot JI, Li Y, Pappolla MA, Duff K, Turnbull D, Wisniewski T. Detection of Alzheimer's amyloid lesions in transgenic mice by magnetic resonance imaging. Magnetic Resonance in Medicine. 2003;50:293–302. doi: 10.1002/mrm.10529. [DOI] [PubMed] [Google Scholar]