Abstract
We have employed laser induced liquid bead ion desorption mass spectroscopy (LILBID MS) to study the solution behavior of Pseudomonas aeruginosa azurin as well as two mutants and corresponding Re-labeled derivatives containing a Re(CO)3(4,7-dimethyl-1,10-phenanthroline) chromophore appended to a surface histidine. LILBID spectra show broad oligomer distributions whose particular patterns depend on the solution composition (pure H2O, 20–30 mM NaCl, 20 and 50 mM NaPi or NH4Pi at pH = 7). The distribution maximum shifts to smaller oligomers upon decreasing the azurin concentration and increasing the buffer concentration. Oligomerization is less extensive for native azurin than its mutants. The oligomerization propensities of unlabeled and Re-labeled proteins are generally comparable, only Re126 shows some preference for the dimer that persists even in highly diluted solutions. Peak shifts to higher masses and broadening in 20–50 mM NaPi confirm strong azurin association with buffer ions and solvation. We have found that LILBID MS reveals the solution behavior of weakly bound nonspecific oligomers, clearly distinguishing individual components of the oligomer distribution. Independently, average data on oligomerization and the dependence on solution composition were obtained by time-resolved anisotropy of the Re-label photoluminescence that confirmed relatively long rotation correlation times, 6–30 ns, depending on Re-azurin and solution composition. Labeling proteins with Re-chromophores that have long-lived phosphorescence extends the timescale of anisotropy measurements to hundreds of ns, thereby opening the way for investigations of large oligomers with long rotation times.
Introduction
Association of proteins in solution often is essential for redox function.1 Indeed, many small redox proteins form complexes with enzymes to deliver electrons across protein-protein interfaces.2 Self-association (oligomerization) is important for protein crystallization,3,4 and, in certain cases, can lead to aggregation and precipitation of insoluble deposits such as amyloids.5 Protein association can change upon small variations of structure such as replacing a single amino acid,5,6 modifying a side-chain, or changing the solution composition.3 In the case of the pseudoazurin-nitrite reductase complex, it was found that the association mode and dynamics depend on the copper oxidation state in the azurin molecule, supposedly to distinguish between the substrate and product states of the enzymatic reaction.2 A great deal of effort has been invested with the goal of defining protein-protein interactions and devising strategies on how to control protein association, either by disrupting7 or engineering1 protein complexes and interfaces. Labeling proteins with metal-containing groups and exploring metal-ligand interactions emerge as promising approaches to direct protein self-assembly.1
Not many experimental techniques report directly on the protein solution state and also provide chemical information on protein complexes and oligomers as well as their distributions. Laser-induced liquid bead ion desorption mass spectroscopy8 (LILBID MS) is a newly developed method for determining masses of biomolecules in solution and the composition of complexes consisting of noncovalently bound subunits.8–10 Importantly, the method has been used to characterize large integral membrane protein complexes, including successful determination of the subunit composition of mitochondrial complex I.11
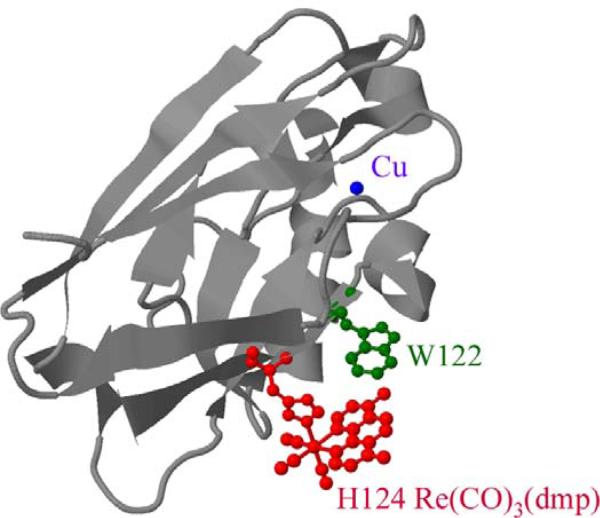
In our ongoing program of study of metalloprotein structures and dynamics, we have employed LILBID MS to examine the solution state of a soluble blue copper protein, Pseudomonas aeruginosa azurin, with the goal of obtaining definitive evidence for the presence of weakly bound nonspecific oligomers as well as information about their distribution as a function of solution composition. Azurins function as mobile electron-transport mediators in bacterial respiration, denitrification and oxidative stress response.12–14 In each protein molecule, a single CuII atom is trigonally coordinated by strong Cu-S(Cys112), Cu-N(His117), and Cu-N(His46) equatorial bonds, complemented by weak axial interactions with O(Gly45) and S(Met121).12,15 The Pseudomonas aeruginosa protein (~13.9 kDa, 128 amino acid residues) exhibits a β-barrel structure formed from eight β-strands with an attached α-helix (Figure 1). The copper ligand His117 protrudes through the protein surface at the center of a shallow depression - a hydrophobic patch that is assumed to be the docking site of physiological redox partners.13,14 A disulfide bridge is present at the opposite site of the molecule, 2.6 nm from the Cu atom. The protein is thermally stable up to 82 °C16 and withstands strong external electric fields.17 Its structure and stability are retained upon reducing, removing or exchanging the CuII atom, modifying18 the metal binding site or mutating amino acids in the peptide chain. The CuII/CuI redox couple is reversible and the Cu oxidation state can be switched photochemically or electrochemically, making azurins promising candidates for applications in molecular devices, such as biomemories or rectifiers.17,19–21
Figure 1.
Model of the structure of Re(CO)3(dmp)(H124)(W122)azurinCuII. The Re unit bound to the H124 imidazole is red; W122 is green; and Cu is blue. Notation: H83 is native azurin; H83 and H126 are the mutants (T124H)(K122W)(H83Q)(W48F)(Y72F)(Y108F)azurinCuII and (T126H)(K122W)(H83Q)(W48F)(Y72F)(Y108F)azurinCuII; and Re124 and Re126 are their Relabeled derivatives.
The azurin from Pseudomonas aeruginosa has been a benchmark for electron tunneling through peptide β-strands based on analyses of kinetics data from three different types of experiments: electrochemical reduction of CuII derivatives immobilized on self-assembled alkanethiol monolayers at Au electrodes;22–24 pulse-radiolytic25–27 reduction of the –S–S– bridge followed by electron transfer (ET) to CuII; and phototriggered ET from CuI to an electronically excited or flash/quench oxidized metal-polypyridine sensitizer bound to histidine on the surface of the reduced protein.28–36 The results indicate that the electron tunneling steps in the aforementioned experiments are all intramolecular processes, with no consideration given to possible complications owing to protein self-association. Of relevance is one study of ET across a protein-protein interface in azurin crystals, where the intermolecular reaction is 5–10 times slower than the related intramolecular process, likely owing to the longer distance between redox centers in the former case.36
We suggest that it would be prudent to consider possible intermolecular ET pathways in protein oligomers when designing protein-based molecular devices and photocatalysts. And, in the case of proteins labeled with metal chromophores, oligomerization could alter the excited-state character and relaxation dynamics of the metalloprobe, most especially if it is located at the protein interface. For all these reasons, we have examined the self-association of two Re-azurins (Re124 and Re126) that undergo rapid phototriggered ET reactions. We also have studied their unlabeled forms H124 and H126, as well as the unlabeled and Re-labeled wild-type proteins (H83 and Re83). Employing LILBID MS, we demonstrate that the two azurin mutants and their Re-labeled derivatives associate in solution, with broad oligomer distributions that are dependent on the concentration of buffer ions.
Experimental
Materials
Wild-type Pseudomonas aeruginosa azurin and two mutants, designated all-Phe (H83Q/Y72F/Y108F/W48F), with additional mutations K122W/T124H and K122W/T126H, were transformed into BL21 (DE3) single competent cells. The large scale expression was inoculated in 6 L of LB broth with 60 mg/mL ampicillin and induced using IPTG. The protein was isolated from cells using osmotic shock (1 M sucrose solution, followed by 1 M MgSO4) and acidified to 25 mM sodium acetate (NaOAc) buffer pH 4.5 in 0 °C for 4 days to remove unnecessary proteins from the crude extract. The apoprotein was metallated during the acidification process by adding 10 mM CuSO4·5H2O to the crude extract. The crude protein was concentrated and purified by FPLC with a cationic exchange resin (Mono-S, Pharmacia). The protein was loaded onto the column in 25 mM NaOAc buffer, pH 4.5 and eluted with a concentration gradient (300 mM NaOAc buffer, pH 4.5). Once purified, the proteins were desalted using a PD-10 gel filtration column (Pharmacia) into 75 mM sodium phosphate (NaPi) pH 7.4 (dilutes to 20 mM NaPi pH 7.2 for the reaction). To label the proteins, the concentrated protein was added to a 1 mM [Re(H2O)(CO)3(dmp)](OTf) solution at 37 °C in the dark for 5–21 days, depending on the labeling site. The reaction was quenched by filtering the excess Re and exchanging the buffer solution to 25 mM NaOAc pH 4.5 with a PD-10 column. To extract any remaining Re, the protein was left in the NaOAc at 4 °C for 3 days and then desalted into 20 mM NaPi pH 7.2. The labeled derivative was separated from the unlabeled protein on a HiTrap Copper Chelating Column, loading with 20 mM NaPi pH 7.2 + 750 mM NaCl and eluting with 20 mM NaPi pH 7.2 + 750 mM NH4Cl. Final purification was achieved with a cation exchange resin using 25 mM NaOAc pH 4.5 and eluting at 300 mM NaOAc buffer pH 4.5. Once purified, both labeled and unlabeled proteins were exchanged into 20 mM NaPi buffer pH 7.2 and concentrated to approximately 1 mM.
NH4Pi buffer for measurements was made from NH4H2PO4 by adjusting the pH to 7.0 by adding aqueous NH3. NaPi buffer was made from NaH2PO4 and NaOH.
LILBID mass spectrometry
The detailed experimental setup for LILBID has been published elsewhere.8 Briefly, microdroplets of sample solution (diameter 50 μm, volume 65 pl) are produced on demand at 10 Hz by a piezo-driven droplet generator and introduced into vacuum via differential pumping stages, where the droplets are irradiated one by one by synchronized high-power nanosecond mid-IR 6 ns laser pulses, generated in a home-built optical parametric oscillator (OPO) using LiNbO3 crystals pumped by a Nd:YAG laser. The wavelength of the OPO radiation is tuned into the absorption maximum of water at around 3 μm, exciting its stretching vibrations. The preformed protein ions are laser desorbed/ablated from the liquid phase into the gas phase at typical laser pulse energies of several mJ, where they are mass-analyzed in a home-built reflectron time-of-flight (TOF) mass spectrometer. To detect very large biomolecules with m/z up to 106, a Daly-type ion detector was used. The delay between the laser and high-voltage ion-accelerating pulses was set at 10 μs, unless stated otherwise. Measurements were performed at three different desorption modes, hereinafter called harsh, soft, and ultrasoft, in order of decreasing laser intensity. In the ultrasoft mode, laser pulses desorb ions out of the liquid very gently, enabling detection of noncovalently assembled protein complexes. At elevated laser intensities (soft and harsh modes) the complexes and oligomers can thermolyze to a variable degree into subcomplexes, subunits or monomers.
Samples for LILBID MS measurements were either diluted by 20 mM sodium phosphate buffer of pH 7, or they were first transferred into water using Zeba(™) Micro Desalt Spin Columns (Pierce) following a standard procedure and then diluted to the required concentrations of salt and protein. For each experiment, 5 μl of sample solution was loaded into a droplet generator and measured within the first 10 minutes. Only azurin anions were analyzed.
Emission decay and time-resolved anisotropy
Emission lifetime and time-resolved anisotropy measurements were performed using time-correlated single-photon counting (TCSPC) on an IBH 5000 U instrument equipped with a cooled Hamamatsu R3809U-50 microchannel plate photomultiplier. Samples were excited at 370 nm with an IBH NanoLED-03 diode laser (~100 ps FWHM, 500 kHz repetition rate). The emission monochromator was set to the wavelength of the emission maximum. Data were analyzed using IBH Datastation2 or Microcal Origin 7.1 software. Values of the anisotropy were calculated as follows:
| (1) |
where Ivv and Ivh are intensities recorded at different orientations of the polarizers, i.e., “v” and “h” subscripts represent the vertical and horizontal directions, respectively. The first and second subscripts denote the direction plane of the polarization in the excitation and emission arm, respectively, and G is the correction factor. Separate anisotropy measurements were performed in two time ranges, 0–215 ns (resolution of 228 ps /channel) and 0–9.2 ns (11.6 ps / channel), to capture slow and the fast anisotropy decays, respectively. The slow rotation time was determined first from the long-range measurement and its value was fixed when fitting the short-range anisotropy decay biexponentially. Emission intensity decays were measured at the magic angle between the excitation and emission polarization directions in 0–9.2 and 0–900 ns ranges, using 11.6 and 971.5 ps/channel resolutions, respectively. Data obtained in the long time range were fit to bi- or tri-exponential kinetics. The sample solutions were placed under air in a 1.5 mm fluorescence microcell (Hellma). The temperature was maintained at 21 °C.
Results and Discussion
General information on LILBID spectra
LILBID MS enables mass characterization of biomolecules in solution. It can determine composition of their complexes, even if they consist of noncovalently bound subunits, and detect specific interactions.8–11,37 The laser intensity applied to a sample droplet and the strength of interaction between subunits are two major factors determining whether a molecule appears in the spectrum bound to its interacting partners or separated from them. In a certain range of laser intensities, both bound and dissociated states can appear in a single spectrum. A distribution ranging from monomers to larger oligomers can then be observed, resulting either from breaking a predominant large oligomer into pieces, or reflecting the actual oligomer distribution. Distinguishing between these two possibilities, especially for loosely bound molecules, is not straightforward.
The best mass resolution is reached with protein samples containing no sodium or potassium ions. These cations form adducts with proteins, broadening and shifting peaks toward higher masses, which ultimately can result in signal loss.8 On the other hand, high-resolution spectra can be measured in the presence of NH4+ ions, which decompose during the droplet explosion. The actual buffer composition used in experiments is a compromise between the requirements for high peak intensities and narrow widths on one hand, and the ionic strength together with specific ions needed by the protein or the experimental procedure on the other.
When laser energy is absorbed by excitation of H2O stretching vibrations, solvent water presumably undergoes a fast nonequilibrium transition into a supercritical state, where its dielectric constant is very small. The ions are no longer electrostatically shielded and start to recombine, the only moment when any change of solution species into ions flying to the detector might be expected. Incomplete recombination between oppositely charged ions produces the “lucky survivors”, which are gas-phase ions escaping neutralization that are finally detected. The extent of ion recombination is limited to the close vicinity of the molecule under study, so only counter ions from the buffer are expected to take part. This process happens in the first stage of the explosion into a 10−5 mbar vacuum, which decreases along the flying path to 10−7 mbar. Molecular association or oligomerization induced by laser irradiation or ionization is excluded because the sample droplet responds to the laser impact explosively,8 causing a very rapid (<1 μs) decrease of the number density of dissolved species. Indeed, only complexes of structurally adjacent subunits in cytochrome c oxidase spectra have been observed,9 indicating that random subunit aggregation does not occur in the gas phase. Other examples of LILBID specificity have been documented.37,38
LILBID spectra in NH4Pi buffer solutions
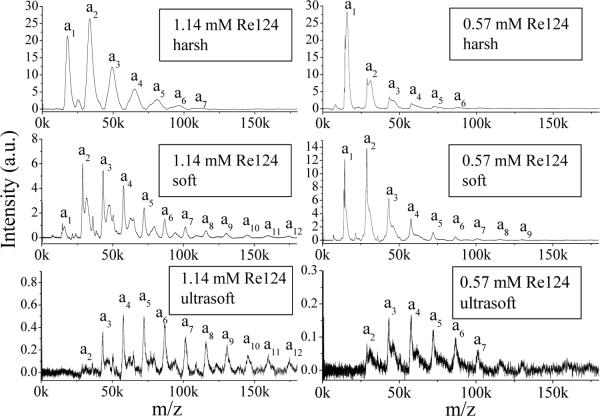
Typical anion LILBID mass spectra in are displayed in Figure 2 for Re124. Each spectrum shows a series of peaks, each of which corresponds to a particular singly-charged oligomer anion. In addition, weak signals due to doubly charged species occur between the strong peaks. The whole peak series reflects the oligomer distribution in solution. Increasing the laser intensity from ultrasoft to soft and then to harsh increases the monomer and dimer peak intensities at the expense of those due to larger oligomers. Such a shift of the observed oligomer distribution to lower masses with increasing laser intensity indicates partial fragmentation of higher oligomers by the ionization process, at least at higher laser intensities.
Figure 2.
LILBID spectra of Re124 in 20 mM NH4Pi measured under different conditions and concentrations, 1.14 mM (left column) and 0.57 mM (right column). Azurin oligomers are labeled a1 to a12.
The maxima of sharp peaks in the soft and ultrasoft NH4Pi spectra lie at theoretical m/z values of “naked” azurin anions and their oligomers. They are immediately followed by less intense broader peaks or shoulders due to solvation as well as association with ions from the solution. Much broader unresolved peaks with maxima shifted to higher m/z values are observed in NaCl or NaPi, as discussed below. An interesting effect of the laser intensity on the peak shape and position can be observed when comparing spectra measured under harsh and soft conditions. Increasing the laser intensity makes the peaks broader and more symmetric in shape, and shifts their maxima slightly to higher mass values. This behavior is attributed to attached ions from the buffer and different requirements on the laser energy for bringing molecules with or without attached ions out from the liquid phase. Mostly “naked” protein ions and their oligomers are transferred to the gas phase at ultrasoft and soft intensities, whereas higher laser intensities desorb even those species that are associated with a large number of ions. Opposite behavior was found for detergent-stabilized membrane proteins, whose LILBID peaks sharpen and shift lower toward theoretical masses on going to harsh ionization conditions.9
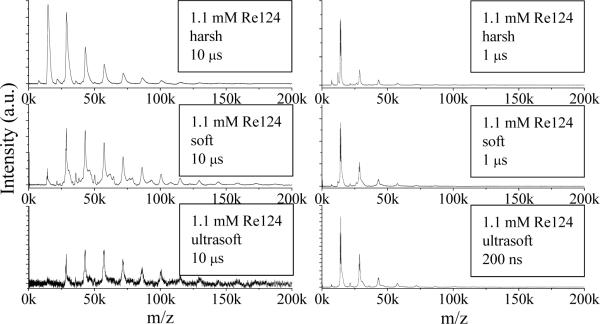
The delay between the laser pulse and the high voltage acceleration pulse is another experimental factor affecting the observed oligomer distribution. Figure 3-right shows spectra measured at short delays (1 μs or 200 ns). An intense monomer peak appears together with weaker peaks of smaller oligomers, whereas broader size distributions are observed at longer delays (10 μs, Figure 3-left), with higher oligomers giving rise to the strongest peaks. Apparently, relatively light monomers escape from the ion acceleration area during long delays, evading detection.
Figure 3.
Effect of the delay between laser and high voltage pulses on LILBID spectra of Re124 in 20 mM NH4Pi buffer under different conditions.
Dependence of the spectra on laser intensity and delay prevents us from quantifying the oligomer distribution at a given solution composition. Nevertheless, LILBID spectra measured at the same instrument setting provide reliable information on the effects of solution composition on oligomerization, as documented by comparable shifts of the distributions to smaller oligomer sizes upon two-fold dilution (observed at three different laser intensities, compare left and right columns of Figure 2). Very similar intensity and delay dependences of LILBID spectra were observed for other labeled and unlabeled azurins, as well as in different media such as pure water, 20–30 mM NaCl or 20 mM NaPi buffer, the latter showing only small differences between the spectral patterns measured under harsh and soft conditions. Representative spectra are shown in Figures S1–5.
Concentration effects on oligomerization
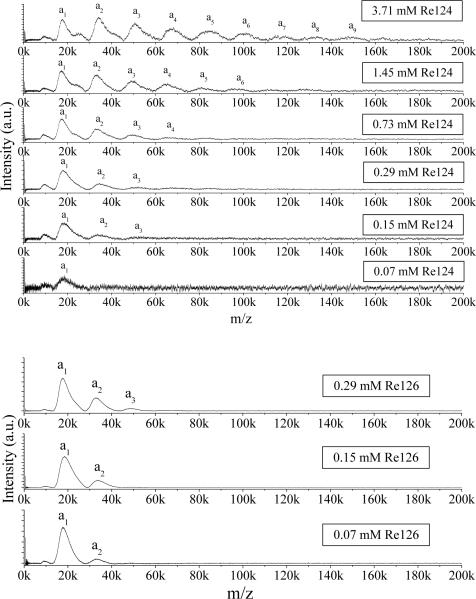
The concentration dependence of Re124 LILBID spectra in 20 mM NaPi buffer is shown in Figures 4 and S6 for soft and harsh conditions, respectively. In addition to a dominant monomer peak in the spectrum measured at the lowest concentration, there is a very weak dimer peak. Upon increasing the concentration, the relative intensities of the peaks attributable to larger oligomers increase, clearly demonstrating the presence of an equilibrium oligomer distribution in solution. No large difference between the oligomer distributions was detected in spectra obtained under harsh and soft conditions, only those measured under harsh conditions show 20–40 times stronger signals. Spectra of all other Re-labeled as well as unlabeled azurins show essentially the same behavior (Figures S6–16). Re126 tends to aggregate at higher concentrations, making the droplet ejection unstable. Hence, only samples with concentrations up to 0.29 mM could be studied (Figures 4, S10). Both harsh and soft Re126 spectra show a distinct dimer peak even at the lowest concentration (0.07 mM), whereas the monomer peak is dominant for all other azurins. A weak trimer peak also is observed in a concentrated (0.29 mM) solution of Re126. For H83 and Re83 at all concentrations, the mass distribution is shifted to smaller oligomers relative to other azurins (Figures S13–16). Two mechanisms can account for the observed shift of the distribution to smaller oligomers upon dilution: first, the usual concentration dependence of the equilibrium composition; and, second, an increasing excess of small ions (Na+, phosphates) over azurin molecules.
Figure 4.
Concentration dependence of Re124 (top) and Re126 (bottom) LILBID spectra in 20 mM NaPi in the soft mode.
Effects of buffer ions
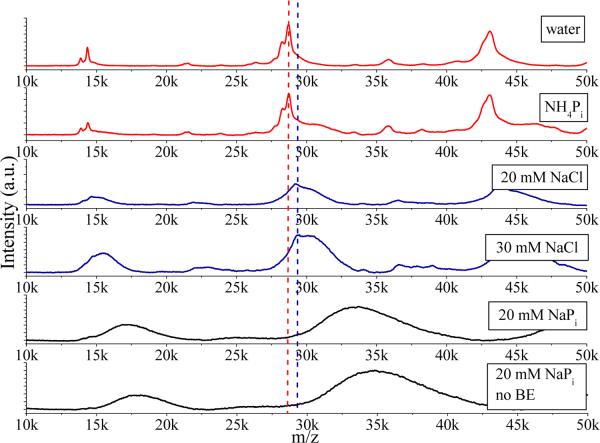
Samples in 20 mM NaPi buffer (Figure 4) give much broader LILBID peaks at higher m/z values than in NH4Pi (Figures 2, 3), indicating azurin association with relatively large numbers of buffer ions. We have made a systematic study of these ion effects, see Figure 5 for soft, and Figure S17 for harsh conditions. Re124 in pure water gives sharp peaks with maxima very close to theoretical m/z values. Peaks in 20 mM NH4Pi are similar. In 20 mM NaCl, the peaks become broader and asymmetric, while their maxima shift toward higher masses. These effects are even more pronounced in 30 mM NaCl. The most profound change occurs on going from water to 20 mM NaPi buffer, where the peaks are broadened further and the maxima shifted typically by about 3 kDa to higher masses from theoretical values. This peak shift, which is common for all the azurins we have examined, is attributed to simultaneous association of protein molecules with both Na+ and phosphate ions, possibly together with water solvation. The mass shift is equivalent to roughly 21 Na2HPO4 “ion pairs” per azurin molecule, or less if the associated ions are solvated. The observed LILBID dependence on the solution composition suggests that the proteins are surrounded by a rather tight ion atmosphere.
Figure 5.
Effects of solution composition on LILBID spectra of 1.1 mM Re124 measured under soft conditions. The vertical lines denote the theoretical position of the dimer (red) and the peak maximum observed in NaCl solution (blue). Re124 was first transferred to water (BE = buffer exchange) and then to the solutions specified in the boxes. The spectrum at the bottom (“no BE”) was measured on a solution made by direct transfer to 20 mM NaPi. Comparison of the two spectra in the bottom panels excludes effects of residual ions from sample preparation.
The LILBID peak maxima of azurin dimers in 20 mM NaPi fall at mass values that are smaller than the double masses of corresponding monomer maxima. The difference is larger under harsh than under soft conditions and is different for each different protein (differences of about 2.9, 1.2 and 1.4 kDa are estimated for Re126, Re124, and Re83, respectively, under soft conditions). The corresponding unlabeled azurins show qualitatively the same behavior, but with smaller magnitude (ca. 0.7 kDa for H126 and H124; 1.5 kDa for H83), and similar effects are seen for higher oligomers. This behavior is attributable to decreased association of dimers and higher oligomers with buffer ions (relative to the monomer), likely due to the large surface area over which the azurin molecules interact with each other. Interestingly, this effect is most pronounced for Re126, which is the only azurin mutant prone to macroscopic aggregation.
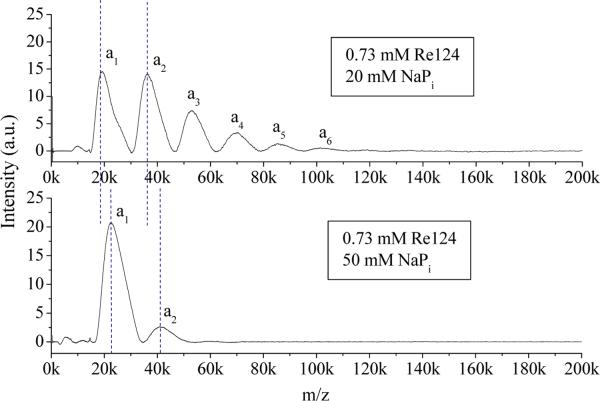
Effects of buffer concentration on azurin oligomerization are depicted in Figure 6. There are three eye-catching differences between the spectra measured in 20 and 50 mM NaPi buffers. The first is the lack of higher oligomers at the higher buffer concentration. The second is the increase of the absolute intensity of the monomer peak on going to 50 mM buffer. Together, both effects show that increasing the buffer concentration weakens interactions between the monomer units, shifting the equilibrium toward smaller oligomers. Shifting the peak maxima (denoted by vertical dotted lines) by ~3.8 kDa toward higher masses is the third striking effect of increasing buffer concentration from 20 to 50 mM. This effect is attributed to greater azurin association with (possibly solvated) buffer cations and anions. Increasing the buffer concentration further is not practical because of LILBID peak broadening and diminishing intensity due to lower ionization efficiency at high ionic strengths.8
Figure 6.
LILBID spectra of Re124 in solutions of different NaPi concentrations. The dotted lines show that the monomer and dimer peak maxima are shifted toward higher masses at the higher buffer concentration. Measurements were made under harsh conditions.
A sample aging effect was observed for Re83 in 20 and 30 mM NaCl: the monomer as well as oligomer peaks broaden by ~40% and slightly (by ~430 Da) shift to higher masses. This behavior suggests that there is slow saturation of azurin association with ions from solution.
Structural effects on oligomerization
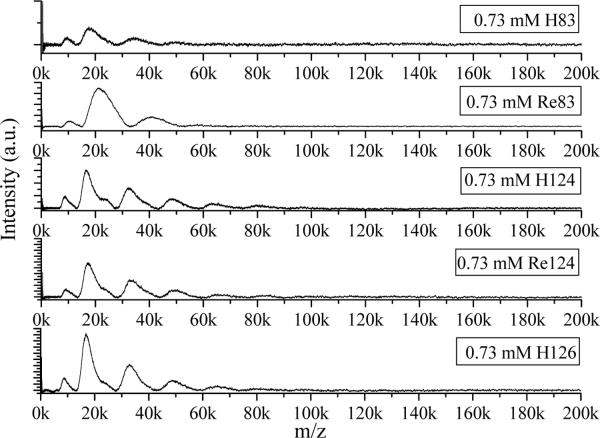
Comparison of the concentration dependences of LILBID spectral patterns in 20 mM NaPi has allowed us to determine the relative oligomerization propensity of azurins. Spectra of mutants Re124, H124, and H126 measured at comparable concentrations at both high and low laser intensities show comparable oligomer distributions (Figure 7). Protein oligomerization is extensive at higher concentrations (>1 mM): even octa- or nonamers are observed, although peaks due to mono-, di-, and trimers are usually the strongest ones at either laser intensity. Spectra obtained at low concentrations (<0.1 mM) consist of monomer peaks and traces of dimer, with the exception of Re126, which exhibits a prominent (although not the strongest) dimer peak at all concentrations in both soft and harsh modes. Re126 is the only azurin prone to form insoluble aggregates. The presence of a dimer peak even at the lowest concentrations and its occurrence at a mass that is significantly less than double the monomer peak mass are the main differences between Re126 and other azurins (H126, Re124, H124). In contrast with findings for the mutant proteins, H83 and Re83 show less extensive oligomerization. Spectra obtained over the entire concentration range and both laser intensities are dominated by the monomer peak, with a small contribution from dimer and trimer (much smaller) at higher concentrations. Spectra obtained at 0.3 mM and lower concentrations essentially show only the monomer. Monomers also prevail in the spectra of Re83 and H83 in 20 mM NH4Pi measured under both harsh and soft conditions (Figure S5), in contrast to mutant spectra that are dominated by dimers and higher oligomers (Figures 2, 3, S3, S4). However, larger oligomers were detected even for Re83 and H83 under ultrasoft conditions, using 10 μs delay.
Figure 7.
Comparison of LILBID mass spectra of azurins measured in 20 mM NaPi under soft conditions.
Nature of protein oligomerization
Based on previous LILBID studies of biomolecular complexes,9,11,37–40 protein oligomerization is expected to manifest itself in soft or ultrasoft spectra by a single predominant peak attributable to a specific oligomer (in most cases there are no oligomers present larger than the specific one). Interestingly, azurins do not exhibit such behavior. Observed distributions do not terminate with a large predominant oligomer. Instead, increases in sample concentration always produce larger oligomers that ones observed at lower concentrations. There is no sign of increasing signal intensity of one of the oligomers and decrease of the others upon increasing the concentration, under either soft or ultrasoft conditions. The only exception is the Re126 dimer, which appears to be the preferred oligomerization state, although the strengths of interactions within the dimer and in higher Re126 oligomers are not significantly different, as can be inferred from the finding that a trimer (rather than a tetramer) is the next member of the distribution.
The similarity in the oligomerization behavior of labeled and unlabeled azurins demonstrates that metallolabels are not involved in self-association of Re-labeled azurins nor are surface histidines (83, 124, 126) in unlabeled ones. In particular, the virtually identical oligomer distribution in H124 and Re124 solutions and the absence of a specific Re124 dimer show that ππ intermolecular stacking between dmp ligands in Re124 crystals41 is not prominent in solution. Re126 is exceptional, since interactions between the Re(CO)3(dmp) unit of one molecule and the peptide chain of another could be responsible for the stability of the dimer observed at very low concentrations in solutions. Involvement of the Re126 metallolabel in self-association is indicated by the aforementioned difference between the dimer LILBID peak mass and double mass of the monomer peak (it is much larger for Re126 than for H126, or for Re124 or Re83). We suggest that Re126 molecules in the dimer interact with each other over a much larger interfacial area than in unlabeled azurin (or in Re124 or Re83). The prevalence of H83 and Re83 monomers in LILBID spectra accords with monomeric structures found in crystals. The more extensive oligomerization of mutants than wild-type H83 and Re83 suggests that replacing lysine at position 122 by tryptophan enhances azurin self-association, most likely attributable to ππ and/or hydrophobic interactions involving W122 indole groups. In more general terms, the observation of equilibrium oligomer distributions that shift gradually with concentration and ionic strength together with the absence of any prominent signal due to a single specific oligomer indicate that protein units are linked together by a multitude of interactions. Diminishing azurin self-association at higher ionic strengths suggests that the interactions between protein molecules are at least partly electrostatic in nature.
Re-label hydrolysis
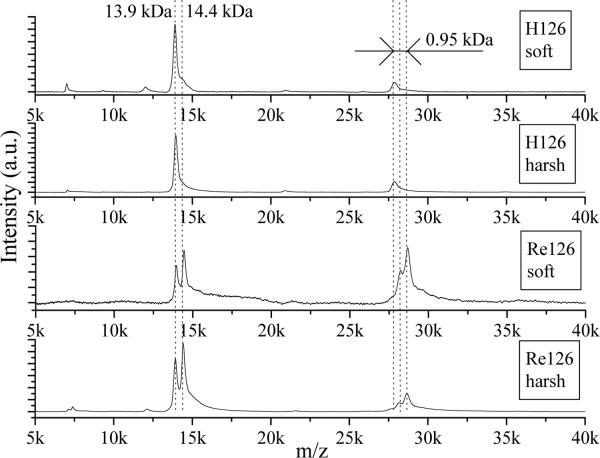
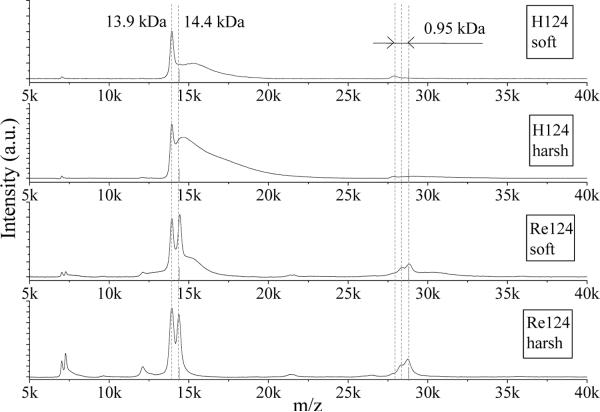
Interesting effects are visible in LILBID spectra of the three Re-azurins in NH4Pi (Figures 8, 9, S18) and in pure water (Figure 5). The monomer peaks of unlabeled samples occur at the expected position (13.9 kDa), as do peaks of each of the oligomers. For labeled samples, the expected monomer peak at 14.4 kDa is accompanied by another peak at 13.9 kDa due to unlabeled protein (the mass difference corresponds to Re(CO)3(dmp), 479 Da). We consider two possible explanations: (1) the Re label partially dissociates from the protein before the measurement is made; or (2) it fragments during the ionization process. We favor (2) based on the following: for Re124 at low intensity, the ratio of monomer peaks is about 50:50 (H:Re); taking this distribution into account, the composition of dimer peaks should be 25:50:25 (HH:HRe:ReRe), but the measured ratio corresponds to about 5:20:75 (HH:HRe:ReRe) (Figures 8, 9), indicating that the label is lost during the ionization process. This conclusion is supported by the absence of peaks due to unlabeled H124 in the electrospray MS spectrum (ESI-MS, Figure S19) of the Re124 sample that was examined in the LILBID experiment. Thermolysis of the Re-N(imidazole) bond during LILBID ionization is highly unlikely in view of our finding that weak interprotein interactions survive. We suggest that Re-label rupture is caused by hydrolysis, whereby a water molecule displaces the histidine imidazole at the Re center. Such a hydrolytic reaction would be strongly accelerated by the sharp temperature increase accompanied by drastic changes in the properties of water upon nonequilibrium transition to the supercritical state. The relative yield of Re-label rupture is independent of laser intensity, although the oligomer distribution of Re126 shifts under harsh conditions toward the monomer (Figure 8). It appears that the extra laser pulse energy under harsh conditions is simultaneously utilized for breaking large oligomers and promoting Re-label hydrolysis. Interestingly, ESI-MS spectra show opposite fragmentation behavior: the Re-azurin bond remains intact during the ionization process, whereas oligomers break down completely. The lack of water activation and its very fast removal during electrospray ionization account for the stability of the Re-azurin bond. On the other hand, rapid desolvation and coulombic explosion of microdroplets during ESI disrupts the electrostatic forces between azurin molecules in oligomers.
Figure 8.
LILBID spectra of H126 and Re126 in 20 mM NH4Pi under soft and harsh conditions. Dashed lines represent expected positions of H126 and Re126 monomers and dimers. Sample concentration ~0.14 mM.
Figure 9.
LILBID spectra of H124 and Re124 in 20 mM NH4Pi at soft and harsh laser intensities. Dashed lines represent expected positions of H124 and Re124 monomers and dimers. Sample concentration ~0.7 mM.
Time-dependent emission anisotropy
Emission anisotropy decay, measured after exciting a population of spatially oriented molecules with a polarized laser pulse, provides information on the rate of molecular rotation. In the case of fluorophore-labeled proteins, anisotropy often decays multiexponentially due to contributions of sub-ns fluorophore movements relative to the protein backbone and slower rotation of the whole molecule.42 The corresponding molecular rotation time θ is related to the molar volume V and, hence, mass M:
| (2) |
where η is the viscosity, the specific volume (~0.75 ml/g) and h stands for hydration.42 In principle, time-dependent anisotropy can distinguish between protein complexes simultaneously present in solution, but only if their sizes are sufficiently different.42,43 In most cases, only an average rotation time is measured, whose value is related to the mean oligomer size. In practice, observed rotation times are often longer than predicted, due to elongated ellipsoidal shapes of protein molecules. On the other hand, smaller values are sometimes observed (e.g. 3.5 ns for 27.3 kDa subtilisin Carlsberg and 2.3 ns for 18.4 kDa myelin basic protein), probably because of coupling between segmental and global protein movements.44 For a 14 kDa azurin monomer, equation 3 estimates θ in the range 5–6 ns, depending on the extent of hydration. Experimentally, a value of 4.94 ns has been reported45 for dilute solutions of wild-type apoazurin by monitoring tryptophan fluorescence anisotropy decay at 320 nm. A longer time, 7 ns, was found at higher emission wavelengths.45,46
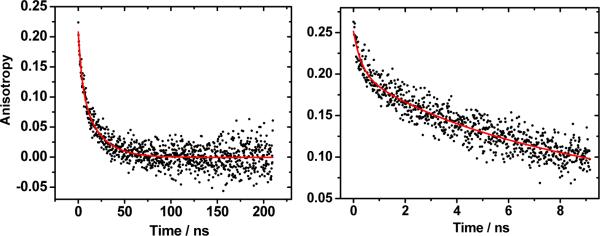
We have determined Re-azurin rotation times by monitoring the time-dependent anisotropy of Re(his)(CO)3(dmp)+ metallolabel phosphorescence (Figure 10, S20). Emission decay lifetimes of about 70, 200 and 400 ns for Re124, Re126, and Re83 are much longer that the ~4 ns fluorescence lifetime of tryptophan and other organic fluorophores. The use of a Re-label as an emission anisotropy probe thus extends the available time range of anisotropy decay measurements from tens to hundreds of ns. However, long emission decays require long experimental accumulation times, since the emitted photons are spread over a very broad range, extending the experiment duration and sample exposure to laser irradiation.
Figure 10.
Emission anisotropy decay of 0.47 mM Re126 in 20 mM NaPi buffer. Left: 210 ns range, 0.21 ns/channel; Right: 9.2 ns range, 11.6 ps/channel.
Typical Re-azurin emission anisotropy decays are shown in Figure 10. The measurement in the 210 ns range (left) was performed to determine the slow molecular rotation, whereas fast segmental movements are more readily observable in the 9 ns range (right). Anisotropy decays in the 210 ns range were fit with bi- and single-exponential kinetics using equation (3)
| (3) |
where θ1 and θ2 are the fast and slow rotation correlation times, respectively, and the ai coefficients are corresponding amplitudes. The initial anisotropy r(0) is defined as a1+a2+c. The residual anisotropy c always was found to be close to zero. The data were also fit using a stretched-exponential47,48 (4):
| (4a) |
| (4b) |
where the exponent β is related to the distribution width (the smaller β, the broader distribution) and <θs> represents the mean integral rotation time. The results are summarized in Table 1. All three ways of fitting are statistically nearly equivalent, the single-exponential fits showing small deviations below ~2 ns. Measurements over a 9.2 ns range with 11.6 ps/channel resolution reveal the presence of an additional fast component θF ≤ 300 ps for Re126 and Re83, attributable42,49 to reorientation movements of the Re(CO)3(dmp) label relative to the protein. No sub-ns anisotropy decay was detected for concentrated (3.7 mM) Re124, while a ≤700 ps component is indicated in 1.86 and 0.37 mM solutions, but with very small amplitude. Initial anisotropies (r(0)) of about 0.2 were determined for Re124, and 0.24–0.27 for Re83 and Re126. Changing the excitation wavelength from 370 to 405 nm has very little effect.
Table 1.
Anisotropy decay times (in ns). Measured in 20 mM NaPi at 21 °C unless stated otherwise. θ was determined from single-exponential fits. θ1,2 and the corresponding amplitudes (in %) are from biexponential fits. r(0) and r(∞) are the initial and residual anisotropy, respectively. Excited at 370 nm, emission decay measured at the band maximum, ~560 nm.
| Conc. | θ | θ 1b | a1 | θ 2 | a2 | r(0) | θ s | β | <θs> | r(0) | |
|---|---|---|---|---|---|---|---|---|---|---|---|
| Re126 | 1.45a | 16.9±0.5 | 3.3±1.9 | 20 | 19.2±1.4 | 78 | 0.22 | 15.0±0.8 | 0.84 | 16.4 | 0.22 |
| 0.96 | 16.3±0.6 | 2.2±1.0 | 25 | 18.7±1.1 | 73 | 0.23 | 13.3±0.9 | 0.78 | 15.4 | 0.22 | |
| 0.47 | 13.6±0.3 | 3.6±1.2 | 29 | 16.7±1.2 | 69 | 0.18 | 11.2±0.6 | 0.78 | 12.9 | 0.18 | |
| 0.10 | 11.1±0.4 | 0.8±0.4 | 29 | 12.5±0.7 | 70 | 0.20 | 8.5±0.7 | 0.75 | 10.1 | 0.19 | |
| 0.47; 50 mM NaPi | 22.4±0.8 | - | - | - | - | 0.13 | 25.0±1.0 | 1.23 | 23.4 | 0.11 | |
| Re124 | 3.71 | 28.8±1.1 | 5.1±4.3 | 18 | 31.5±2.5 | 82 | 0.19 | 25.9±2.2 | 0.75 | 30.8 | 0.21 |
| 1.86 | 20.7±0.8 | 4.9±2.8 | 28 | 24.6±2.6 | 72 | 0.19 | 17.1±1.5 | 0.78 | 19.7 | 0.20 | |
| 0.37 | 12.8±0.6 | 5.1±3.4 | 36 | 16.5±3.5 | 64 | 0.19 | 11.0±1.1 | 0.77 | 12.8 | 0.20 | |
| 1.49; pure H2O | 22.0±1.1 | 3.6±2.0 | 27 | 26.1±2.6 | 71 | 0.22 | 18.2±1.7 | 0.78 | 21.0 | 0.21 | |
| 1.49; 50 mM NaCl | 17.5±0.8 | 4.7±2.3 | 34 | 22.6±3.1 | 66 | 0.21 | 14.1±1.3 | 0.78 | 16.3 | 0.22 | |
| 1.86; 100 mM NaCl | 34.2±1.1 | - | - | - | - | 0.17 | 32.8±1.5 | 0.92 | 34.1 | 0.17 | |
| 1.86; 50 mM NaPi | 30.6±1.7 | - | - | - | - | 0.14 | 34.0±1.8 | 1.32 | 31.3 | 0.12 | |
| Re83 | 1.3 | 8.3±0.3 | - | - | - | - | 0.19 | 7.3±0.4 | 0.85 | 7.9 | 0.21 |
| 0.65 | 8.3±0.2 | - | - | - | - | 0.20 | 8.1±0.3 | 0.95 | 8.3 | 0.20 | |
| 0.13 | 6.5±0.1 | - | - | - | - | 0.22 | 6.1±0.1 | 0.91 | 6.4 | 0.23 |
Different Re126 sample was used.
Values obtained from measurements over a 9 ns range, see Experimental.
Relevant to the oligomerization problem is that part of the anisotropy decay occurring on the nanosecond timescale. The discussion can be based on the single-exponential rotation times θ whose values are very similar to the mean rotation times <θs> obtained from the stretched-exponential fitting. In fact, θ, θs, <θs>, and the “slow” rotation times θ2 of the biexponential fits all depend on the solution composition in the same way, allowing for a consistent interpretation. The ~6 ns rotation time measured for 0.13 mM Re83 in 20 mM NaPi and the near-unity value of the β exponent are consistent with the predominance of Re83 monomer in solution, in agreement with LILBID MS that detected only the monomer at 0.15 mM and below (Figures S13–14). Re126 and Re124 exhibit longer rotation times due to the presence of oligomers. The θ values gradually decrease with decreasing Re-azurin concentration, as the distribution shifts to smaller oligomers. These observations, together with rather low β values (0.75–0.78), support the conclusion based on LILBID data that azurins form broad concentration-dependent oligomer distributions (rather than a single specific larger oligomer, for example, a strongly bound tetra- or pentamer that would exhibit a long concentration-independent rotation time, and β close to unity). For Re83, the rotation time increases on increasing the concentration from 0.13 to 0.65 mM due to the emergence of dimers and trimers, seen by LILBID MS. Further concentration increase to 1.3 mM is accompanied by a drop in β, which suggests widening of the oligomer distribution, and, unexpectedly, by a small decrease in the rotation time. The latter effect could be explained by smaller electrostriction at higher protein concentrations due a smaller excess of buffer ions over the protein. Comparing the values obtained for individual Re-azurins at similar concentrations, it follows that the rotation time increases in the order Re83 < Re126 ≤ Re124, in parallel with an increasing extent of oligomerization determined by LILBID MS. Changing the solution from 20 mM NaPi to pure H2O or 20 mM NaCl has little effect on anisotropy decays. On the other hand, increasing the NaPi concentration to 50 mM leads to rather anomalous behavior of Re124 and Re126 characterized by highly unusual compressed-exponential kinetics (i.e. β > 1), small r(0), and long rotation times. The β larger than one could be due to correlated rotational movement that also would account for the large <θs> value, even if the solution contains mainly monomers, as documented by LILBID MS (Figure 6). Alternatively, the data can be fit using the Becquerel function50r(0)/(1+(α/θB)t)1/α with θB of 22.9±1.6 ns and ~31 ns for Re126 and Re124 and α of 0.09. This behavior would indicate that there is a single predominant slowly rotating oligomer that forms a distribution of species with different extents of association with buffer ions and solvation. In this case, large θ (and θB) values would be attributed to strong association with buffer ions (documented by LILBID, Figure 6) that increases electrostatic friction and hinders molecular rotation. The unusual Re124 and Re126 behavior appears to be related to the presence of W122, since it was not observed either for Re124F122, or for any of the Re-azurins with lysine at position 122.41 Denaturation of Re124 with 4 M GuHCl changes the anisotropy behavior completely: an initial ~4 ns rise is followed by minor ~30 ns and predominant 182 ns decays (Figure S21). This behavior indicates42 the presence of several species with very different population decay times and rotation correlation times.
Concluding remarks
On the methodological side, we have shown that LILBID MS paints an extraordinarily clear picture of the solution behavior of azurins. Importantly, the method should be applicable to many other soluble proteins. LILBID spectra report directly on oligomer distributions as well as ion-association and solvation, although quantification and calculation of oligomerization equilibrium constants are not possible, owing to the dependence of relative signal intensities on experimental conditions. It also is interesting to note the different consequences of LILBID and electrospray ionization: whereas LILBID keeps noncovalent interactions intact but can activate hydrolysis of a metal-ligand bond, ESI breaks oligomers, strips solvent molecules and associated ions, but does not dislodge the metallolabel.
Time-resolved anisotropy experiments demonstrate that labeling proteins with phosphorescent metal-containing chromophores extends the time range over which emission anisotropy decays can be measured, enabling the determination of long rotation correlation times that report42 on protein self-association. In the present case, it was not possible to separate rotation times due to individual oligomers, owing to the very small differences in their sizes and the breadth of the distribution. In addition to oligomerization, rotation times also appear to be influenced by the protein ion atmosphere that slows down molecular rotation at high ionic strengths due to electrostriction.
We have found broad concentration-dependent oligomer distributions of azurins and their Re-labeled derivatives in solutions; notably, each oligomer forms another distribution of species differing in the degree of association with buffer ions. Oligomerization is more pronounced in mutants where the surface lysine is replaced by tryptophan. Labeling with Re(CO)3(dmp)+ has very little effect in the case of Re83 and Re124, but promotes extensive aggregation of Re126 in concentrated solutions (≥1 mM). Moreover, the Re126 dimer is present even at low concentrations and appears to be more stable than other azurin oligomers. With the exception of the Re126 dimer, specifically stabilized oligomers have not been found in azurin solutions, unlike the situation in crystals that often contain specific dimers, trimers and tetramers.15,49,51,52 It follows that crystal structures provide essentially no guidance for prediction of azurin self-association in solution. A case in point is Re124, where crystals contain distinct dimers bound by W122(indole)…Re(dmp)…Re(dmp)…(indole)W122 π-π interactions,41 whereas no preferred dimers are observed in solutions (LILBID spectra are very similar to those of H124). On the other hand, the low oligomerization propensity of Re83 and H83 accords with their occurrence as monomers in crystals. The extent of azurin oligomerization generally decreases with decreasing azurin concentration and increasing NaPi buffer concentration. Oligomerization as well as association with buffer ions should be taken into account when designing azurin-based molecular devices, preparing self-assembled monolayers and interpreting photophysical or electron tunneling data, for it can introduce additional reaction pathways or shield chromophores attached to protein surfaces. We hasten to add that oligomerization likely is not a factor in the biological functioning of azurins, as binding to natural redox partners will easily outcompete the much weaker protein self-association at high ionic strengths in cells.
Supplementary Material
Acknowledgements
Technical support from Mr. H.D. Barth (Frankfurt) is gratefully acknowledged. Funding was provided by the “Cluster of Excellence Frankfurt (CEF) Macromolecular complexes”, Queen Mary University of London, Ministry of Education of the Czech Republic grants ME10124 and LC06063 (J. Sýkora, M. Hof) as well as the European collaboration program COST Action D35. Work at Caltech was supported by NIH (DK019038 to HBG).
Footnotes
Supplementary information available: LILBID spectra of azurins measured at conditions and solutions complementary to those shown in the text, dependences on laser intensity, concentration, effects of solution composition on H124 LILBID under harsh conditions, LILBID spectra documenting Re-label dissociation from Re83, ESI-MS of Re124, emission intensity time profiles of Re83 as a function of emission wavelength, stationary emission spectrum of Re83 and emission anisotropy time profile of denatured Re124. This information is available free of charge via the Internet at http://pubs.acs.org.
References
- (1).Salgado EN, Radford RJ, Tezcan FA. Acc. Chem. Res. 2010;43:661. doi: 10.1021/ar900273t. [DOI] [PMC free article] [PubMed] [Google Scholar]
- (2).Impagliazzo A, Blok AJ, Cliff MJ, Ladbury JE, Ubbink M. J. Am. Chem. Soc. 2007;129:226. doi: 10.1021/ja0659830. [DOI] [PubMed] [Google Scholar]
- (3).Tessier PM, Lenhoff AM. Curr. Opin. Biotechnol. 2003;14:512. doi: 10.1016/s0958-1669(03)00114-9. [DOI] [PubMed] [Google Scholar]
- (4).Janin J, Rodier F. Proteins. 1995;23:580. doi: 10.1002/prot.340230413. [DOI] [PubMed] [Google Scholar]
- (5).Dobson CM. Protein Folding and Misfolding. From Atoms to Organisms. In: Zewail AH, editor. Physical Biology. From Atoms to Medicine. Imperial College Press; London: 2008. p. 289. [Google Scholar]
- (6).Kang SA, Crane BR. Proc. Natl. Acad. Sci. USA. 2005;102:15465–15470. doi: 10.1073/pnas.0505176102. [DOI] [PMC free article] [PubMed] [Google Scholar]
- (7).Fletcher S, Hamilton AD. J. R. Soc. Interface. 2006;3:215. doi: 10.1098/rsif.2006.0115. [DOI] [PMC free article] [PubMed] [Google Scholar]
- (8).Morgner N, Barth H-D, Brutschy B. Austral. J. Chem. 2006;59:109–114. [Google Scholar]
- (9).Morgner N, Kleinschroth T, Barth H-D, Ludwig B, Brutschy B. J. Am. Soc. Mass Spectrom. 2007;18:1429–1438. doi: 10.1016/j.jasms.2007.04.013. [DOI] [PubMed] [Google Scholar]
- (10).Sokolova L, Wittig I, Barth H-D, Schägger H, Brutschy B, Brandt U. Proteomics. 2010;10:1401–1407. doi: 10.1002/pmic.200900756. [DOI] [PubMed] [Google Scholar]
- (11).Morgner N, Zickermann V, Kerscher S, Wittig I, Abdrakhmanova A, Barth H-D, Brutschy B, Brandt U. Biochim. Biophys. Acta. 2008;1777:1384–1391. doi: 10.1016/j.bbabio.2008.08.001. [DOI] [PubMed] [Google Scholar]
- (12).Permyakov E. Metalloproteomics. Hoboken; New Jersey: 2009. [Google Scholar]
- (13).van de Kamp M, Floris R, Hali FC, Canters GW. J. Am. Chem. Soc. 1990;112:907. [Google Scholar]
- (14).van de Kamp M, Silvestrini MC, Brunori M, Van Beeumen J, Hali FC, Canters GW. Eur. J. Biochem. 1990;194:109. doi: 10.1111/j.1432-1033.1990.tb19434.x. [DOI] [PubMed] [Google Scholar]
- (15).Nar H, Messerschmidt A, Huber R, van de Kamp M, Canters GW. J. Mol. Biol. 1991;218:427. doi: 10.1016/0022-2836(91)90723-j. [DOI] [PubMed] [Google Scholar]
- (16).Leckner J, Bonander N, Wittung-Stafshede P, Malmström BG, Karlsson BG. Biochem. Biophys. Acta. 1997;1342:19–27. doi: 10.1016/s0167-4838(97)00074-5. [DOI] [PubMed] [Google Scholar]
- (17).Bramanti A, Pompa PP, Maruccio G, Calabi F, Arima V, Cingolani R, Corni S, Di Felice R, De Rienzo F, Rinaldi R. Japanese Journal of Applied Physics. 2005;44:6864–6866. [Google Scholar]
- (18).Lancaster KM, Yokoyama K, Richards JH, Winkler JR, Gray HB. Inorg. Chem. 2009;48:1278–1280. doi: 10.1021/ic802322e. [DOI] [PMC free article] [PubMed] [Google Scholar]
- (19).Choi J-W, Oh B-K, Kim YJ. Appl. Phys. Lett. 2007;91:263902. [Google Scholar]
- (20).Lee T, Kim S-U, Min J, Choi J-W. Adv. Mater. 2010;22:510–514. doi: 10.1002/adma.200902288. [DOI] [PubMed] [Google Scholar]
- (21).Rinaldi R, Biasco A, Maruccio G, Arima V, Visconti P, Cingolani R, Facci P, De Rienzo F, Di Felice R, Molinari E, Verbeet MP, Canters GW. Appl. Phys. Lett. 2003;82:472. [Google Scholar]
- (22).Yokoyama K, Leigh BS, Sheng Y, Niki K, Nakamura N, Ohno H, Winkler JR, Gray HB, Richards JH. Inorg. Chim. Acta. 2008;361:1095–1099. doi: 10.1016/j.ica.2007.08.022. [DOI] [PMC free article] [PubMed] [Google Scholar]
- (23).Fujita K, Nakamura N, Ohno H, Leigh BS, Niki K, Gray HB, Richards JH. J. Am. Chem. Soc. 2004;126:13954–13961. doi: 10.1021/ja047875o. [DOI] [PubMed] [Google Scholar]
- (24).Khoshtariya DE, Dolidze TD, Shushanyan, Davis KL, Waldeck DH, van Eldik R. Proc. Natl. Acad. Sci. USA. 2010;107:2757–2762. doi: 10.1073/pnas.0910837107. [DOI] [PMC free article] [PubMed] [Google Scholar]
- (25).Farver O, Bonander N, Skov LK, Pecht I. Inorg. Chim. Acta. 1996;243:127. [Google Scholar]
- (26).Farver O, Canters GW, van Amsterdam I, Pecht I. J. Phys. Chem. A. 2003;107:6757. [Google Scholar]
- (27).Farver O, Pecht I. Coord. Chem. Rev. 2011:218. in press, doi:10.1016/j.ccr.2010.08.005. [Google Scholar]
- (28).Shih C, Museth AK, Abrahamsson M, Blanco-Rodriguez AM, Di Bilio AJ, Sudhamsu J, Crane BR, Ronayne KL, Towrie M, Vlček A, Jr., Richards JH, Winkler JR, Gray HB. Science. 2008;320:1760. doi: 10.1126/science.1158241. [DOI] [PubMed] [Google Scholar]
- (29).Langen R, Chang I-J, Germanas JP, Richards JH, Winkler JR, Gray HB. Science. 1995;268:1733. doi: 10.1126/science.7792598. [DOI] [PubMed] [Google Scholar]
- (30).Di Bilio AJ, Hill MG, Bonander N, Karlsson BG, Villahermosa RM, Malmström BG, Winkler JR, Gray HB. J. Am. Chem. Soc. 1997;119:9921. [Google Scholar]
- (31).Skov LK, Pascher T, Winkler JR, Gray HB. J. Am. Chem. Soc. 1998;120:1102. [Google Scholar]
- (32).Crane BR, Di Bilio AJ, Winkler JR, Gray HB. J. Am. Chem. Soc. 2001;123:11623. doi: 10.1021/ja0115870. [DOI] [PubMed] [Google Scholar]
- (33).Di Bilio AJ, Crane BR, Wehbi WA, Kiser CN, Abu-Omar MM, Carlos RM, Richards JH, Winkler JR, Gray HB. J. Am. Chem. Soc. 2001;123:3181. doi: 10.1021/ja0043183. [DOI] [PubMed] [Google Scholar]
- (34).Miller JE, Gradinaru C, Crane BR, Di Bilio AJ, Wehbi WA, Un S, Winkler JR, Gray HB. J. Am. Chem. Soc. 2003;125:14220. doi: 10.1021/ja037203i. [DOI] [PubMed] [Google Scholar]
- (35).Miller JE, Di Bilio AJ, Wehbi WA, Green MT, Museth AK, Richards JR, Winkler JR, Gray HB. Biochim. Biophys. Acta. 2004;1655:59. doi: 10.1016/j.bbabio.2003.06.010. [DOI] [PubMed] [Google Scholar]
- (36).Grădinaru C, Crane BR. J. Phys. Chem. B. 2006;110:20073. doi: 10.1021/jp0644309. [DOI] [PubMed] [Google Scholar]
- (37).Morgner N, Barth H-D, Brutschy B, Scheffer U, Breitung S, Göbelb M. J. Am. Soc. Mass Spectrom. 2008;19:1600. doi: 10.1016/j.jasms.2008.07.001. [DOI] [PubMed] [Google Scholar]
- (38).Hoffmann J, Schmidt TL, Heckel A, Brutschy B. Rapid Commun. Mass Spectrom. 2009;23:2176. doi: 10.1002/rcm.4129. [DOI] [PubMed] [Google Scholar]
- (39).Morgner N, Barth HD, Schmidt TL, Heckel A, Scheffer U, Göbel M, Fucini P, Brutschy B. Z. Phys. Chem. 2007;221:1–16. [Google Scholar]
- (40).Hoffmann J, Aslimovska L, Bamann C, Glaubitz C, Bamberg E, Brutschy B. Phys. Chem. Chem. Phys. 2010;12:3480. doi: 10.1039/b924630d. [DOI] [PubMed] [Google Scholar]
- (41).Blanco-Rodríguez AM, Di Bilio AJ, Shih C, Museth AK, Clark IP, Towrie M, Cannizzo A, Sudhamsu J, Crane BR, Sýkora J, Winkler JR, Gray HB, Záliš S, Vlček A., Jr. Chem. Eur. J. 2011;17 doi: 10.1002/chem.201002162. in press. [DOI] [PMC free article] [PubMed] [Google Scholar]
- (42).Lakowicz JR. Principles of Fluorescence Spectroscopy. 3 ed. Springer; New York: 2006. [Google Scholar]
- (43).Deprez E, Tauc P, Leh H, Mouscadet J-F, Auclair C, Hawkins ME, Brochon J-C. Proc. Natl. Acad. Sci. USA. 2001;98:10090–10095. doi: 10.1073/pnas.181024498. [DOI] [PMC free article] [PubMed] [Google Scholar]
- (44).Lakshmikanth GS, Krishnamoorthy G. Biophys. J. 1999;77:1100–1106. doi: 10.1016/S0006-3495(99)76960-2. [DOI] [PMC free article] [PubMed] [Google Scholar]
- (45).Petrich JW, Longworth JW, Fleming GR. Biochemistry. 1987;26:2711. doi: 10.1021/bi00384a010. [DOI] [PubMed] [Google Scholar]
- (46).Mei G, Gilardi G, Venanzi M, Rosato N, Canters GW, A. FA. Protein Science. 1996;5:2248. doi: 10.1002/pro.5560051111. [DOI] [PMC free article] [PubMed] [Google Scholar]
- (47).Benny Lee KC, Siegel J, Webb SED, Leveque-Fort S, Cole MJ, Jones R, Dowling K, Lever MJ, French PMW. Biophys. J. 2001;81:1265–1274. doi: 10.1016/S0006-3495(01)75784-0. [DOI] [PMC free article] [PubMed] [Google Scholar]
- (48).Berberan-Santos MN, Bodunov EN, Valeur B. Chem. Phys. 2005;315:171–182. [Google Scholar]
- (49).Blanco-Rodríguez AM, Busby M, Ronayne KL, Towrie M, Sýkora J, Hof M, Záliš S, Grădinaru C, Di Bilio AJ, Crane BR, Gray HB, Vlček J,A. J. Am. Chem. Soc. 2009;131:11788. doi: 10.1021/ja902744s. [DOI] [PubMed] [Google Scholar]
- (50).Berberan-Santos MN, Bodunov EN, Valeur B. Chem. Phys. 2005;317:57–62. [Google Scholar]
- (51).Nar H, Messerschmidt A, Huber R, van de Kamp M, Canters GW. J. Mol. Biol. 1991;221:765. doi: 10.1016/0022-2836(91)80173-r. [DOI] [PubMed] [Google Scholar]
- (52).Blanco-Rodríguez AM, Busby M, Grădinaru C, Crane BR, Di Bilio AJ, Matousek P, Towrie M, Leigh BS, Richards JH, Vlček A, Jr., Gray HB. J. Am. Chem. Soc. 2006;128:4365. doi: 10.1021/ja057451+. [DOI] [PubMed] [Google Scholar]
Associated Data
This section collects any data citations, data availability statements, or supplementary materials included in this article.


