

Abstract
Activity-independent and activity-dependent mechanisms work in concert to regulate neuronal growth, ensuring the formation of accurate synaptic connections. CPG15, a protein regulated by synaptic activity, functions as a cell-surface growth-promoting molecule in vivo. In Xenopus laevis, CPG15 enhanced dendritic arbor growth in projection neurons, with no effect on interneurons. CPG15 controlled growth of neighboring neurons through an intercellular signaling mechanism that requires its glycosylphosphatidylinositol link. CPG15 may represent a new class of activity-regulated, membrane-bound, growth-promoting proteins that permit exquisite spatial and temporal control of neuronal structure.
The cpg15 gene was identified in a forward genetic approach designed to isolate activity-regulated genes that mediate synaptic plasticity (1). In the adult rat, cpg15 is induced in the brain by kainate (KA) and in visual cortex by light (2). During development, cpg15 expression is correlated with times of afferent in-growth, dendritic elaboration, and synaptogenesis (2). Sequence analysis predicts a small, secreted protein (2) that is membrane-bound by a glycosylphosphatidylinositol (GPI) linkage (3).
Antiserum generated against bacterially expressed rat CPG15 recognizes a protein from rat brain dentate gyrus extracts (Fig. 1A) (4) of the size predicted by sequence analysis. A protein of similar size is induced in Xenopus laevis after KA injections into the brain ventricle (Fig. 1A) (5). In situ hybridizations using a partial clone of Xenopus cpg15 indicate that the CPG15 mRNA is expressed in retinal ganglion cells and in differentiated neurons throughout the central nervous system (CNS) of stage-47 tadpoles (6). Xenopus CPG15 protein is present in neurons and axons throughout the CNS (7, 8). In the optic tectum, differentiated neurons label in a honeycomb pattern similar to N-CAM (neural cell adhesion molecule) and other cell-surface antigens, while cells in the proliferative zone have undetectable levels of CPG15 (Fig. 1C).
Fig. 1.

CPG15 induction by kainic acid and its expression in Xenopus optic tectum. (A) Immuno-blot of protein extracts from tadpoles harvested at the specified times after intraventricular injection of KA, or rat hippocampus dentate gyri 24 hours after ip injection of KA (right lane). Incubation with the antiserum to CPG15 labels a 12-kD band (arrow) that is not seen with preimmune serum (PI). Confocal images of sections through the optic tecti of untreated tadpoles (B and C) or tadpoles infected with CPG15VV (D and E) or CPG15t3VV (F and G). Sections probed with preimmune rabbit serum show no specific labeling (B). Outlined on this section are the optic tectal neuropil (N), differentiated tectal neurons (TN), and the proliferative zone (PZ). These same regions can be discerned in the sections stained with the antisera to CPG15 [(C), (E), and (G)]. A honeycomb pattern of endogenous CPG15 immunoreactivity can be seen in the TN region of the tectum, and retinal ganglion cell axons are stained in N (C). Sections from animals infected with virus were double-labeled with anti– β-gal to show extent of infection [(D) and (F)] and with anti-CPG15 at higher magnification [(E) and (G)]. In the infected tecti [(E) and (G)], the honeycomb pattern of CPG15 immunoreactivity also extends into the PZ, where many infected neurons are located [(D) and (F)]. Arrows mark retinotectal axons. Bar, 100 μm for upper panel and 50 μm for lower panels.
To investigate the cellular function of CPG15, we used a recombinant vaccinia virus (VV) to express CPG15 in optic tectal cells of albino Xenopus tadpoles (9, 10). Tadpoles were infected by ventricular injection with VV carrying rat cpg15 and β-galactosidase (β-gal) cDNAs in a dual promoter vector, or with a control virus containing only the β-gal cDNA (11). Two days after viral infection and approximately 24 hours after the beginning of expression of foreign protein (9), single tectal cells were labeled with DiI (10, 12). Confocal images through the entire structure of each neuron were collected at 24-hour intervals over a period of 3 days, and three-dimensional (3D) images were reconstructed from this (13).
The most prominent effect of CPG15 on the morphology of tectal projection neurons was that the dendritic arbors of neurons from CPG15VV-infected animals increased their total dendritic branch length (TDBL) and became more complex than arbors of neurons from β-gal–infected or uninfected animals (Fig. 2) (14). This effect was quantified as an increase in averaged TDBL (Fig. 3A) and by Sholl analysis (Fig. 3B).
Fig. 2.
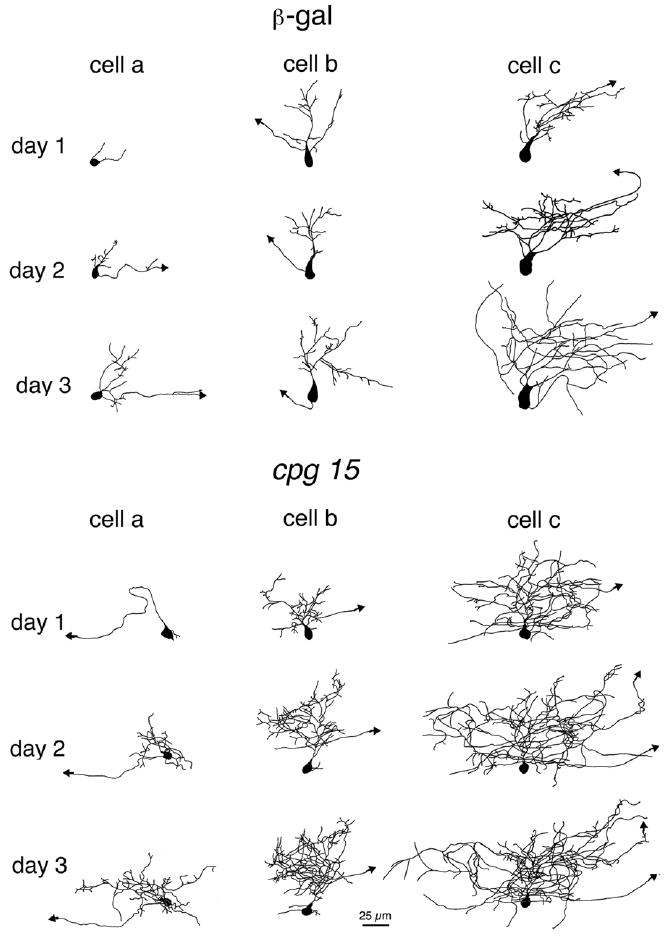
CPG15 promotes dendritic growth in optic tectal neurons. Drawings of 3D reconstructed projection neurons from β-galVV–infected animals (top panel) and CPG15VV-infected animals (bottom panel) imaged over 3 days. The three neurons shown in each group (from left to right) represent the range of neuronal sizes imaged on the first day. Cell a in each panel has the smallest TDBL from all neurons in its group (CPG15 or control). Cell b has a TDBL closest to the mean branch length of each group, and cell c has the largest TDBL in each group. In all three examples, the neurons in the CPG15 group grew faster and developed a more complex dendritic arbor than did their control counterparts.
Fig. 3.

Quantification of CPG15 growth-promoting effect on dendritic arbors. (A) The average TDBL of rostrally projecting CPG15 neurons, β-gal neurons, and uninfected control neurons is plotted over 3 days of imaging. On the first day of imaging, the average TDBL of projection neurons from CPG15VV-infected animals was 447 ± 69 μm (n = 39), significantly larger (P < 0.05) than cells from uninfected (257 ± 31 μm; n = 32) and β-galVV–infected (260 ± 43 μm; n = 22) animals. The disparity in TDBL between cells from CPG15VV-infected and control animals increases on the second day of imaging (14). This difference is maintained on the third day, as both populations continue to grow, at 927 ± 138 μm (n = 24) for CPG15 neurons, compared to 553 ± 53 μm (n = 31) for uninfected and 563 ± 37 μm (n = 19) in β-galVV–infected animals (P < 0.05). (B) Sholl analysis (24) shows that CPG15 increases dendritic arbor density of projection neurons from CPG15VV-infected animals compared to β-galVV controls. Concentric circles with a 10-μm spacing were drawn around the cell body, and the number of intersections of all dendritic branches with the circles was counted. (C) Frequency distribution of projection neuron TDBL values for each day of imaging from animals infected with the CPG15VV, β-galVV, or uninfected controls. For days 1 and 3, respectively, group sizes were n = 39 and n = 24 for CPG15VV, n = 32 and n = 31 for β-galVV, and n = 22 and n = 19 for uninfected. (D) CPG15 increases growth rate of projection neurons while CPG15t3VV slows their growth. The growth rate for projection neurons from β-galVV–, CPG15VV-, or CPG15t3VV-infected animals was determined by subtracting TDBL on day 1 from TDBL on day 2. The growth rate of neurons in CPG15VV-infected animals [308 ± 35 μm/day (n = 39)] was significantly greater (**P < 0.003) than that of β-galVV controls [173 ± 22 μm/day (n = 32)]. In contrast, growth rates of neurons from CPG15t3VV-infected animals [110 ± 24 μm/day (n = 30)] were significantly lower than their β-galVV control counterparts (*P < 0.02).
We measured the distribution of dendritic arbor sizes, expressed as TDBL, within the population of neurons from CPG15VV-infected animals and from control animals (Fig. 3C). All three populations of neurons showed a gradual shift toward larger TDBLs as their dendritic arbors grow. The shift toward larger TDBLs was greatest in neurons from CPG15VV-infected animals. This analysis also demonstrates the presence of a subpopulation of cells in CPG15VV-infected animals that have a greater TDBL than any control cell. These “outliers” can be detected on all three days of imaging and are the most distinctive manifestation of the CPG15 overexpression phenotype.
Interneurons were unaffected by CPG15VV infection (Fig. 4) (14, 15). It is therefore likely that the regulation of interneuron dendritic development is controlled differently from that of projection neurons, perhaps by different molecular participants.
Fig. 4.
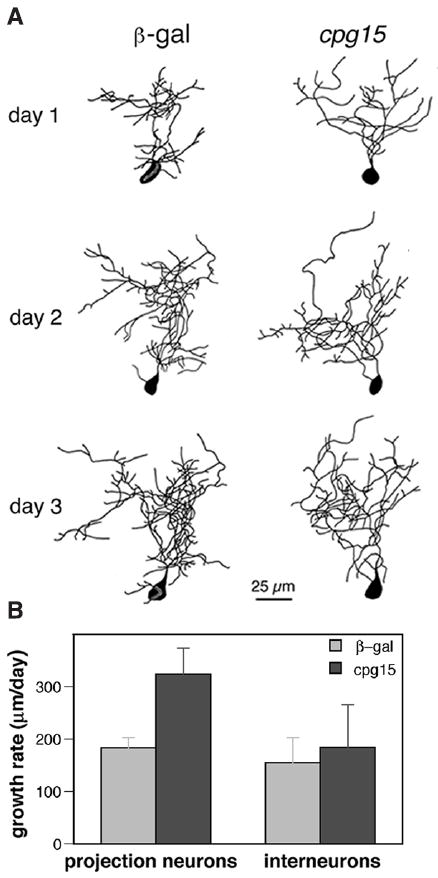
CPG15 does not affect tectal interneurons. (A) Drawings of interneurons from β-gal– infected animals (left) and CPG15VV-infected animals (right) with a TDBL closest to the mean branch length of each group. (B) The growth rate (TDBL on day 2 – TDBL on day 1) is significantly greater (P < 0.01) for CPG15 projection neurons (n = 17) than control neurons (n = 41). Such a difference in growth rate is not seen between interneurons from control 155 ± 48 μm/day (n = 13) and CPG15VV-infected animals 185 ± 81 μm/day (n = 9) (P > 0.7).
To determine whether CPG15 could mediate intercellular signaling, we established experimental conditions in which imaged cells were not likely to be infected with the CPG15VV. Animals were infected with CPG15VV at a lower titer than in previous experiments, imaged in vivo over a 2-day period, then fixed and processed for β-gal immunohistochemistry (16). Because the VV contains a dual promoter vector with the CPG15 cDNA cloned downstream of a strong promoter and the β-gal cDNA driven by the weaker p7.5 vaccinia promoter, β-gal expression served as our marker for infected cells that were also expressing the CPG15 protein. β-gal immunohistochemistry showed that none of the 14 DiI-labeled neurons imaged in this experiment were infected with CPG15VV, probably due to the low infection levels. Three of 14 neurons had TDBLs greater than any control neuron and were therefore outliers. We found that outliers do not need to express CPG15 in order to exhibit an enhanced growth response; however, each one was in close proximity to infected neurons or radial glia (Fig. 5) (14). This demonstrates that the CPG15 growth promoting effect is mediated by a signaling molecule capable of communicating between neighboring cells, possibly CPG15 itself.
Fig. 5.

CPG15 promotes growth through intercellular signaling. (A) A 3D reconstruction of a tectal projection neuron from a CPG15VV-infected animal, with a TDBL of 1684 μm on the first day of imaging (day 1) and 2021 μm on the second day (day 2). This cell is a clear outlier on both days as the largest control cell is 642 μm on the first day of imaging and 1017 μm on the second. (B) Top panel shows a drawing of the tadpole optic tectum (OT) and the tectal ventricle (V) with the marked location of this cell. The green square delineates the region shown in the bottom panel. Bottom panel shows a superimposition of images collected with a 488-nm filter visualizing the DiI-labeled cell imaged in green and images collected with a 647-nm filter visualizing β-gal immunopositive cells in red. The arrow marks the cell imaged in (A).
Database searches do not reveal CPG15-related proteins. The CPG15 amino acid sequence lacks the immunoglobulin G domains common to adhesion molecules (17). CPG15 shows borderline similarity to ligands of the eph subfamily of receptor tyrosine kinases (ephrins) (18). Two of the ephrins—ephrin-A2 (ELF-1; Cek7-L; LERK6) and ephrin-A5 (AL1; RAGS; LERK7)—are anchored to the membrane by a GPI linkage (18, 19) and have been implicated as guidance molecules for topographic mapping of retinotectal projections (20). It appears that these cell-surface–bound ligands are unable to function as soluble factors and require presentation in a membrane-bound form to activate their receptors by direct cell-to-cell contact (21). We noted that CPG15-expressing neurons and glia were located near the uninfected neurons with the CPG15 “outlier” phenotype. To test whether CPG15 requires the GPI linkage for its growth promoting function, we infected tectal cells with a VV containing a truncated version of CPG15 lacking the GPI consensus sequence (CPG15t3VV) (22). CPG15t3VV was expressed in infected cells (Fig. 1, F and G), but failed to promote dendritic arbor growth (Fig. 3D). Indeed, neurons in CPG15t3VV-infected animals have a significantly slower growth rate than neurons from β-galVV–infected animals (*P < 0.02; Fig. 3D). This indicates that CPG15 functions to promote dendritic growth only in its membrane-bound form. Furthermore, the truncated CPG15 inhibits normal dendritic growth in developing neurons. A truncated human homolog of CPG15 (neuritin) was previously reported to promote neuritogenesis in cultured rat hippocampal neurons (3). These qualitative observations may reflect characteristics of the in vitro assay (for example, CPG15t3 immobilization through binding to the polylysine substrate or different response properties of the cultured neurons).
During nervous system development, synaptic activity influences the formation of neuronal connections, in part by controlling axonal and dendritic structure (23). Our studies are consistent with a model in which visual activity induces CPG15, which in turn promotes neuronal growth and structural plasticity. We show that CPG15, an activity-regulated molecule, promotes dendritic growth through intercellular signaling, suggesting that it may function as a ligand. It is intriguing to consider that GPI-linked ligands may function not only as passive positional labels, as in the case of ephrins, but also as activity-regulated growth-promoting signals. As a membrane-bound protein, CPG15 might confer spatial specificity to a growth promoting signal, which may be lacking in secreted factors. As more proteins are discovered that influence neuronal outgrowth in the brain, studies of their functions will enhance the understanding of wiring of neuronal connections and their modification by activity.
Supplementary Material
Acknowledgments
We thank B. Burbach, K. Bronson, I. Miloslavskaya, and N. Dawkins for excellent technical assistance, Z. Li for making the pSC65-CPG15t3 construct, and R. Malinow, K. Svoboda, and J. Yin for critical reading of the manuscript. Supported by NIH (H.T.C. and E.N.), the National Down Syndrome Society (H.T.C.), and the Marie Robertson Fund (E.N.).
References and Notes
- 1.Nedivi E, Hevroni D, Naot D, Israeli D, Citri Y. Nature. 1993;363:718. doi: 10.1038/363718a0. [DOI] [PubMed] [Google Scholar]
- 2.Nedivi E, Fieldust S, Theill L, Hevroni D. Proc Natl Acad Sci U S A. 1996;93:2048. doi: 10.1073/pnas.93.5.2048. [DOI] [PMC free article] [PubMed] [Google Scholar]
- 3.Naeve GS, et al. ibid. 1997;94:2648. doi: 10.1073/pnas.94.6.2648. [DOI] [PMC free article] [PubMed] [Google Scholar]
- 4.Tissue samples from stage 46–48 tadpoles were homogenized as described [Zou D-J, Cline HT. Neuron. 1996;16:529. doi: 10.1016/s0896-6273(00)80072-0.] and size-separated on 15% SDS/tris-glycine gels before electroblotting onto nitrocellulose. Blots were incubated with a 1:100 dilution of unpurified anti-CPG15 or preimmune antisera and developed by ECL (Amersham). Polyclonal antiserum to CPG15 was generated in rabbits by Pocono Rabbit Farm and Laboratory against a FLAG fusion protein (Kodak) expressed in Escherichia coli BL21 and was purified by established methods [Sambrook J, Fritsch EF, Maniatis T. Molecular Cloning: A Laboratory Manual. Cold Spring Harbor Laboratory Press; Cold Spring Harbor, NY: 1989. ].
- 5.KA was injected into the tadpole optic ventricle (50 μM). Intraperitoneal (ip) injection of KA into rats and subsequent removal of hippocampal dentate gyri were done as described (1).
- 6.Nedivi E, Javaherian A, Cline HT. in preparation. [Google Scholar]
- 7.Nedivi E, Cline HT. unpublished data. [Google Scholar]
- 8.Stage 46–48 tadpoles were fixed in 4% paraformaldehyde, and their brains were dissected and cut into 30-μm horizontal cryostat sections. Sections were incubated with preimmune serum or antiserum to CPG15 at a 1: 200 dilution and visualized with fluorescein isothiocyanate–tagged goat anti-rabbit (Sigma). Sections from virally infected animals were double-labeled with antiserum to CPG15 as above and antiserum to β-gal (Sigma) visualized with a Cy5-tagged secondary antibody.
- 9.Wu G-Y, Zou D-J, Koothan T, Cline HT. Neuron. 1995;14:681. doi: 10.1016/0896-6273(95)90211-2. [DOI] [PubMed] [Google Scholar]
- 10.Wu G-Y, Cline HT. Science. 1998;279:222. doi: 10.1126/science.279.5348.222. [DOI] [PubMed] [Google Scholar]
- 11.To prepare CPG15VV, we subcloned a 1-kilobase fragment of rat cpg15 cDNA starting 10 nucleotides upstream of the translation start site into the Sal I–Sma I site of the VV vector pSC-65 downstream from a strong synthetic early/late VV promoter. Virus was generated by homologous recombination and purified as described [Mackett M, Smith GL, Moss B. DNA Cloning: A Practical Approach. IRL Press; Oxford: 1985. ; Pettit DL, Perlman S, Malinow R. Science. 1994;266:1881. doi: 10.1126/science.7997883.]. Purified virus, CPG15VV 108 to 109 plaque forming units), or β-galVV 108 plaque forming units, was mixed with 0.1% Fast Green, and 100 to 150 nl were injected into the tectal ventricle of anesthetized stage 46–48 [Nieuwkoop PD, Faber J. Normal Table of Xenopus laevis (Daudin) Elsevier–North Holland: Amsterdam; 1956. ] albino Xenopus laevis tadpoles. After recovering from anesthesia, animals were kept at room temperature for 2 days, when tectal neurons were labeled and imaging began. β-gal immunohistochemistry showed that levels of infection ranged from 20 to 50% of tectal neurons and that both neurons and radial glia were infected.
- 12.Tectal cells were labeled by DiI iontophoresis [DiIC18(3) or 1,1′-dioctadecyl-3,3,3′3′-tert-methylindocarbocya-nine perchlorate, Molecular Probes; 0.05% in absolute ethanol] using 1 to 10 nA positive current applied in three to five pulses of 1 to 10 ms duration. DiI was injected at different positions along the rostrocaudal axis of the tectum to label cells at a range of developmental stages. Mapping the positions of labeled cells within the tectum during the imaging sessions verified that injection sites for all groups tested were within the same range along the rostrocaudal axis. Viral infections, dye labeling, screening, and imaging were done while animals were anesthetized with 0.02% 3-aminobenzoic acid ethyl ester (MS222, Sigma) in Steinberg’s solution. Animals were screened for those with single or well-isolated brightly labeled tectal cells. The first image of each series was taken 1 to 2 hours after dye labeling.
- 13.Cells were imaged and analyzed as previously described (10). Cell drawings and measurements were done blind to the experimental treatment. Statistical significance was determined by two-tailed t-test.
- 14.Supporting documentation and figures are available via the Science Web site at www.sciencemag.org/feature/data/982664.shl.
- 15.Cells with axons that were observed to exit the tectum were designated projection neurons. Inter-neurons were identified as neurons without an axonal projection exiting the tectum. Distinctions were possible because of the effort made during imaging to confirm the end point of any process extending beyond the range of the dendritic arbor (ambiguous cells were rejected from analysis). A second criterion to identify interneurons was their morphological similarity to previously defined interneurons of two types. One type has a pear-shaped cell body with a dendritic arbor similar to that of projection neurons and a short axon included within the dendritic field (Fig. 4). This type of cell is similar to interneurons described by Antal M, Matsumoto N, Szekely G. J Comp Neurol. 1986;246:238. doi: 10.1002/cne.902460208.. The second type of interneuron is multipolar with a densely branched arbor (14). These cells resemble the T5(3) subclass of large asymmetric ganglionic neurons described as possible interneurons in a framework of lateral inhibition [Matsumoto BN, Schwippert WW, Ewert J-P. J Comp Physiol. 1986;159:721.].
- 16.To identify neurons that were both labeled with DiI and infected with CPG15VV, we labeled cells with chloromethylated DiI (Molecular Probes) and imaged them in vivo, as described above. After two images were obtained (at 24-hour intervals), animals were fixed in 4% paraformaldehyde with 0.1% glutaralde-hyde. Cell morphology was reconstructed from the images collected in vivo. TDBL and growth rate were determined as described (10). For those animals with neurons exhibiting the “outlier” phenotype, brains were dissected and sections were prepared as described (8). Sections were then incubated with monoclonal antibody to β-gal (Sigma) and subsequently with Cy5-tagged goat anti-mouse Fab fragment (Jackson). After immunostaining, the single DiI-labeled cell in each animal was identified, and images of the appropriate sections were collected at dual wavelengths on a Noran confocal microscope equipped with a krypton/argon laser to assess whether the DiI-labeled neurons (visualized at 488 nm) were immunoreactive for β-gal (visualized at 647 nm).
- 17.Brummendorf T, Rathjen FG. Curr Opin Neurobiol. 1996;6:584. doi: 10.1016/s0959-4388(96)80089-4. [DOI] [PubMed] [Google Scholar]
- 18.Pandey A, Lindberg RA, Dixit VM. Curr Biol. 1995;5:986. doi: 10.1016/s0960-9822(95)00195-3. [DOI] [PubMed] [Google Scholar]
- 19.Friedman GC, O’Leary DDM. Curr Opin Neurobiol. 1996;6:127. doi: 10.1016/s0959-4388(96)80018-3. [DOI] [PubMed] [Google Scholar]
- 20.Cheng H-J, Flanagan JG. Cell. 1994;79:157. doi: 10.1016/0092-8674(94)90408-1.; Drescher U, et al. ibid. 1995;82:359. doi: 10.1016/0092-8674(95)90425-5.; Nakamoto M, et al. ibid. 1996;86:755..
- 21.Davis S, et al. Science. 1994;266:816. doi: 10.1126/science.7973638. [DOI] [PubMed] [Google Scholar]
- 22.The CPG15t3VV was prepared similarly to CPG15VV (11) by subcloning a fragment of rat cpg15 cDNA starting at the same site as the CPG15VV insert and extending 355 base pairs until amino acid 115 in the coding region, therefore excluding the CPG15 GPI consensus region.
- 23.Constantine-Paton M, Cline HT, Debski E. Annu Rev Neurosci. 1990;13:129. doi: 10.1146/annurev.ne.13.030190.001021.; Shatz CJ. Neuron. 1990;5:745. doi: 10.1016/0896-6273(90)90333-b.; Goodman CS, Shatz CJ. Cell. 1993;72(suppl):77. doi: 10.1016/s0092-8674(05)80030-3.; Tieman SB, Hirsch HVB. J Comp Neurol. 1982;211:353. doi: 10.1002/cne.902110403.; Katz LC, Constantine-Paton M. J Neurosci. 1988;8:3160. doi: 10.1523/JNEUROSCI.08-09-03160.1988.; Lund JS, Holbach SM, Chung W-W. J Comp Neurol. 1991;309:129. doi: 10.1002/cne.903090109.; Wong ROL, Herrmann K, Shatz CJ. J Neurobiol. 1991;22:685. doi: 10.1002/neu.480220704.; Bodnarenko SR, Chalupa LM. Nature. 1993;364:144. doi: 10.1038/364144a0.; Kossel A, Lowel S, Bolz J. J Neurosci. 1995;15:3913. doi: 10.1523/JNEUROSCI.15-05-03913.1995..
- 24.Sholl DA. J Anat. 1953;87:387. [PMC free article] [PubMed] [Google Scholar]
Associated Data
This section collects any data citations, data availability statements, or supplementary materials included in this article.