Abstract
Six pigeons responded in a visual category learning task in which the stimuli were dimensionally separable Gabor patches that varied in frequency and orientation. We compared performance in two conditions which varied in terms of whether accurate performance required that responding be controlled jointly by frequency and orientation, or selectively by frequency. Results showed that pigeons learned both category tasks, with average overall accuracies of 85.5% and 82% in the joint and selective control conditions, respectively. Although perfect performance was possible, responding for all pigeons fell short of optimality. Model comparison analyses showed that the General Linear Classifier (GLC; Ashby, 1992) provided a better account of responding in the joint control condition than unidimensional models, but a unidimensional model fitted better for the condition that required selective control by frequency. Our results show that pigeons' responding in a visual categorization task can be controlled jointly or selectively by stimulus dimensions, depending on reinforcement contingencies. However, analysis of residuals confirmed that systematic deviations of GLC predictions from the obtained data were present in both conditions, suggesting that an alternative account of responding in multidimensional category learning tasks may be necessary.
Keywords: multidimensional categorization, Gabor patch, General Linear Classifier, optimality, pigeons
Categorization and concept learning have long been among the most widely-studied topics in human experimental psychology (Ashby & Maddox, 2005; Barsalou, 1992; Margolis & Laurence, 1999), and recently have received increasing interest from behavior analysts as well (e.g., Horne, Lowe & Randle, 2004; Miguel, Petursdottir, Carr & Michael, 2008; and the November 2002 special issue of the Journal of the Experimental Analysis of Behavior). Research on categorization with nonhumans has an important role to play in terms of understanding the evolutionary antecedents of this complex human behavior.
A binary categorization task may be regarded as a conditional discrimination in which one of two responses is reinforced depending on whether a prior stimulus is a member of one class or another (Zentall, Galizio, & Critchfield, 2002). In operational terms, categorization occurs when an organism shows generalization within a particular class of stimuli and discrimination between them (Keller & Schoenfeld, 1950), so categorization represents a particular type of stimulus control (Herrnstein, 1990).
One approach to studying categorization in nonhumans has been to examine the ability of subjects to categorize stimuli that are comparable in terms of complexity to those that might be encountered in the natural environment. For example, in a pioneering study, Herrnstein and Loveland (1964) showed that pigeons were able to respond differentially depending on whether or not a photograph projected onto the front panel of an operant chamber contained people or not. Herrnstein, Loveland and Cable (1976) trained pigeons to discriminate pictures with or without trees, water, and a specific person. In all three experiments, stimuli included images that were easy to discriminate with whole or large parts of a person, tree or water and also more difficult images with only small parts or even similar-looking components. Results showed that pigeons were able to classify novel exemplars from each category correctly. Herrnstein et al. concluded that it was unlikely the pigeons used a feature-based strategy to discriminate among the naturalistic categories, and illustrated their point by noting the difficulty of describing features that would reliably discriminate between pictures of a celery stalk and a tree (see Herrnstein et al., Figure 3). Other studies involving complex stimuli have shown that apes can distinguish real objects from their photographs (Davenport & Rogers, 1971), pigeons can distinguish between paintings by Monet and Picasso (Watanabe, Sakamoto, & Wakita, 1995), and California sea lions have the ability to form equivalence classes with arbitrary non-natural figures (Kastak, Schusterman, & Kastak, 2001).
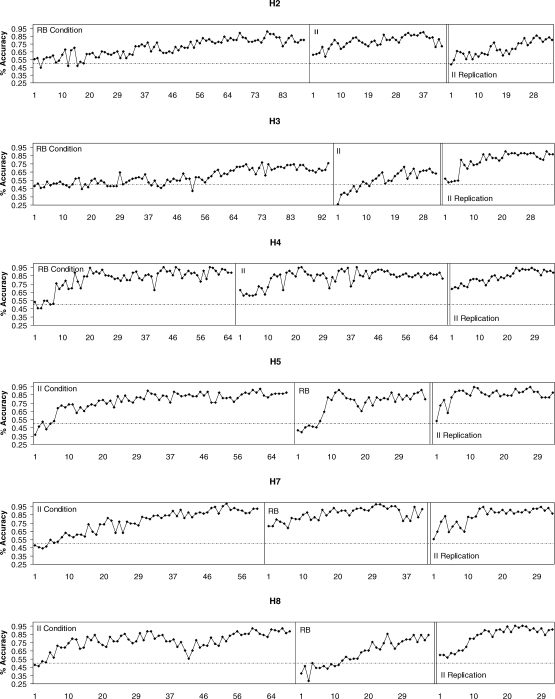
Fig 3.
Percentage of correct responses for each pigeon and session. Data are shown separately for II, RB, and II replication conditions.
At the other extreme of stimulus complexity, considerable research has studied organisms' ability to respond differentially to stimuli that vary quantitatively along a single dimension. For example, a pigeon's response to the left key might be reinforced after a bright light has been presented on a center key, whereas a response to the right key might be reinforced after a dim light (e.g., Davison & McCarthy, 1989). Much of this research has attempted to test predictions of signal detection theory and related models for discrimination (Davison & Tustin, 1978; Davison & Nevin, 1999; White & Wixted, 1999; see Alsop, 2004 for review). Although not usually described as categorization per se, these studies arrange conditional discriminations and to the extent that multiple presentations of nominally the same stimulus are not identical, satisfy the operational definition for categorization (Herrnstein, 1990).
Between the extremes of naturalistic and unidimensional stimuli, there have been few studies on stimulus control and categorization by nonhumans in which stimuli vary quantitatively along more than one dimension. Such research would fill an important gap, and might facilitate the development of more complex and realistic models for discrimination and categorization based on multidimensional stimuli. The goal of the present study is to investigate whether pigeons can respond accurately in a category task with stimuli that vary quantitatively along two dimensions.
There has been considerable research with humans on multidimensional categorization. Ashby and Gott (1988) developed an influential paradigm, known as the randomization procedure, which has been used in many subsequent studies. Their participants categorized L shapes in which the length of the vertical and horizontal segments was generated by sampling from two bivariate normal distributions. In Experiment 1, the average vertical segment was longer than the horizontal for one category, whereas the reverse was true for the other category, so that accurate performance required attention to both dimensions. This category task has been described as ‘information integration’, because subjects must combine values from both stimulus dimensions in order to make a category judgment (Massaro & Friedman, 1990). In Ashby and Gott's Experiment 2, the average vertical segment was longer for one category while the average horizontal segments were the same for both categories, so that attention to only one dimension was required. This task has been described as ‘rule-based’, because when debriefed, subjects can typically describe their performance in terms of a verbal rule.
All participants responded accurately in both tasks, and Ashby and Gott (1988) showed that the General Linear Classifier (GLC; Ashby & Townsend, 1986) provided an excellent account of their data. According to the GLC, participants represent stimuli in a two-dimensional perceptual space and learn, via feedback, a decision bound, which is a line in the two-dimensional space such that stimuli that are located above it are associated with one category while stimuli that are below are associated with the other category. When a stimulus is presented on a trial, the distance from the line determines the probability of a correct response, with accuracy increasing as the stimulus is more distant from the line. Ashby and Townshend showed that the GLC may be viewed as a two-dimensional generalization of signal detection theory (SDT; Macmillan, 2002), with the linear decision bound replacing the unidimensional criterion in classical SDT. Although the GLC is unable to account for results of experiments that have shown that humans can apparently use nonlinear decision bounds (e.g., Ashby & Waldron, 1999), it provides a convenient starting point for investigating how organisms learn two-dimensional ‘information integration’ category tasks in which a linear decision bound is optimal.
Herbranson, Fremouw and Shimp (1999) studied performance of pigeons in a task similar to that used by Ashby and Gott (1988). They trained pigeons to categorize rectangles displayed on a computer screen that varied in terms of height and width and generated by sampling from two bivariate normal distributions. In the Divided Attention condition, accurate performance depended on both dimensions: Rectangles for which the height was greater than the width were likely to belong to Category A, whereas rectangles for which the width was greater than the height were likely to belong to Category B. In a second condition, Selective Attention, accurate performance depended on only one dimension. For example, wide rectangles might belong to one category and narrow to the other, but the height of the rectangles was irrelevant. They found that the pigeons' performances were close to optimal in both tasks.
Although Herbranson et al.'s (1999) results suggest that pigeons are capable of information integration; that is, for their responding to be controlled jointly by two dimensions, such a conclusion requires that their stimuli were composed of perceptually separable dimensions. In the terminology of research on human perception, this means that the rectangles were processed in terms of their height and width as independent dimensions, rather than as unitary wholes (which would imply that height and width were “integral” dimensions; Garner, 1974). But as Herbranson et al. noted, this assumption may be problematic. In a study with humans, Krantz and Tversky (1975) found that similarity ratings for rectangular stimuli did not suggest that height and width were fully separable, and that subjects instead may have perceived differences between rectangles in terms of area and shape. According to Krantz and Tversky, rectangles which are taller than wide may have been perceived as “skinny”, whereas rectangles which are wider than tall may have been perceived as “fat”. Applying this reasoning to Herbranson et al.'s study, the implication is that accurate performance in their Divided Attention condition may not require that the height and width of the rectangles be perceived separately and compared, that is, may not require information integration.
Subsequent research with humans has avoided this problem by using stimuli that have reliably separable and independent dimensions which are measured in different units. For example, studies have used Gabor stimuli, which are computer-generated sinusoidal wave gratings that vary in terms of frequency and orientation modulated by a circular Gaussian filter (Yao, Krolak, & Steele, 1995). With category structures similar to those employed by Herbranson et al. (1999) and Ashby and Gott (1988), research has shown that humans are capable of responding accurately in information integration tasks based on Gabor stimuli (Maddox, Ashby, & Bohil, 2003).
We describe an experiment that investigates whether pigeons can respond accurately in a two-dimensional categorization task using Gabor stimuli that varied in orientation and frequency. We used stimuli and category structures that were based on Maddox et al.(2003), and tested performance in both an information integration (II) condition in which accurate responding required joint control by both dimensions and a condition which required selective control by frequency. Maddox et al. described the latter as a rule-based (RB) condition, because accurate performance can be characterized in terms of a simple rule. Unlike Herbranson et al.'s (1999) study, perfect performance was possible in both conditions because the stimuli from the categories did not overlap. Recently, Smith et al.(2010) have shown that pigeons can respond accurately in both II and RB tasks with Gabor stimuli, and that rates of acquisition were similar. The goals of the present experiment were to study performance in both conditions in detail to determine how performance varied with orientation and frequency, whether the pigeons' performance was optimal, and whether the GLC could provide an adequate account of the results.
METHOD
Subjects
Six pigeons, designated H2, H3, H4, H5, H7, and H8, participated as subjects and were maintained at 85% of free-feeding weight ± 15 g by postsession feedings. They were housed individually and allowed free access to water and grit, in a vivarium with a 12∶12 hr light/dark cycle (lights on at 7:00 a.m.). All were experimentally naïve.
Apparatus
Four operant chambers, 350 mm deep by 360 mm wide by 350 mm high, were used. One wall contained an aluminum response panel in which a VGA 6.4-inch (130 mm wide × 97 mm tall) LCD display with native 640 × 480 resolution was mounted. The LCD display was located 165 mm from the side edge and 230 mm from the bottom floor to center of the screen. Overlaying the LCD screen was a glass panel-mounted resistive touch screen of identical size to the screen with a 4096 × 4096 point array resolution. Screen responses were measured via a USB touch interface (Elo TouchSystems Inc). The displays with touch panels were purchased from Touch Screens Inc, part number MTF064D. There were two vertically aligned response keys on each side of the screen, midway between the edge of the screen and the chamber wall. The keys were 25 mm in diameter, and could be illuminated with five color LED arrays. A force of approximately 0.10 N was necessary to operate each key, and produced an audible feedback click. Centered below the screen was a grain magazine with an aperture (60 mm by 50 mm) 40 mm above the floor. The magazine was illuminated when wheat was made available by a white LED. A houselight was centered above the LCD screen 10 mm from the top of the panel. Chambers were enclosed in a sound-attenuating box, and ventilation and white noise were provided by an attached fan. Event scheduling, data recording, and screen image display was controlled with an IBM®-compatible microcomputer. Chamber keys, grain magazine and all other hardware inputs and outputs were interfaced via a USB module with 24 bits of digital I/O purchased from Measurement Computing (part # USB-1024LS).
Stimuli
The stimuli for the categorization tasks were Gabor patches. Gabor patches are sine wave gratings modulated by a circular Gaussian filter, and vary in terms of frequency and orientation. Sample Gabor patches are shown in Figures 1 and 2.
Fig 1.
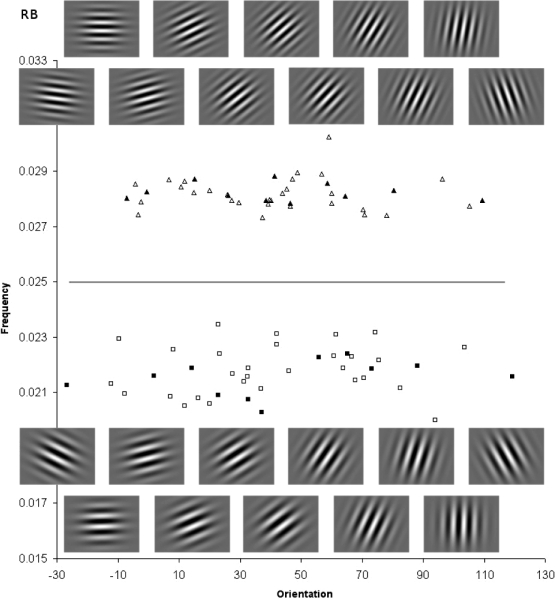
Stimuli for the rule-based (RB) task, including cropped Gabor images for selected exemplars (filled symbols). Category A and B stimuli are represented by triangles and squares, respectively. Orientation and frequency are plotted on the x and y axes, respectively. The solid line represents the optimal decision bound.
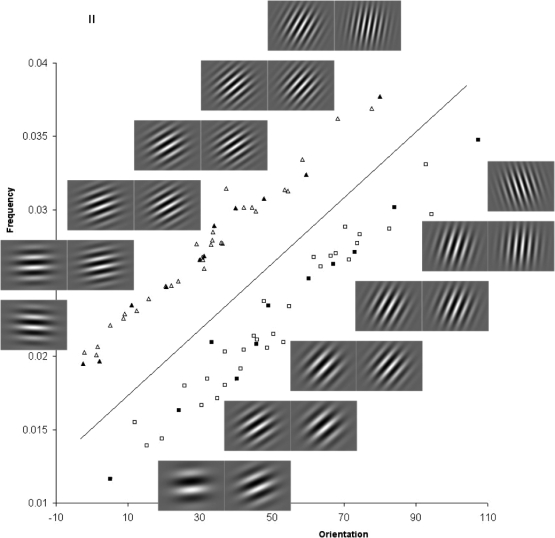
Fig 2.
Stimuli for the information-integration (II) task, including cropped Gabor images for selected exemplars (filled symbols). Category A and B stimuli are represented by triangles and squares, respectively. Orientation and frequency are plotted on the x and y axes, respectively. The solid line represents the optimal decision bound.
Two sets of Gabor stimuli were produced to yield two different types of categorization tasks (Maddox et al., 2003). Each set can be represented in a two-dimensional space with orientation on the x axis and frequency on the y axis. For the RB condition, the optimal decision bound was a horizontal line drawn through the scatterplot (shown in Figure 1), representing a criterial value, such that stimuli with frequencies less than the criterion were assigned to one category, while stimuli with frequencies greater than the criterion were assigned to the other category. The stimuli for the II condition were obtained by rotating the stimuli from the RB condition 45 degrees to the right. The decision bound, scatterplot and 11 Gabor patches from each of the two categories are shown in Figures 1 and 2. Sample Gabor patches are also displayed in figures, which are cropped sample portions from the actual images used in the sessions. These exemplars include the extreme values for each category (i.e., the stimuli in the lower left and upper right of the scatterplot) and also nine intermediate values, spaced approximately equally. The exemplars correspond to the filled symbols in the figures. Means and standard deviations, as well as maximum and minimum values for the stimuli in each category for both the RB and II conditions are shown in Table 1.
Table 1.
Stimulus characteristics for Category A and B in the rule-based (RB) and information integration (II) conditions. Orientation (o) values are in degrees counterclockwise from horizontal and frequency (f) values are in cycles per pixel.
Stimuli were generated as follows: First, for the RB stimuli, random numbers were sampled from a bivariate normal distribution for each of the categories. Forty number pairs (x1, x2) were sampled for each category, defining 40 stimuli in terms of frequency and orientation. The parameters for each category distribution were the same as in Maddox et al. (2003) such that the mean frequency values were different (μ = 340 and 260 for Categories A and B, respectively, with both σ = 8.66) while the mean orientation values were the same (μ = 125; with both σ = 8.66). The II stimuli were generated by rotating the RB stimuli by 45 degrees. After rotation, the stimuli were subjected to a linear transformation so that the grand means (i.e., the averages across both categories) for both dimensions were the same in the II and RB conditions. To accomplish this, 5.98 was added to each frequency value and 245.81 added to each orientation.
For display on the LCD screens (640 × 480 resolution), each number pair was used to generate a stimulus by computing the frequency (cycles/pixel), f = (x1/50+.25)/250 and orientation (degrees counterclockwise from horizontal), o = x2(9/25). These formulas were similar to those used by Maddox et al. (2003), adjusted for the difference in size of display (Maddox et al. used a 1360 × 1024 monitor), and meant to ensure that the salience of frequency and orientation would be comparable for a human observer. For example, the Category A stimulus in the RB condition indicated by the rightmost filled triangle in Figure 1 was obtained by converting the sampled number pair (336.77, 303.77) to a Gabor stimulus with frequency f = (336.77/50 + .25)/250 = 0.0279 cycles/pixel, and orientation o = 303.77(25/9) = 109.36 degrees counterclockwise from horizontal.
Gabor stimuli were generated in real time using custom software. The algorithm used was based on the Gabor Filter (Yao et al., 1995), and was integrated into a C++ program that displayed the images based on a predetermined Comma Separated Values (CSV) file listing of frequency (cycles per pixel) and orientation (degrees).
Procedure
Because subjects were experimentally naïve, they were first shaped to peck yellow circles displayed in the center of the touch screen. They were then trained to peck the two lower right and left side keys using a modified autoshaping procedure. When subjects responded consistently both to the touch screen and keys, training began in the first condition. Sessions occurred daily and at the same time (1100h) with few exceptions. All sessions consisted of 90 trials and sessions were run until stability was reached in each condition.
The sequence of events on experimental trials was as follows. After a 9-s intertrial interval (ITI) during which the chamber was dark, the houselight was illuminated. One second later, the trial began with the display of a Gabor image on the touch screen. The image was maximum possible size that could be shown (640 × 480 pixels) and measured approximately 95 mm high by 125 mm wide. After pigeons had made five responses to the image the screen was darkened and the two lower keys were illuminated (e.g., left key red, right key green), signaling the choice phase. A single response to the correct key produced 3-s access to grain. During reinforcement, all illumination in the chamber was extinguished except for the feeder light. If the response was incorrect, the houselight flashed off and on for 10 s (1 s off, 1 s on), and the trial was repeated with the same Gabor stimulus. After five responses had been made to the screen, only the correct side key was lit and a single response produced 1.5-s access to grain.
Pigeons were exposed to the RB and II conditions in counterbalanced order, followed by a replication of the II condition. The replication was completed after the pigeons had participated in an unrelated experiment (not reported here) involving different Gabor stimuli. Training continued in each condition until the data appeared stable on visual inspection. In the first condition, extended training was given because we wanted to assess the long-term stability of responding given the novel nature of the procedure. The keys assigned to the categories, correct key location and color were counterbalanced across birds and are listed in Table 2, along with the order of conditions and number of sessions of training.
Table 2.
Order of conditions, number of sessions per condition, and key color assignments for individual pigeons.
RESULTS
Figure 3 shows the percentage of correct choice responses for all subjects across the three conditions (II, RB, and II replication) in the experiment. The dashed line indicates chance 50% responding. We continued to run the sessions in the first condition well beyond asymptotic performance due to the novelty of the procedure, and also to ensure that pigeons' responding was stable. All pigeons learned both tasks successfully, in terms of responding at greater than chance accuracy, although differences between the birds' performances were evident. Accuracy was relatively low for Pigeon H3 in the II and RB conditions, but increased in the II replication condition. For the other pigeons, accuracy tended to stabilize at levels between 75% and 85% in each of the conditions. Because perfect performance was possible, this indicates that responding for all pigeons fell short of optimality.
Average accuracies from the last 10 sessions of each condition are reported in Table 3 for each pigeon, as well as the overall average. The averages were 83% (SD = .037), 82% (SD = .049) and 88% (SD = .032) correct for the II, RB, and II replication conditions, respectively. A repeated measures analysis of variance (ANOVA) found that the effect of condition was not significant, F(2,10) = 2.19, p > .15. This suggests that there were no systematic differences in asymptotic accuracy between the conditions.
Table 3.
Average accuracy and number of sessions to reach 75% accuracy for individual pigeons for each condition in the experiment.
To investigate whether different amounts of training were necessary for the pigeons to acquire the II and RB tasks, we defined a post hoc acquisition criterion of an average of 75% accuracy across the last three sessions, and then determined how many sessions were required to reach this criterion, for each pigeon and condition. Table 3 shows the results. Pigeon H3 never reached the 75% criteria in the first two conditions, but did so after 11 sessions in the II replication condition. Averaged across pigeons (omitting H3's data from the first two conditions), 14.40, 22.20 and 12.17 sessions were required to reach 75% accuracy in the II, RB, and II replication conditions, respectively. To compare sessions to criterion across conditions, we conducted a repeated measures ANOVA (omitting the data from H3). The effect of condition was not significant, F(2,8) = 0.78, p > .40. This indicates that there were no systematic differences in rate of acquisition across conditions.
A major goal was to determine whether responding in the II condition was controlled by both stimulus dimensions, while responding in the RB condition was only controlled by frequency. In previous studies with humans, this question has been addressed by determining whether a uni- or multidimensional model provided a better fit to the data (see Maddox & Ashby, 2004, for review). We will adopt this approach, which will also illustrate how GLC is applied to data from this procedure. However, none of the prior human studies have augmented these model comparisons with a detailed assessment of performance, specifically how choice responding varies with orientation and frequency. We report such an assessment below. In all cases, analyses are based on individual-subject data from the last 10 sessions (900 trials) of each condition.
Multidimensional Model (General Linear Classifier)
According to the General Linear Classifier (GLC), which is one of a family of models known as General Recognition Theory (GRT; Ashby, 1988; Ashby & Gott, 1988; Ashby & Townshend, 1986), stimuli are represented in a two-dimensional perceptual space, similar to Figures 1 and 2. The subject learns to associate different regions of the perceptual space with different responses. The two regions in the perceptual space are defined by a linear decision bound. When a stimulus is presented on a given trial, the distance of the stimulus from the decision bound determines the probability of a choice response. Specifically, the decision bound is defined as:
Where X and Y are orientation and frequency, respectively, and δ, γ, and e are constants. When a stimulus X0, Y0 is presented on a trial, the distance of the stimulus from the decision bound is given by:
For h = 0, the probability of responding Category A, p(A) = .50. For h > 0, p(A) > .50 and for h < 0, p(A) < .50. Specifically, p(A) is given as the cumulative normal distribution function (Φ) evaluated at h(X0,Y0):
 |
The denominator of Equation 3 represents the noise or error variance in the model, and includes terms for both perceptual (σ > h2) and criterial variance (σc2). Although other models within GRT can distinguish between perceptual and criterial variance (see Ashby, 1992), for the GLC only a single parameter, σ, is estimated which represents combined perceptual and criterial variance. Effectively, the GLC represents a generalization of signal detection theory to the two-dimensional case (Ashby & Townshend, 1986).
In applying the GLC to data from the present experiment, three parameters must be estimated: the slope and intercept of the decision bound, and the noise parameter, σ. Note that the slope and intercept are defined as −δ/γ and −e/γ, respectively.
Unidimensional Models
Two unidimensional models were also considered. According to the unidimensional-orientation (Uni-O) model, subjects respond on the basis of orientation, but variation in frequency has no effect. The unidimensional-frequency (Uni-F) model is similar except that decisions are based entirely on frequency. These models could be considered as special cases of the GLC in which the decision bound is represented as a straight horizontal line (Uni-F) or straight vertical line (Uni-O) in Figures 1 and 2. Both models have two parameters: a critical value on the particular dimension (Xcrit) and a noise parameter, σ. For stimulus X presented on a given trial, the probability of responding Category A is defined as
Parameter Estimation
Maximum likelihood estimation was used to obtain parameters for the GLC and unidimensional models for individual-subject data. Specifically, parameter values that minimized the negative log-likelihood function were obtained through a two-step process. First, a simulated annealing algorithm (Goffe, Ferrier, & Rogers, 1994) was used to estimate a local minimum, and then parameter estimates were refined using the Broyden-Fletcher-Goldfarb-Shanno (BFGS) method (Avriel, 2003). Initial parameter values were randomly determined. Model predictions and optimization procedures were implemented in a computer program using routines in the open-source TPMATH library and compiled with Free Pascal version 2.0.2 (retrieved on 27 August 2006 from http://www.unilim.fr/pages_perso/jean.debord/tpmath/tpmath.htm and http://www.freepascal.org, respectively). Repeated simulations showed that parameter estimates were stable for all subjects and conditions and did not depend on initial values.
Model Comparison
Model fits for all subjects and conditions were evaluated using the Akaike Information Criterion (AIC; Akaike, 1974). The AIC is a model comparison statistic and defined as
where L is the likelihood function and v is the number of parameters estimated. AIC can be used to compare the adequacy of fits for different models applied to the same data: The model with the lowest AIC value has the best fit. For each data set, Table 4 indicates the best-fitting model by displaying the lowest AIC value in boldface. Table 4 also shows the variance accounted for (VAC) by each model.
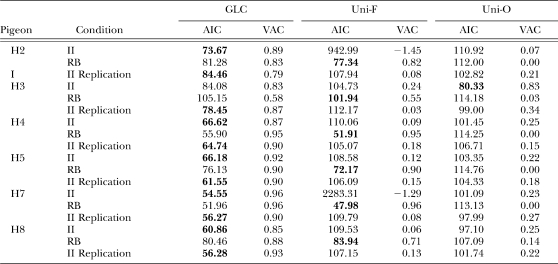
Table 4.
Shown are the Akaike information criteria (AIC) and variance accounted for (VAC) statistics for the General Linear Classifier (GLC), unidimensional frequency (Uni-F) and unidimensional orientation (Uni-O) models when fitted to individual data from each condition. The best-fitting model (i.e., lowest AIC value) in each condition is indicated by boldface.
Results in Table 4 show that for both the original II and replication conditions, the GLC model had the lowest AIC value in 11 out of 12 cases (the exception being H3, original II condition, for which the Uni-O model had the lowest AIC, suggesting that responding was controlled exclusively by orientation). Averaged across subjects, the variance accounted for by the GLC in the original II and replication conditions was 0.89 and 0.88 respectively. This confirms that pigeons' responding was determined by both stimulus orientation and frequency values in the II task (Figure 2).
Table 4 also shows that for the RB condition, the Uni-F model had the lowest AIC value for all subjects. Across subjects, the average variance accounted for by the Uni-F model was 0.81. This shows that when frequency was the only relevant dimension, it acquired primary control over choice responding.
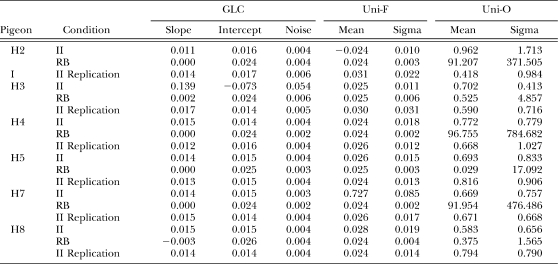
Parameter values for each model are listed in Table 5. Overall, GLC parameter values were reasonably consistent across subjects and replications of the II condition with the exception of H3. Estimates of noise parameters were also similar across replications of the II condition, and in the RB condition.
Table 5.
Model parameters for each of the models when fitted to data from individual pigeon for each condition.
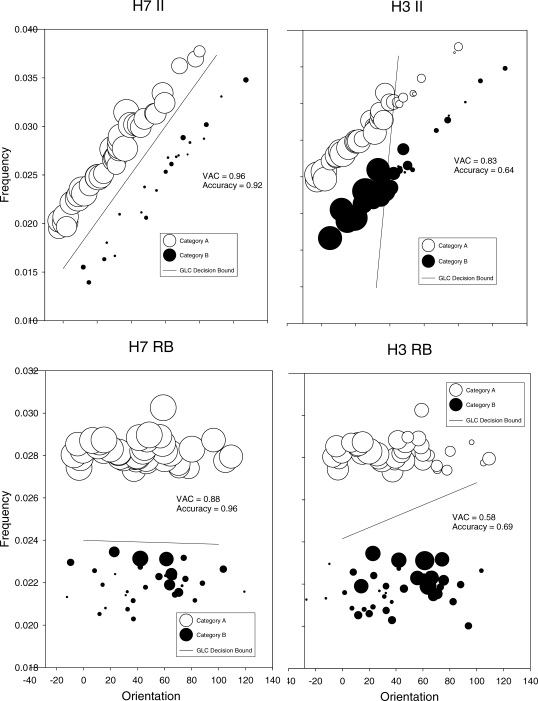
To provide a more concrete illustration of the application of the GLC to the data, Figure 4 shows bubble scatterplots with the estimated decision bounds for selected subjects in the II and RB conditions. We chose those pigeons for which the GLC accounted for the highest and lowest percentage of variance, which were H7 and H3 respectively, in both conditions (see Table 5). In Figure 4, p(A) for each stimulus is indicated by the size of the bubble, and the solid line indicates the inferred decision bound based on the GLC fit. Results for H7 in the II condition (upper left panel) show that the decision bound was close to optimal, approximating the major diagonal (cf. Figure 2). By contrast, the decision bound for H3 in the II condition (upper right panel) had a nearly vertical slope. This indicates that responding for this pigeon was insensitive to frequency and determined largely by orientation, consistent with the model comparison which found that the Uni-O model provided a better fit than the GLC. Note also the preponderance of large bubbles to the left of the decision bound; effectively, H3 responded Category A for stimuli that had relatively low orientation values. For the RB condition (lower panels), responding for H7 was highly accurate (96%) with a decision bound that was again close to optimal (cf. Figure 1). Responding for H3 (right panel) was much less accurate (69%) and the decision bound had a positive slope, caused by the higher accuracy for stimuli with relatively low orientation values. Comparing results for these pigeons, we see that responding for H7 was controlled jointly by two dimensions in the II condition and by one dimension in the RB, resulting in highly accurate performance, whereas responding for H3 showed relatively more control by orientation than frequency in the II condition, and some influence of orientation in the RB condition, giving less accurate performance.
Fig 4.
Bubble scatterplots showing decision bounds inferred from fits of the GLC to individual data from selected subjects in the II and RB conditions. Shown are results for the best (H7; left panels) and worst (H3; right panels) fitting data. Open and filled circles indicate Category A and B stimuli, respectively. The size of the circles shows the probability of a Category A response, p(A). The solid line indicates the decision bound corresponding to the parameters estimated for the GLC (see Table 5).
Thus the model comparison analyses and Figure 4 show how the GLC can provide an account of responding in the II and RB conditions, and be used to address the question of whether responding is controlled by one or two dimensions. For a more detailed understanding of the data, and a more stringent test of whether the GLC is an adequate model for performance in this task, we turn next to an analysis of how asymptotic performance was related to stimulus characteristics.
Detailed Analyses of Asymptotic Performance
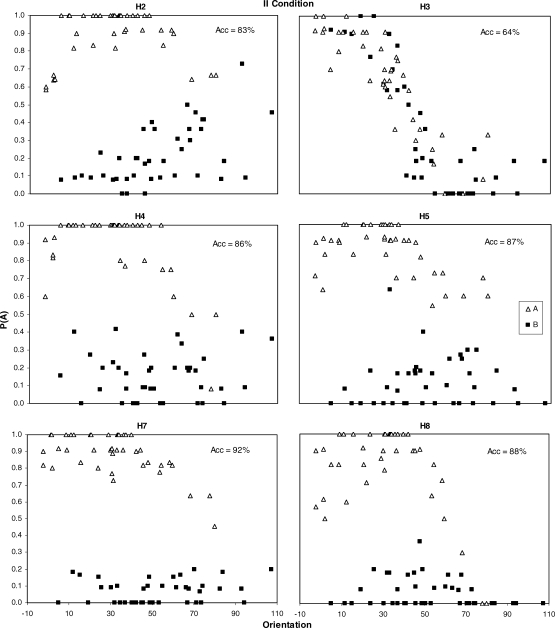
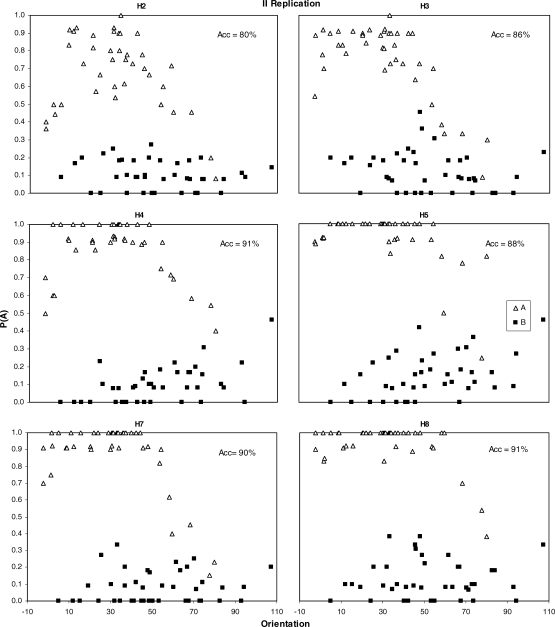
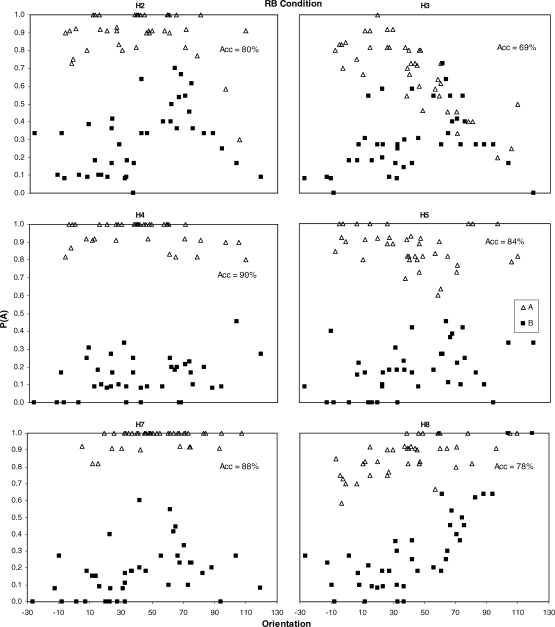
Figures 5 through 7 show the probability of a choice response for Category A as a function of orientation for all subjects in the II, RB, and II replication conditions, respectively. Category A stimuli are indicated by unfilled triangles, and Category B stimuli are indicated by filled squares. The overall accuracy (percentage correct) is also displayed in the upper right corner of each panel. Note that results are shown as a function of orientation only in these figures for sake of economy. Because orientation and frequency were positively correlated in the II conditions, results would look similar if plotted as a function of frequency. For the RB condition, frequency was the relevant dimension and its control has already been established through the model fits; because orientation was irrelevant, plotting the data as a function of orientation should reveal no systematic pattern.
Fig 5.
Probability of a Category A response (p(A); y axis) as a function of orientation (x axis) for the II condition, shown separately for Category A (unfilled triangles) and Category B (filled squares) stimuli. Each panel shows data for an individual pigeon averaged over the last 10 sessions of training.
Fig 7.
Probability of a Category A response (p(A); y axis) as a function of orientation (x axis) for the II replication condition, shown separately for Category A (unfilled triangles) and Category B (filled squares) stimuli. Each panel shows data for an individual pigeon averaged over the last 10 sessions of training.
For the original II and replication conditions (Figures 5 and 7), a systematic pattern of responding was found for Category A. For all subjects, p(A) for Category A stimuli decreased with orientation, and in most cases, also decreased with smaller values of orientation so that an inverted-U shaped pattern was obtained. The implication is that for Category A, accuracy was greater for stimuli that were in the middle of the range of orientations, compared to stimuli with orientations that were near the ends of the range. More variable results were obtained for Category B stimuli. In the majority of cases, there was no systematic relationship between choice responding and orientation. However, for H2 in the original II condition, and H4 and H5 in the replication, p(A) tended to increase with increases in orientation. A similar pattern was obtained for H3, original II condition, consistent with the control by orientation obtained in the model fits (Table 4).
Figure 6 shows p(A) as a function of orientation for the RB condition. For Category A, p(A) decreased at high orientation values for 2 subjects (H2 and H3), increased as orientation increased for H8, and showed no systematic change for H4, H5 and H7. For Category B stimuli, p(A) increased with orientation for H8, and was maximal for midrange orientation values for H2, H3 and H7. Using the separation between p(A) for Category A and B stimuli as a visual proxy for accuracy, Figure 6 shows that accuracy was greater at relatively low-range orientation values compared to midrange (H5, H7), high range (H4), or both mid- and high range values (H2, H3, H8). Thus across subjects there was a trend for accuracy in the RB condition to decrease as orientation increased.
Fig 6.
Probability of a Category A response (p(A); y axis) as a function of orientation (x axis) for the RB condition, shown separately for Category A (unfilled triangles) and Category B (filled squares) stimuli. Each panel shows data for an individual pigeon averaged over the last 10 sessions of training.
Overall, results in Figures 5 through 7 show that performance varied systematically as a function of orientation in both II and RB conditions. Results were most consistent across subjects for Category A responding in the II conditions, for which in every case that accuracy levels were substantial overall (>75%) and the GLC was the best fitting model, indicating that responding was controlled by both dimensions, accuracy was highest for orientations in the middle of the range (∼45 degrees) and decreased as orientation tended to either extreme (0 or 90 degrees). It is important to note that the systematic patterns that were observed were all nonoptimal, in the sense that optimal responding would have shown no within-category trend as a function of orientation, and the observed patterns were associated with decreased accuracy.
The systematic patterns in Figures 5 through 7—especially the inverted-U shaped functions in the II conditions—represent a possible difficulty for the GLC as a model of category learning. Because the stimuli in the II condition were approximately equidistant from the optimal linear decision bound (see Figure 3), it seems unlikely that the GLC could predict that performance should vary systematically as a function of orientation. To assess the adequacy of the GLC more rigorously, we compared predicted and obtained values for GLC fits to individual data, and examined standardized residuals for these fits.
Regression Analyses
In order to test whether there were systematic deviations in the GLC residuals that might correspond to the patterns noted above in Figures 5 through 7, we conducted a series of polynomial regressions. Specifically, we used the orientation and the square of the orientation in a multiple regression to predict the standardized residuals. The orientation values were centered prior to squaring to avoid problems with multicollinearity. This analysis allows us to test the significance of both linear and quadratic relationships in the residuals. Regressions were performed for individual data for all conditions, as well as for the group mean data.
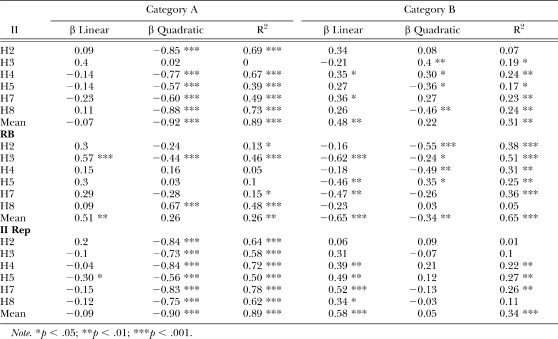
Results of the polynomial regressions are shown in Table 6. For both the II and II replication conditions, the quadratic coefficient for Category A residuals was negative and statistically significant for each subject and the group mean data with the exception of H3, original II condition. This means that a significant negative quadratic trend was obtained in the GLC residuals for each case in which the GLC provided the best fit to the data. This confirms that the GLC is unable to account for the inverted-U shaped pattern evident in Figures 5 and 7. For Category B residuals in the II conditions, linear coefficients were positive for all subjects with the exception of H3, original II condition. The positive linear coefficient was significant for H4 and H7 and the group mean data for the original II condition, and for H4, H5, H7, H8, and the group mean data in the II replication condition. This suggests that GLC predictions for Category B also showed systematic deviations from obtained values, with residuals tending to increase linearly with predicted values.
Table 6.
Results from polynomial regressions of standardized residuals for all pigeons, categories, and conditions. Shown are the beta weights (β) for the linear and quadratic components of the standardized residuals from the GLC fits regressed on the predicted values, and the variance accounted for (R2), for both Category A and B stimuli.
For results from the RB category, linear coefficients for Category A residuals were positive for all subjects, and significant for H3 and the group mean data. For Category B residuals, linear coefficients were negative for all subjects, and were significant for H3, H5, H7 and the group mean data. This suggests that the predictions of the GLC for the RB condition also showed systematic deviations from the data. The signs of the linear coefficients indicate that p(A) values tended to converge for the two categories as orientation increased, consistent with a decrease in accuracy.
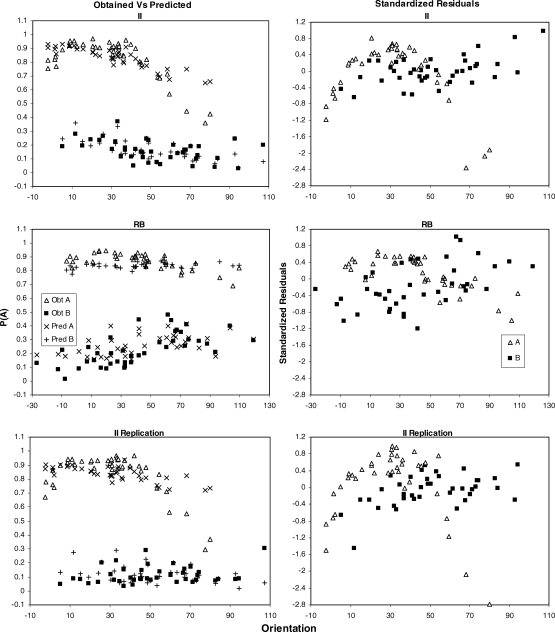
Figure 8 provides a summary of the residual analyses based on the group-mean data. The left panels show the obtained data for Category A and B (unfilled triangles and filled squares, respectively) and GLC predictions (x's and +'s, respectively), whereas the right panels show the standardized residuals for Category A and B (unfilled triangles and filled squares, respectively). Results for the II, RB and II replication conditions are shown in the upper, middle, and lower row of panels, respectively.
Fig 8.
The left column shows obtained probability of a Category A response (p(A); y axis) as a function of p(A) predicted by the General Linear Classifier (GLC; x axis), for the average data from the II condition (upper panel), RB condition (middle panel), and II replication condition (lower panel). Obtained data for Category A and B are shown by unfilled triangles and filled squares, respectively. Predictions of the GLC for Category A and B are shown by x's and +'s, respectively. The right column shows the standardized residuals from the GLC fits (y axis) plotted as a function of orientation (x axis).
Figure 8 clarifies how the GLC has failed to describe systematic features in the current data. The inverted-U shaped pattern that is evident for Category A in the II conditions produces a sharp decrease in p(A) for high values of orientation, to levels below .50. For the GLC to predict this decrease in accuracy for Category A, the slope of the decision bound must increase, so that the upper part of the line in Figure 2 tilts toward the Category A stimuli. But this change in slope means that the decision bound will tilt towards the Category B stimuli for low levels of orientation. This will produce weaker predictions for Category B for low orientation relative to high orientation, which will result in an increase in the residuals for Category B as orientation increases. Thus the significant positive linear coefficients for Category B residuals can be understood, at least in part, as a side effect of the GLC trying to capture the decreasing limb of the inverted-U pattern for Category A. For the RB condition, the GLC is unable to describe the opposing trends evident in the data: p(A) decreases with increases in orientation for Category A but increases for Category B, such that overall accuracy is reduced for high-range orientation values.
The reason that the GLC is unable to describe the patterns observed in both the II and RB conditions is because it predicts that any linear trend in Category A and B predictions must be correlated. This is because such a trend can only be produced by varying the slope of the decision bound. For example, if the slope in Figure 2 decreases, such that predicted p(A) for Category A increases as a function of orientation (i.e., strength of prediction for Category A increases), then predicted p(A) for Category B must also increase (i.e., strength of prediction for Category B decreases). By contrast, if the slope of the decision bound increases, then predicted p(A) for Category A will decrease with orientation, and predicted p(A) for Category B must also decrease. Thus the fundamental failure of the GLC applied to the present data is that it is unable to predict trends in p(A) for Categories A and B as a function of orientation, that are not correlated.
DISCUSSION
The primary goal of this study was to explore the performance of pigeons in a two-dimensional category learning task. The stimuli were dimensionally separable Gabor patches that varied in terms of their frequency and orientation, similar to those that have been used in research on human category learning (Maddox et al., 2003). We examined two conditions, which differed in terms of whether accurate performance required control by both dimensions (information integration; II) or a single dimension (rule based; RB). Results showed that pigeons learned both category tasks, with the average percentage of correct responses of 85.5% and 82% in the II and RB conditions, respectively. Although perfect performance was possible, responding in all conditions fell short of optimality. Model comparison analyses showed that the GLC (Ashby, 1992), which has been used to describe category learning by humans in similar tasks, provided a better account of responding in the II conditions, but a unidimensional model that assumed control only by frequency provided a better account of results from the RB condition. This confirms that pigeons' choice responding was jointly controlled by orientation and frequency, or, expressed in the terminology of human research on category learning, that pigeons can pass an empirical test for information integration based on dimensionally separable stimuli.
Our failure to find optimal performance by pigeons in the present experiment contrasts with results of Herbranson et al. (1999). They found that their pigeons performed nearly optimally when categorizing rectangular stimuli that varied in terms of height and width. In their procedure, stimulus categories were overlapping bivariate normal distributions and perfect performance was impossible. Nevertheless, Herbranson et al. found that performance was close to that predicted by an optimal linear decision bound. There were several procedural differences between Herbranson et al.'s study and the present experiment that might account for the different results. Two have already been mentioned—the use of rectangular stimuli and overlapping category distributions in Herbranson et al.'s study, compared to Gabor stimuli and nonoverlapping category distributions in the present study. However, there is no apparent reason why either of these factors should affect whether performance is optimal. Another possibility is that our task may have been more difficult than Herbranson et al.'s because stimuli from the two categories were closer together in relative terms, that is, variability between categories may have been less than that within categories. To investigate this possibility, we calculated effect sizes for the distance between category centroids for the II condition in both Herbranson et al. and the present study. Specifically, effect size was defined as the Euclidean distance between the centroids of Categories A and B, divided by the pooled standard deviation. For Herbranson et al., the effect size was 3.29, whereas for the present study it was 1.33. This means that the categories in our study, although not overlapping, were arguably closer together than those in Herbranson et al. The implication is that the category tasks in the present experiment may have been more difficult than Herbranson et al., which might account for the suboptimal performance.
The present results also contribute to our understanding of stimulus control. Previous research has tested how different elements of a stimulus acquire control over behavior by examining performance in matching-to-sample tasks in which either a compound stimulus (e.g., white lines superimposed on a red background) or an element (i.e., white lines on a black background, or a red key) is presented as a sample, and elements are presented as choice stimuli (e.g., Maki & Leith, 1973). One finding has been that either element of a compound can control choice responding, but accuracy levels are greater when only elements are presented. These results have been interpreted as evidence for attentional processes in pigeons, that is, that pigeons are capable of attending to either or both elements in a compound (see Zentall, 2005, for review). In behavioral terms, attending refers to behavior, potentially covert, that brings an organism into contact with a particular stimulus or attribute (Nevin, Davison & Shahan, 2005). The II and RB conditions in the present experiment resemble shared and divided attention tasks, respectively. That similar levels of accuracy were achieved in both conditions shows that pigeons' responding can be controlled jointly or selectively, depending on the reinforcement contingencies, by different stimulus dimensions, not just by elements, as shown by previous research.
An unexpected finding was that although the GLC provided a good account of the data overall, with averages of 88% and 85% variance accounted for in the II and RB conditions, respectively, the data deviated systematically from the GLC's predictions. Specifically, we found that the probability of a Category A response, p(A), was an inverted-U shaped function of orientation for Category A stimuli in the II tasks (see Figures 5 and 7). Polynomial regressions on residuals confirmed that deviations from GLC predictions were systematic (see Table 6 and Figure 8), and were also obtained when the II condition was replicated.
Systematic deviations from the GLC predictions were also obtained for the RB condition. Results showed that these were caused by a decreasing trend in accuracy as orientation increased (see Figure 8, middle panels). This trend suggests an interaction between stimulus dimensions such that discriminative control by frequency was better at relatively low (i.e., near horizontal) than relatively high (i.e., near vertical) orientation values. Reasons for this finding are unclear. It appears to challenge the independence predicted by the assumption that orientation and frequency are separable dimensions, but might be attributable to other factors. Future research should test the reliability of this result when stimulus characteristics are varied (e.g., different ranges used for frequency and orientation), and whether a similar interaction is obtained when orientation is the relevant dimension rather than frequency.
The systematic deviations evident in Figure 8 and Table 6 suggest that the GLC is an inadequate model for pigeons' category learning. The inverted-U shaped pattern for Category A stimuli in the II condition may be related to the pigeons' suboptimal performance, because it was associated with decreased accuracy for orientations that were outside the middle range and were close to horizontal or vertical. Exactly why this pattern was obtained is unclear. One possibility is that because the stimuli were normally distributed, those with relatively low or high orientation values were less likely to occur. Thus, the decrease in performance associated with the inverted-U shaped pattern suggests that performance was worse for exemplars which were presented relatively less often. Although this explanation seems reasonable, it remains uncertain why a similar pattern was not observed for Category B. However, the fact that we obtained and successfully replicated the same pattern of results with 6 pigeons suggests that our findings are reliable. An important goal for future research will be to determine whether similar results are obtained with humans responding on II category learning tasks. If so, then a new model for category learning in the information-integration task may be warranted. One possibility is that existing behavioral models for signal detection (e.g., Davison & Nevin, 1999; Davison & Tustin, 1978; White & Wixted, 1999) might be extended to incorporate two stimulus dimensions. Whether this approach might be fruitful is a question for future research.
REFERENCES
- Akaike H. A new look at the statistical model identification. IEEE Transactions on Automatic Control. 1974;16:716–723. [Google Scholar]
- Alsop B. Signal-detection analyses of conditional discrimination and delayed matching-to-sample performance. Journal of the Experimental Analysis of Behavior. 2004;82:57–69. doi: 10.1901/jeab.2004.82-57. [DOI] [PMC free article] [PubMed] [Google Scholar]
- Ashby F. Estimating the parameters of multidimensional signal detection theory from simultaneous ratings on separate stimulus components. Perception & Psychophysics. 1988;3:195–204. doi: 10.3758/bf03206288. [DOI] [PubMed] [Google Scholar]
- Ashby F.G, editor. Multidimensional Models of Perception and Cognition. Hillsdale, New Jersey: Lawrence Erlbum Associates; 1992. (Ed.) [Google Scholar]
- Ashby F.G, Gott R.E. Decision rules in the perception and categorization of multidimensional stimuli. Journal of Experimental Psychology: Learning, Memory, & Cognition. 1988;14:33–53. doi: 10.1037//0278-7393.14.1.33. [DOI] [PubMed] [Google Scholar]
- Ashby F.G, Maddox W.T. Human category learning. Annual Review of Psychology. 2005;56:149–178. doi: 10.1146/annurev.psych.56.091103.070217. [DOI] [PubMed] [Google Scholar]
- Ashby F.G, Townsend J.T. Varieties of perceptual independence. Psychological Review. 1986;93:154–179. [PubMed] [Google Scholar]
- Ashby F, Waldron E. On the nature of implicit categorization. Psychonomic Bulletin & Review. 1999;3:363–378. doi: 10.3758/bf03210826. [DOI] [PubMed] [Google Scholar]
- Avriel M. Nonlinear Programming: Analysis and Methods. Mineola, NY: Dover Publishing; 2003. [Google Scholar]
- Barsalou L.W. Cognitive psychology: An overview for cognitive scientists. Hillsdale, NJ: Lawrence Erlbaum; 1992. [Google Scholar]
- Davenport R.K, Rogers C.M. Perception of photographs by apes. Behaviour. 1971;39:318–320. doi: 10.1163/156853971x00285. [DOI] [PubMed] [Google Scholar]
- Davison M, McCarthy D. Effects of relative reinforcer frequency on complex color detection. Journal of the Experimental Analysis of Behavior. 1989;51:291–315. doi: 10.1901/jeab.1989.51-291. [DOI] [PMC free article] [PubMed] [Google Scholar]
- Davison M, Nevin J.A. Stimuli, reinforcers, and behavior: An integration. Journal of the Experimental Analysis of Behavior. 1999;71:439–482. doi: 10.1901/jeab.1999.71-439. [DOI] [PMC free article] [PubMed] [Google Scholar]
- Davison M.C, Tustin R.D. The relation between the generalized matching law and signal-detection theory. Journal of the Experimental Analysis of Behavior. 1978;29:331–336. doi: 10.1901/jeab.1978.29-331. [DOI] [PMC free article] [PubMed] [Google Scholar]
- Garner W. The processing of information and structure. Oxford, UK: Lawrence Erlbaum; 1974. [Google Scholar]
- Goffe W.L, Ferrier G.D, Rogers J. Global optimization of statistical functions with simulated annealing. Journal of Econometrics. 1994;60:65–99. [Google Scholar]
- Herbranson W.T, Fremouw T, Shimp C.P. The randomization procedure in the study of categorization of multidimensional stimuli by pigeons. Journal of Experimental Psychology: Animal Behavior Processes. 1999;25:113–134. [PubMed] [Google Scholar]
- Herrnstein R.J. Levels of stimulus control: A functional approach. Cognition. 1990;37:133–166. doi: 10.1016/0010-0277(90)90021-b. [DOI] [PubMed] [Google Scholar]
- Herrnstein R.J, Loveland D.H. Complex visual concept in the pigeon. Science. 1964;146( (Whole No. 3643)):549–550. doi: 10.1126/science.146.3643.549. [DOI] [PubMed] [Google Scholar]
- Herrnstein R.J, Loveland D.H, Cable C. Natural concepts in pigeons. Journal of Experimental Psychology: Animal Behavior Processes. 1976;2:285–302. doi: 10.1037//0097-7403.2.4.285. [DOI] [PubMed] [Google Scholar]
- Horne P.J, Lowe C.F, Randle V.R.L. Naming and categorization in young children: II. Listener behavior training. Journal of the Experimental Analysis of Behavior. 2004;81:267–288. doi: 10.1901/jeab.2004.81-267. [DOI] [PMC free article] [PubMed] [Google Scholar]
- Kastak C.R, Schusterman R.J, Kastak D. Equivalence classification by California sea lions using class-specific reinforcers. Journal of the Experimental Analysis of Behavior. 2001;76:131–158. doi: 10.1901/jeab.2001.76-131. [DOI] [PMC free article] [PubMed] [Google Scholar]
- Keller F, Schoenfeld W. Principles of psychology. East Norwalk, Connecticut: Appleton-Century-Crofts; 1950. [Google Scholar]
- Krantz D.H, Tversky A. Similarity of rectangles: An analysis of subjective dimensions. Journal of Mathematical Psychology. 1975;12:4–34. [Google Scholar]
- Macmillan N. Signal detection theory. In: Pashler H, Wixted J, editors. Stevens' handbook of experimental psychology (3rd ed.), Vol. 4: Methodology in experimental psychology. Hoboken, NJ: John Wiley & Sons; 2002. pp. 43–90. (Eds.) [Google Scholar]
- Maddox W.T, Ashby F.G. Dissociating explicit and procedural-learning based systems of perceptual category learning. Behavioural Processes. 2004;66:309–332. doi: 10.1016/j.beproc.2004.03.011. [DOI] [PubMed] [Google Scholar]
- Maddox W.T, Ashby F.G, Bohil C.J. Delayed feedback effects on rule-based and information-integration category learning. Journal of Experimental Psychology: Learning, Memory, & Cognition. 2003;29:650–662. doi: 10.1037/0278-7393.29.4.650. [DOI] [PubMed] [Google Scholar]
- Maki W.S, Leith C.R. Shared attention in pigeons. Journal of the Experimental Analysis of Behavior. 1973;19:345–349. doi: 10.1901/jeab.1973.19-345. [DOI] [PMC free article] [PubMed] [Google Scholar]
- Margolis E, Laurence S, editors. Concepts: Core readings. Cambridge, MA: The MIT Press; 1999. (Eds.) [Google Scholar]
- Massaro D.W, Friedman D. Models of integration given multiple sources of information. Psychological Review. 1990;97:225–252. doi: 10.1037/0033-295x.97.2.225. [DOI] [PubMed] [Google Scholar]
- Miguel C.F, Petursdottir A.I, Carr J.E, Michael J. The role of naming in stimulus categorization by preschool children. Journal of the Experimental Analysis of Behavior. 2008;89:383–405. doi: 10.1901/jeab.2008-89-383. [DOI] [PMC free article] [PubMed] [Google Scholar]
- Nevin J.A, Davison M, Shahan T.A. A theory of attending and reinforcement in conditional discriminations. Journal of the Experimental Analysis of Behavior. 2005;84:281–303. doi: 10.1901/jeab.2005.97-04. [DOI] [PMC free article] [PubMed] [Google Scholar]
- Smith J.D, Ashby F.G, Berg M.E, Murphy M.S, Spiering B.J, Cook R.G, Grace R.C. Pigeons' categorization is exclusively nonanalytic. in press. [DOI] [PMC free article] [PubMed]
- Watanabe S, Sakamoto J, Wakita M. Pigeons' discrimination of painting by Monet and Picasso. Journal of the Experimental Analysis of Behavior. 1995;63((2)):165–174. doi: 10.1901/jeab.1995.63-165. [DOI] [PMC free article] [PubMed] [Google Scholar]
- White K.G, Wixted J.T. Psychophysics of remembering. Journal of the Experimental Analysis of Behavior. 1999;71:91–113. doi: 10.1901/jeab.1999.71-91. [DOI] [PMC free article] [PubMed] [Google Scholar]
- Yao J, Krolak P, Steele C. The generalized Gabor transform. IEEE Transactions on Image Processing. 1995;4:978–988. doi: 10.1109/83.392338. [DOI] [PubMed] [Google Scholar]
- Zentall T.R. Selective and divided attention in animals. Behavioural Processes. 2005;69:1–15. doi: 10.1016/j.beproc.2005.01.004. [DOI] [PubMed] [Google Scholar]
- Zentall T.R, Galizio M, Critchfield T.S. Categorization, concept learning and behavior analysis: An introduction. Journal of the Experimental Analysis of Behavior. 2002;78:237–248. doi: 10.1901/jeab.2002.78-237. [DOI] [PMC free article] [PubMed] [Google Scholar]


