

Abstract
The genes coding for the main molecules involved in the human immune system – immunoglobulins, human leucocyte antigen (HLA) molecules and killer-cell immunoglobulin-like receptors (KIR) – exhibit a very high level of polymorphism that reveals remarkable frequency variation in human populations. ‘Genetic marker’ (GM) allotypes located in the constant domains of IgG antibodies have been studied for over 40 years through serological typing, leading to the identification of a variety of GM haplotypes whose frequencies vary sharply from one geographic region to another. An impressive diversity of HLA alleles, which results in amino acid substitutions located in the antigen-binding region of HLA molecules, also varies greatly among populations. The KIR differ between individuals according to both gene content and allelic variation, and also display considerable population diversity. Whereas the molecular evolution of these polymorphisms has most likely been subject to natural selection, principally driven by host–pathogen interactions, their patterns of genetic variation worldwide show significant signals of human geographic expansion, demographic history and cultural diversification. As current developments in population genetic analysis and computer simulation improve our ability to discriminate among different – either stochastic or deterministic – forces acting on the genetic evolution of human populations, the study of these systems shows great promise for investigating both the peopling history of modern humans in the time since their common origin and human adaptation to past environmental (e.g. pathogenic) changes. Therefore, in addition to mitochondrial DNA, Y-chromosome, microsatellites, single nucleotide polymorphisms and other markers, immunogenetic polymorphisms represent essential and complementary tools for anthropological studies.
Keywords: anthropology, genetic diversity, genetic markers, human leucocyte antigen, human evolution, killer-cell immunoglobulin-like receptors
Introduction: from immunology to anthropology
More than a century has elapsed since the discovery of the ABO blood groups in 1900 by Karl Landsteiner through haemagglutination assays, (see ref. 1 for a review) an event that marked the starting point of immunogenetic studies applied to the analysis of genetic variation in humans. Other antigens of the red blood cells (together with allozymes, through electrophoretic techniques) were successively found and studied in human populations during the first half of the 20th century.2 Molecules that are instrumental in the immune responses of human beings also revealed inter-individual differences such as immunoglobulins, with the discovery of allotypic variation,3,4 and human leucocyte antigen (HLA) molecules,5 with the finding of an unexpectedly high degree of polymorphism at the level of their peptide-binding region (see http://www.ebi.ac.uk/imgt/hla/). Killer-cell immunoglobulin-like receptors (KIR) were also shown to exhibit a complex polymorphism where both the number of alleles and the number of genes may vary among individuals.6
Today, almost 350 severe pathogens are registered on a worldwide scale (Gideon online. Retrieved from http://www.gideononline.com on 20 December 2010) and many others have existed and are now extinct. Each year, seasonal epidemics of influenza remind us that the turnover of most viruses is very rapid. A high level of polymorphism in the genes coding for molecules involved in immune responses is therefore not surprising in light of our exposure to such a diversity of infectious agents, because we know that evolution may easily adapt the genetic pool of populations to specific environmental pressures through natural selection. For example, red blood cell antigens were found to act as receptors for a number of pathogens, (e.g. Plasmodium vivax, for FY, Plasmodium falciparum, for GPA, Toxoplasma gondii, for RH), and hence to play an important role in the susceptibility or resistance of our organism against specific diseases. In the case of FY, the null allele was positively selected in some geographic regions, but not in others, allowing red blood cells to escape P. vivax infection.7 Also, HLA allelic variation may have been maintained through heterozygote advantage, because we know that some HLA alleles are associated with resistance to several fatal diseases, one recent example being the association of HLA-B*27, HLA-B*51 and HLA-B*57 with improved prognosis of AIDS.8
On the other hand, since the very beginning of population genetic applications of such polymorphisms it was observed that their worldwide patterns of genetic diversity tended to exhibit a geographic structure. Population trees generally discriminated populations from different continents, the main controversy being the position of Africans, either segregating with Europeans within an ‘occidental group’ separated from an ‘oriental group’ of Asian, Amerindian and Oceanian populations,9 or segregating separately from the others.10 This observation indicates that natural selection was probably not the only mechanism at work in the evolution of these polymorphisms, but that their patterns of genetic diversity were also shaped by the history of human migrations; hence the increasing interest in using these immunogenetic systems as informative tools to reconstruct human peopling history. Now, after several decades during which researchers have accumulated population data for these polymorphisms and have analysed their variation at different geographic scales, we may ask whether such studies are indeed useful for anthropological research.
The present review summarizes our current knowledge of three major immunogenetic systems, GM, HLA and KIR, in relation to human population diversity studies. These three polymorphisms symbolize the past (GM), present (HLA) and future (KIR) of immunogenetic studies applied to anthropology, both because different typing technologies have been used to analyse their variability (serology for GM; both serology and molecular typing for HLA; and molecular typing for KIR), and because for each system, our understanding of its diversity in human populations is at a different stage (comprehensive for GM; still increasing for HLA; and just starting for KIR). On the other hand, because the three polymorphisms are encoded by independent regions of our genome, are expressed by different kinds of molecules, and are studied in different sets of populations, they provide complementary information for anthropological studies.
Human genetic diversity as revealed by studies of the GM polymorphism
GM polymorphism at the protein and DNA levels
GM allotypes
The GM immunogenetic system was first discovered by Grubb through human serum agglutination studies.3 This system is defined serologically by allotypic variation (allotypes) of the constant domains of the heavy chains of IgG1, IgG2 and IgG3 immunoglobulins. In the 1970s, a total of about 15 GM allotypes were known: G1M 1, G1M 2, G1M 3 and G1M 17 on IgG1; G2M 23 on IgG2; and G3M 5, G3M 6, G3M 10, G3M 11, G3M 13, G3M 14, G3M 15, G3M 16, G3M 21, G3M 24 on IgG3; as well as G1/3M 28, on either IgG1 or IgG3. Although a number of these allotypes were associated with precise substitutions at the DNA level, (see ref. 11 for a review) others were found to be (partly) conformational (i.e. defined by the tertiary structure of the IgG molecule). Therefore, DNA typing could not replace serology. Also, although monoclonal antibodies were used to type some allotypes, most of them could only be tested using specific reagents typically produced by multiple transfused blood donors. Today, as the stock of available reagents is almost depleted, the ‘GM story’ is coming to an end unless precise GM DNA typing becomes possible.
GM haplotypes
The GM haplotypes are combinations of GM allotypes of different IgG sub-classes. As a result of the close linkage, on the long arm of chromosome 14 (14q32.33), of the genes coding for the constant domains of the heavy chains of immunoglobulins (the IGCH genes), the genetic transmission of IgG allotypes occurs through GM haplotype blocks (recombinations occur but are rare). Table 1 lists the most frequent haplotypes found in human populations.4,12 Note, however, that the GM polymorphism was primarily analysed in the 1970s, and GM haplotypes have generally been deduced ‘by hand’ from GM phenotypes because of the absence, at that time, of accurate genotyping techniques and the lack of available frequency estimation programs accommodating ambiguities. Therefore, there has certainly been some bias towards an over-estimation of the frequency of the most frequent haplotypes found in human populations.
Table 1.
Most frequent GM haplotypes in 10 world regions based on the data compiled by Dugoujon et al. (2004)12
| GM haplotypes | Region(s) |
|---|---|
| 1,17 21 | (SSA), NAF, EUR, SWA, NEA, CCA, NCA, SAM, SEA, OCE |
| 1,2,17 21 | (EUR), SWA, NEA, (NCA), SAM, (SEA), (OCE) |
| 3 (± 23) 5* | (SSA), NAF, EUR, SWA |
| 1,17 10,11,13,15,16 | NEA, CCA |
| 1,3 (± 23) 5* | (SWA), SEA, OCE |
| 1,17 5* | SSA, NAF, (SWA) |
| 1,17 23 5* | (OCE) |
| 1,17 10,11,13,15 | (SSA) |
| 1,17 5,6,11,24 | SSA |
| 1,17 5,6,10,11,14 | (SSA) |
5* stands for 5,10,11,13,14.
Bold type indicates a frequency higher than 10% in at least 90% of populations of the corresponding region.
Regular type indicates a frequency higher than 10% in at least 50% of populations of the corresponding region.
Brackets indicate a frequency higher than 10% in at least 20% of populations of the corresponding region.
SSA, Sub-Saharan Africa; NAF, North Africa; EUR, Europe; SWA, Southwest Asia; SEA, Southeast Asia; NEA, Northeast Asia; OCE, Oceania; NCA, North and Central America; SAM, South America; CCA. Circum-Arctic.
GM diversity in modern human populations
GM haplotype frequencies worldwide
The GM haplotypes have proven to be very useful for anthropology. There are striking differences in GM haplotype frequencies among populations from different geographic areas.4,12 If the highest resolution level is omitted (i.e. haplotypic subdivisions on the basis of the presence/absence of allotypes G2M 23 and G1/3M 28, which have seldom been tested at the global level), very high frequencies are found for GM 3 5* (where 5* stands for 5,10,11,13,14) in Europeans, North Africans and Southwest Asians, GM 1,17 5* in sub-Saharan Africans and some North Africans, GM 1,3 5* in Southeast Asians and some Oceanian populations, GM 1,17 21 in Europeans, Northeast Asians, Amerindians and some Oceanian populations (and sometimes in other regions), and GM 1,2,17 21 in Northeast Asians and South Amerindians (Table 1). G2M 23 further subdivides haplotype GM 3 5* in two sub-haplotypes, GM 3 (–23) 5* and GM 3 23 5*, with variable frequencies in Europe. In sub-Saharan Africa, GM 1,17 5* (without G2M 23) seems to be predominant (as far as G2M 23 has been tested). In Asia GM 1,3 23 5* is the most frequent form. Some Papuan populations from New Guinea and Australian Aborigines exhibit haplotype GM 1,17 23 5*, thereby differing from GM 1,17 (-23) 5*, which is frequently found in Africa. Other haplotypes are principally found at regional levels, like GM 1,17 5,6,11,24, GM 1,17 5,6,10,11,14 and GM 1,17 10,11,13,15 in sub-Saharan Africa (the latter being frequent in the Khoisan), and GM 1,17 10,11,13,15,16 in Northeast Asian and Circum-Arctic populations. However, most haplotypes are found at low frequencies in different geographic regions. For example, GM 1,17 21 and GM 1,2,17 21 are universal (although with variable frequencies), and GM 1,17 5* is commonly observed in populations with different origins.
Patterns of GM genetic variation worldwide
As suggested above, some GM haplotypes exhibit their highest frequencies in the most outlying regions of each continent (e.g. western and southern sub-Saharan Africa, northwestern Europe, southeastern Asia), whereas genetic profiles with intermediate frequencies for several haplotypes are observed in central or connecting regions like East Africa and the Near-East. This suggests that human peopling history occurred in a centrifugal manner, i.e. from central to peripheral regions, with a loss of diversity through isolation by distance.12 This scenario is suggested by Fig. 1 (a multidimensional scaling analysis of 82 populations, data compiled in ref. 12) where a continuous pattern of genetic variation is clearly visible, and is fully compatible with the spread of modern humans towards different continents from a central region including East Africa and the Near East.
Figure 1.
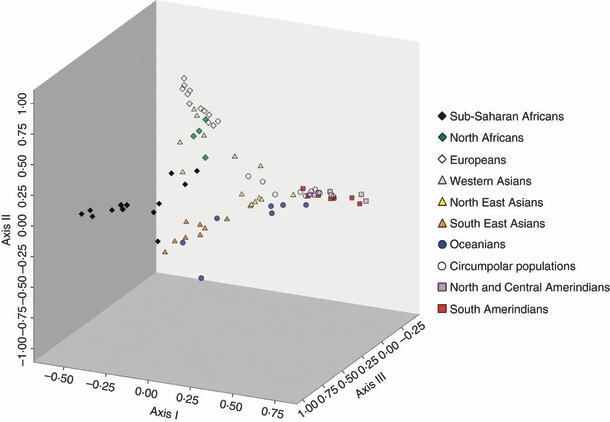
Multidimensional scaling analysis (MDS) of 82 populations from all continents tested for the GM polymorphism. Each point represents a population and its symbol its geographic region. Populations are arranged in a three-dimensional space that best reproduces the observed genetic distances. The orientations of the axes are arbitrary, and their scales are relative to each other. The fit to the original genetic distance matrix is measured by a Stress value (from 0.4 = poor to 0.0 = perfect). Data are from Dugoujon et al. (2004). Stress value = 0.158 (good).
GM genetic differentiations in Africa
Besides this general finding at the global level, the study of the GM polymorphism has brought significant results at regional levels. In Africa, linguistics is a better predictor of the GM genetic structure of populations than geography: variation of GM haplotypes is clearly observed among populations whose languages belong to different linguistic phyla of this continent; i.e. Afro-Asiatic (AA), Nilo-Saharan (NS), Niger-Congo (NC) and Khoisan (KH).13–15 It is therefore likely that the spread of populations speaking languages from each of these families had a significant impact on the patterns of GM genetic variation in Africa. In particular, the demographic and geographic expansion of the NC-speaking Bantu started in a region located between present Nigeria and Cameroon and expanded southward during the last 3000 years. Bantu people may have ‘pushed’ KH populations further south compared with the large area previously occupied by the KH populations, which extended from northeast to southern Africa. Despite documented gene flow between Bantu and KH populations, the genetic profiles (here, for the GM polymorphism) observed in KH show that they retained an ancient genetic diversification. Interestingly, KH populations exhibit moderate frequencies for one haplotype, GM 1,17 21, which is frequent in East Africa but rarely found elsewhere in sub-Saharan Africa, indicating that KH and East African populations share ancient relationships. The other African linguistic groups also exhibit a genetic profile compatible with linguistic classification: West Africans, whose languages belong, like Bantu, to the NC family, are genetically similar to Bantu, with very high GM 1,17 5* frequencies; also, AA populations from East Africa exhibit higher frequencies of GM 1,17 21 and GM 3 5* than other sub-Saharan African populations, which makes them closer than the other groups to populations from AA-speaking populations from North Africa and the Near-East. It is also relevant that AA are the most diversified populations from Africa (in terms of internal diversity estimated by heterozygosity), indicating that they may have undergone an ancient demographic expansion in the past, as suggested on the basis of mitochondrial DNA (mtDNA) analyses.16 Finally, the few NS populations that have been tested for GM are almost monomorphic for haplotype GM 1,17 5*. This represents an extreme differentiation compared with NC, which is explainable by rapid genetic drift through isolation. Actually, NS populations are spread discontinuously over a vast geographic area extending from East (Ethiopia) to West (Mali) Africa throughout the Sahara Desert, and may have been submitted to repeated episodes of demographic contraction and gene flow with local neighbours, depending on climatic variation, which extensively modified the environments.
GM genetic differentiations in East Asia
Variation of GM has also been highly informative for anthropological studies in East Asia. A north–south genetic cline is clearly observed, with high frequencies of GM 1,17 21 and GM 1,2,17 21 and low frequencies of GM 1,3 5* in the north, the reverse situation being observed in the south. Here again, the linguistic information is relevant: we observe continuous genetic differentiations between (from one end of the cline to the other) Altaic, Japanese and Korean; North Tibeto-Burman; Northern Chinese (all Mandarin but Southeastern); Wu and Southeastern Mandarin; Southern Chinese and Southern Tibeto-Burman; and Austro-Asiatic, Tai-Kadai and Austronesian populations.17,18 However, contrary to the situation found in Africa, in East Asia the linguistic families are found in specific geographic areas and it is hard to establish whether the observed genetic patterns have mostly been shaped by linguistic or by geographic differentiations in the past. As discussed in more detail below for the HLA polymorphism, GM genetic variation is compatible with the ‘pincer’ model of migrations from West Asia, suggesting that some populations followed a southern (maybe coastal) route through India to Southeast Asia, and others a route north to the Himalaya Mountains to Northeast Asia (although at a different period), both groups of populations later intermixing through north–south migrations in East Asia. As for HLA, a higher level of internal diversity (higher heterozygosity) is observed in Northeast Asia compared with Southeast Asia, indicating higher levels of gene flow, whereas Southeast Asian populations may have undergone rapid differentiation through genetic drift.19
Another crucial example pertains to the peopling history of Taiwan. In a previous study, we investigated the GM polymorphism of several Aboriginal populations from this island (Siraya, Pazeh, Taroko, Atayal, Tsou, Bunun and Puyuma, as well as Yami located in Lan-Yu island off the southeastern coast of Taiwan).20 We found a decrease in heterozygosity from (north)western to southern and southeastern regions (with a higher frequency of GM 1,3 (–23) 5* in the west, whereas GM 1,3 23 5* is (almost) fixed in the south and/or southeast). This is congruent with the linguistic hypothesis of Taiwanese peopling history proposed by Sagart (including archaeological evidence),21 where Neolithic farmers cultivating both rice and millet settled in Taiwan some 5500 years ago and spread to the south and southeast along the coast.
Evolutionary interpretation: human migrations history versus selection
As described above, one remarkable result of the analysis of the GM polymorphism is the observation of abrupt frequency changes between different continental areas worldwide. By subdividing the world into 10 continental or sub-continental regions (sub-Saharan Africa, North Africa, Europe, West Asia, Northeast Asia, Southeast Asia, Oceania, Circum-Arctic, North and Central America, and South America), we found a proportion of genetic diversity due to differences among regions of about 39%.12 This is much higher than generally found (albeit based on a different subdivision of the world and different numbers of groups) for allozymes and DNA markers, of the order of 10–15%,22–24 and 3–7% for most HLA loci.25 Extreme values (up to 88%) of human genetic diversity among the main geographic regions have only been found for strongly selected biological traits like skin pigmentation, whereas craniometric traits also fall within the range of neutrally evolving genetic markers.26,27 We may ask ourselves whether, because of the immunological function of IgG molecules expressing GM allotypes, the GM polymorphism is subject to some kind of (directional) selection. Indeed, some studies have suggested that GM haplotypes were involved in susceptibilities to autoimmune diseases (see ref. 28,29 for a review) and infectious diseases like malaria30–32 or filariasis.33 However, conclusive evidence for disease associations has not been found. Moreover, we did not detect any departure from selective neutrality by using Ewens–Watterson's tests (with Bonferroni's correction) on 82 populations tested for GM worldwide.12 Therefore, our explanation of the unusual apportionment of genetic diversity observed for the GM polymorphism is, first, that this system has been tested by serological typing, thereby providing only a broad description of its molecular variation, and, second, as explained above, that the frequencies of the most frequent haplotypes in each geographic region are over-estimated because most GM frequencies were estimated by following a parsimonious approach considering a minimum number of haplotypes deduced ‘by hand’ from the phenotypic distributions. As a consequence, the proportion of genetic variation observed among regions has probably also been over-estimated. On the other hand, the most frequent GM haplotypes defined by serology may be seen as broad GM haplogroups including phylogenetically related haplotypes, an interpretation that is sustained by previous analyses performed at the DNA sequence level34 and that recalls the definition of Y-chromosome (non-recombining region, or NRY) haplogroups.35 The Y-chromosome markers deviate from other DNA markers in being, like GM, highly structured at the global scale: according to Hammer et al.,36 36% of the total variance of NRY haplotypes is attributable to differences among populations, although the results vary considerably depending on the markers studied.
Overall, despite the limitations as the result of serology and the possibility of natural selection acting on this system, the analysis of the GM polymorphism has been very useful in revealing the effects of both geographic and cultural differentiations on the genetic structure of modern human populations, and has provided noteworthy examples of the usefulness of this immunogenetic complex for anthropology.
Human genetic diversity as revealed by studies of the HLA polymorphism
Structure and function of HLA molecules
The HLA molecules are peptide-binding molecules encoded by genes in the HLA complex on chromosome 6 (see ref. 37 for a review). They are divided into two classes, class I and class II, which both present peptide fragments of antigens to T cells. Some class I molecules also interact with natural killer (NK) cells. The HLA class I molecules consist of a polymorphic α heavy chain that is non-covalently bound to a small non-polymorphic β chain (β2m, encoded by a gene on chromosome 15). The α chain includes three extracellular domains, two of which (α1 and α2) form a peptide-binding cleft. The classical HLA class I molecules encompass the A, B and C series of molecules, encoded by three different corresponding α chain loci. They are extremely polymorphic (see next section) and expressed in almost all nucleated cells. They bind short peptide fragments (8–10 amino acids long) derived primarily from endogenous proteins and present them at the cell membrane. Here CD8+ T cells with appropriate T-cell receptors will interact with the peptide–HLA complex. Some class I molecules also interact with NK cells. The non-classical HLA class I molecules encompass the E, F and G molecules, which are much less polymorphic and which primarily function as ligands for NK cells. Two HLA class 1 α-related chains, MICA and MICB, are polymorphic but do not have a peptide-binding cleft nor do they bind β2m. They are stress molecules that are up-regulated under certain conditions and function as ligands for the NKG2D activating receptor on NK cells.
The HLA class II molecules consist of two heavy chains, α and β, which both include two extracellular domains. Their peptide-binding cleft is formed by their α1 and β1 domains. The class II molecules encompass the DR, DQ and DP series of molecules, encoded by corresponding α and β chain loci in the HLA complex. The DRβ, DQα, DQβ, DPα and DPβ chains are extremely polymorphic (see next section), whereas the DRα chain is essentially monomorphic. Four different DRβ chains are expressed; DRβ1, DRβ3, DRβ4 and DRβ5. The class II molecules are expressed in specialized antigen-presenting cells such as dendritic cells, where they pick up longer peptide fragments (8–15 amino acids long) primarily from endocytosed exogenous proteins and present them at the cell membrane. Here CD4+ T cells with appropriate T-cell receptors will interact with the peptide–HLA complex.
HLA polymorphism at the protein and DNA levels
The 4-Mb DNA region of the short arm of chromosome 6 (6p21.3) coding for the HLA class I and class II molecules is one of the most polymorphic regions of our genome.38 Regular updates of the numbers of alleles observed at each HLA locus (current numbers are given in Table 2) are recorded in the IMGT/HLA database (http://www.ebi.ac.uk/imgt/hla/), which also provides DNA and amino acid sequences and alignments of HLA alleles and molecules, and nomenclature information.39 This nomenclature has recently been modified substantially according to the allele naming system shown in Fig. 2.
Table 2.
Relevant characteristics of the most polymorphic human leucocyte antigen (HLA) loci
| Gene | A | B | C | DRB1 | DQA1 | DQB1 | DPA1 | DPB1 |
|---|---|---|---|---|---|---|---|---|
| Number of alleles1 | 1381 | 1927 | 960 | 831 | 35 | 127 | 28 | 142 |
| Mean number of pairwise nucleotidic differences2 | 22·23 ± 9·81 | 26·34 ± 11·56 | 15·83 ± 7·09 | 17·77 ± 7·9 | 17·59 ± 8·01 | 12·11 ± 5·53 | n.a. | 9·69 ± 4·47 |
Last updated 6 October 2010.
Estimated on exons 2 and 3 for Class I and exon 2 for Class II, IMGT database release 2·13 (Buhler 2007).40
n.a., not available.
Figure 2.
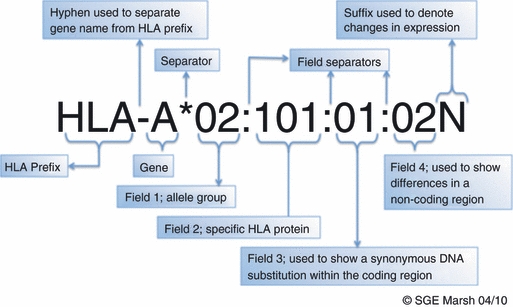
New HLA nomenclature system adopted in 2010 (Figure kindly provided by S.G.E. Marsh, HLA Informatics Group, http://hla.alleles.org/nomenclature/naming.html). Note that the gene symbols are written in italics, in contrast to the gene products which are not italicized.
The high level of diversity found at the HLA loci is principally located in exons 2 and 3 for class I genes, and in exon 2 for class II genes. Such exons correspond, at the protein level, to the peptide-binding region (PBR) of the HLA molecules. The mean pairwise DNA sequence differences between HLA alleles are between ∼ 10 and 26 nucleotides, depending on the locus (Table 2 and ref. 40), suggesting a functional relevance. Analysis of the amino acid sequence of HLA molecules shows that allelic variants differ from each other mainly by substitutions in residues contributing to the PBR, in particular in some pockets in the PBR that accommodate side chains of the bound peptides. Hence, peptides eluted from different HLA class I molecules show distinctive amino acid patterns at certain positions, in particular corresponding to pockets 2 and 9 of the HLA molecules.41 It is therefore assumed that the polymorphism of HLA alleles is to a large extent functional because different HLA molecules bind different sets of peptides. A high sequence diversity is therefore required in the PBR of the HLA molecules to bind a high variety of pathogen-derived peptides that are subsequently presented to T-cell receptors.
The distribution of HLA alleles in different populations may be a consequence of this functional polymorphism. In many instances the immune response to a particular peptide epitope of a pathogen may depend on the HLA alleles carried by the individual. Individuals heterozygous for HLA alleles may have a wider peptide binding repertoire and therefore a capability to respond to more pathogen variants, causing selection of heterozygotes. On the other hand, the existence of several different loci both within the class I (A, B and C) and II series (DR, DQ and DP) of molecules may to some extent compensate for the deficits of homozygosity.
It should also be noted that there exists a very strong linkage disequilibrium (LD), or non-random association, between HLA alleles at different loci; i.e. some HLA alleles are found together in populations more frequently than expected based on their gene frequencies. For example some alleles of the DRB1 locus demonstrate strong LD with specific alleles at the DQA1 and DQB1 loci. Furthermore, in many populations HLA alleles at one locus with high sequence homology, i.e. DRB1, are in LD with the same alleles at other loci, i.e. DQA1 and DQB1, which may indicate an evolutionary relationship between some alleles, i.e. DRB1.42,43 One explanation for differences in haplotype combinations of HLA alleles between different populations is the complementary/compensatory abilities of allelic products encoded by the haplotype to bind peptide epitopes from different pathogens, another being past population differentiations or recent admixture of populations.
HLA diversity in modern human populations
Allelic diversity
Although the number of known HLA alleles increases from year to year, now reaching almost 2000 alleles at HLA-B (Table 2), only part of this polymorphism is detected in individual populations because of typing and statistical limitations (i.e. variable levels of typing resolution, and generally low sample sizes). However, most human populations exhibit a high level of HLA diversity. Table 3 summarizes data on the variation in the number of classical HLA alleles according to two independent studies. For most loci (except genes coding for the α chains of class II molecules, which are less polymorphic), between 10 and 30 alleles are observed per population, the largest number being observed at HLA-B (mean ∼ 30–32). With the exception of the DPB1 locus, and populations that underwent rapid genetic drift (see below), HLA alleles generally exhibit low to medium frequencies, and many of them are very rare (and hence, rarely detected). Actually, 60–70% of known classical HLA alleles have only been reported up to three times,44,45 suggesting that new allele variants are being generated on a regular and ongoing basis.
Table 3.
Variation in the number of detected alleles (k) and observed heterozygosity (H) at each classical human leucocyte antigen (HLA) locus (ordered by decreasing k) in two independent studies
| Buhler (2007)1 | Solberg et al. (2008)2 | ||||||||||
|---|---|---|---|---|---|---|---|---|---|---|---|
| Locus | n | Mean k | SD | Mean H | SD | n | Min k | Max k | Mean k | Mean H | SD |
| HLA-B | 90 | 31·6 | 18·9 | 0·908 | 0·065 | 146 | 5 | 142 | 29·8 | 0·894 | 0·075 |
| HLA-DRB1 | 106 | 22·6 | 13·4 | 0·873 | 0·082 | 258 | 5 | 117 | 21·9 | 0·87 | 0·075 |
| HLA-A | 97 | 19·7 | 11·6 | 0·817 | 0·146 | 154 | 4 | 82 | 18·1 | 0·802 | 0·139 |
| HLA-C | 69 | 17·1 | 7·5 | 0·862 | 0·071 | 114 | 5 | 37 | 16·3 | 0·853 | 0·079 |
| HLA-DPB1 | 56 | 13·7 | 7 | 0·724 | 0·167 | 147 | 2 | 33 | 12·4 | 0·707 | 0·159 |
| HLA-DQB1 | 89 | 12·2 | 4·3 | 0·796 | 0·112 | 202 | 3 | 19 | 11·1 | 0·793 | 0·103 |
| HLA-DQA1 | 58 | 7·4 | 2·2 | 0·75 | 0·111 | 191 | 3 | 8 | 6·7 | 0·747 | 0·088 |
| HLA-DPA1 | – | – | – | – | – | 45 | 2 | 7 | 3·6 | 0·442 | 0·183 |
Data compiled from the 12th and 13th International HLA workshops (IHW) and the immunogenetic literature.40
Data compiled from the 12th and 13th International HLA workshops (IHW), the allelefrequencies.net database, and the immunogenetic literature.49
n, number of populations; k, number of alleles reported per population; H, observed heterozygosity; SD, standard deviation.
Heterozygosity levels and selective neutrality
For most HLA loci, allele frequency distributions are usually even (except in some cases), and populations achieve very high heterozygosity levels. This is reflected by the elevated mean heterozygosity values found at each locus (Table 3), the highest value being observed for HLA-B (∼ 91%). Actually, with the exception of HLA-DPB1, heterozygosity levels are often higher than expected for populations undergoing neutral evolution (i.e. only submitted to stochastic factors linked to the history of human populations, like genetic drift and migration),46–50 which is consistent with the action of natural selection favouring heterozygosis. This hypothesis is also confirmed at the molecular level: at all classical HLA loci except DPB1 (and, to a lesser extent, DQB1), most alleles observed within populations are distantly related from a molecular point of view, with often more than 20 diverging nucleotides among their DNA sequences at exon 2 (and exon 3, for HLA class I).51 These HLA loci may therefore be experiencing asymmetric balancing selection where heterozygous genotypes having molecularly distant alleles would have a higher fitness than heterozygous genotypes exhibiting closely related alleles.51 By contrast, classical selective neutrality tests (e.g. Ewens–Watterson tests) performed at the DPB1 locus generally indicate a neutral model of evolution. However, Tajima's tests for selective neutrality using the information of HLA nucleotide sequences are significant in more than 60% of populations,51 which is less than for the other loci (81–97%), but high enough to indicate selection. Also, the ratio of silent to replacement substitutions in DPB1 sequences is consistent with selection for heterozygosis.52,53 A possible explanation of these results is that HLA-DPB1 would have retained ancient traces of balancing selection at the DNA level,51 although it presently evolves under neutrality.
Global apportionments of genetic variation
As for most genetic polymorphisms tested, the highest level of HLA genetic diversity is found within populations rather than between populations: on average, over several HLA loci, estimated genetic variation within populations, between populations within broad continental regions, and between broad continental regions are 89·9%, 4·4% and 5·7%, respectively, when seven regions and five loci (HLA-A, -B, -C, -DRB1, and -DQB1) are considered46 and are 89·4%, 5·1% and 5·5%, respectively, when five regions and seven loci (HLA-A, -B, -C, -DRB1, -DQA1, -DQB1 and -DPB1) are considered.25 Overall, the average diversity within populations of the classical HLA loci is higher than the value of ∼ 85% often cited for neutral genetic markers22,24 except for HLA-DPB1 (84%),25 which matches other evidence of neutrality (mentioned above) for this locus.
Trends in HLA frequency variation worldwide and at different loci
Solberg et al. (2008)49 have collected detailed data on the HLA diversity in different populations worldwide (but see also http://www.allelefrequencies.net/). Table 4 lists the four most frequent (FMF) alleles at each of the classical HLA loci in 10 regions of the world, along with the cumulative frequency for those alleles (CAF) in each region. This table also includes an ‘other’ region (OTH) with admixed populations derived from more than one region.
Table 4.
Four most frequent classical human leucocyte antigen (HLA) alleles and their cumulative frequencies in 10 world regions
| HLA-A | HLA-B | HLA-C | HLA-DRB1 | HLA-DQA1 | HLA-DQB1 | HLA-DPA1 | HLA-DPB1 | |||||||||
|---|---|---|---|---|---|---|---|---|---|---|---|---|---|---|---|---|
| Region | Alleles | CAF | Alleles | CAF | Alleles | CAF | Alleles | CAF | Alleles | CAF | Alleles | CAF | Alleles | CAF | Alleles | CAF |
| SSA | 23:01, 02:01:01G, 30:02, 68:02 | 0·37 | 53:01, 15:03, 42:01, 58:02 | 0·30 | 06:02, 04:01, 07:01, 02:02 | 0·51 | 15:03, 13:02, 11:01, 07:01 | 0·40 | 01:02, 05:01:01G, 01:01:01G, 03:01:01G | 0·80 | 06:02+, 05:01, 02:01:01G, 03:01 | 0·75 | 02:01, 01:03, 03:01, 02:02 | 0·98 | 01:01, 04:02+, 02:01, 17:01 | 0·69 |
| NAF | 02:01, 01:01, 23:01, 24:02 | 0·43 | 50:01, 44:03, 08:01, 51:01 | 0·27 | 06:02, 07:01, 04:01, 02:02 | 0·53 | 07:01, 03:01, 15:01, 13:02 | 0·45 | 05:01:01G, 02:01, 01:02, 03:01:01G | 0·80 | 02:01:01G, 03:01, 05:01, 06:02 | 0·70 | 04:01+, 03:01, 02:01, 04:02 | 0·68 | ||
| EUR | 02:01:01G, 01:01:01G, 03:01, 24:02:01G | 0·63 | 07:02, 08:01, 44:02, 51:01 | 0·36 | 07:01, 07:02, 04:01, 05:01 | 0·52 | 07:01, 03:01, 15:01+, 01:01 | 0·46 | 05:01:01G, 01:02, 03:01:01G, 01:01:01G | 0·79 | 02:01:01G, 03:01, 05:01, 06:02 | 0·65 | 01:03, 02:01, 02:02, 01:05 | 1·00 | 04:01+, 02:01+, 04:02+, 03:01 | 0·79 |
| SWA | 11:01, 24:02:01G, 02:01:01G, 01:01 | 0·43 | 40:06, 51:01, 35:01, 58:01 | 0·28 | 04:01, 06:02, 07:01, 15:02 | 0·44 | 07:01, 11:01, 03:01, 15:01 | 0·39 | 05:01, 03:01:01G, 02:01, 01:03 | 0·71 | 02:01:01G, 03:01, 06:01, 03:02 | 0·62 | 01:03, 02:01, 02:02, 01:04 | 0·99 | 04:01+, 02:01, 04:02+, 01:01 | 0·81 |
| SEA | 24:02, 11:01, 02:01, 02:07 | 0·66 | 40:01, 46:01, 13:01, 15:02+ | 0·38 | 07:02, 03:04, 01:02, 08:01 | 0·60 | 12:02, 14:01, 09:01, 08:03 | 0·41 | 03:01:01G, 01:02, 01:01:01G, 05:01:01G | 0·74 | 03:01:01G, 05:02, 03:03, 02:01:01G | 0·59 | 02:01, 01:03, 02:02, 03:01 | 1·00 | 05:01, 02:01+, 13:01, 04:02+ | 0·66 |
| OCE | 24:02:01G, 11:01, 34:01, 24:07 | 0·86 | 56:01, 40:02, 40:01, 13:01 | 0·45 | 04:03, 07:02, 01:02, 04:01 | 0·58 | 15:02, 11:01, 08:03, 15:01 | 0·49 | 01:02, 05:01, 01:01:01G, 03:01:01G | 0·87 | 03:01, 06:01, 05:02, 05:03 | 0·65 | 02:02, 01:03, 02:01, 04:01 | 1·00 | 05:01, 04:01+, 02:01+, 01:01 | 0·82 |
| AUS | 34:01, 24:02, 11:01, 02:01 | 0·92 | 13:01, 40:02, 56:01, 15:21 | 0·67 | 04:01, 01:02, 15:02, 04:03 | 0·81 | 08:03, 14:08, 04:05, 15:02 | 0·57 | 01:03, 03:01, 05:01, 01:01 | 0·86 | 06:01, 04:02, 05:03, 03:01 | 0·81 | 05:01, 22:01, 02:01, 04:01 | 0·93 | ||
| NEA | 24:02, 02:01, 11:01, 33:03 | 0·60 | 51:01, 15:01, 35:01, 52:01 | 0·29 | 01:02, 03:03, 07:02, 03:04 | 0·50 | 09:01, 04:05, 15:01, 08:03 | 0·36 | 03:01:01G, 05:01:01G, 01:02, 01:03 | 0·77 | 03:01:01G, 03:03, 06:01, 03:02 | 0·54 | 01:03, 02:02, 02:01, 01:04 | 1·00 | 05:01, 02:01, 04:01+, 04:02 | 0·78 |
| NAM | 24:02, 02:01, 02:06, 31:01 | 0·77 | 35:01, 40:02, 51:01, 27:05 | 0·48 | 03:04, 07:02, 04:01, 02:02 | 0·56 | 14:02, 08:02, 04:07, 04:11 | 0·48 | 03:01:01G, 05:01, 04:01, 01:01:01G | 0·97 | 03:01, 03:02, 04:02, 03:03 | 0·91 | 01:03, 02:01, 02:02, 04:01 | 1·00 | 04:02, 04:01+, 02:01, 03:01 | 0·94 |
| SAM | 31:01, 02:01, 24:02, 68:01 | 0·74 | 39:05, 40:02, 48:03, 39:09 | 0·31 | 07:02, 03:04, 04:01, 15:03 | 0·84 | 08:02, 16:02, 14:02, 04:11 | 0·62 | 05:01, 03:01:01G, 04:01, 01:01:01G | 0·96 | 03:01, 03:02, 04:02, 05:01 | 0·92 | 01:03, 02:01, 02:02 | 1·00 | 04:02, 14:01, 04:01+, 13:01 | 0·90 |
| OTH | 02:01, 03:01, 23:01, 24:02 | 0·39 | 53:01, 35:01, 07:02, 44:03 | 0·26 | 04:01, 07:01, 07:02, 06:02 | 0·47 | 07:01, 03:01, 11:01, 08:02 | 0·27 | 05:01:01G, 01:02, 03:01:01G, 01:01:01G | 0·73 | 03:01:01G, 02:01:02G, 03:02, 06:02+ | 0·64 | 02:01, 02:02, 01:03, 03:01 | 0·99 | 01:01, 04:02, 02:01, 04:01+ | 0·67 |
SSA, Sub-Saharan Africa; NAF, North Africa; EUR, Europe; SEA, Southeast Asia; SWA, Southwest Asia; OCE, Oceania; AUS, Australia; NEA, Northeast Asia; NAM, North America; SAM, South America; OTH, Other (admixed, or derived from more than one region). The populations included in each region are indigenous to that region or migrated recently (within the last ∼ 500 years) from that region. For example, EUR includes European Americans and European Australians, NAM and SAM are specific for Native American populations, and AUS is specific for Aboriginal Australian populations. CAF, Cumulative Allele Frequency.
For each locus and region, the alleles are listed in decreasing order of frequency. For example at the HLA-A locus in SSA, A*23:01 is the most frequent allele, followed by A*02:01:01G. Empty cells indicate that no typing data were available for that locus–region combination.
Because of differences in the resolution of typing between studies, some alleles were combined to a common category for comparison. The following four most frequent (FMF) alleles present in specific regions of the world represent multiple alleles that are identical in their exon 2 nucleotide sequences (for class II alleles) or exon 2 and 3 nucleotide sequences (for class I alleles) and are indicated as G groups, or that were combined to a common category because of typing ambiguity and are denoted with an asterisk (*).
A*01:01:01G represents A*01:01 and A*01:04N in EUR.
A*02:01:01G represents A*02:01 and A*02:09, in SSA, EUR and SWA.
A*24:02:01G represents A*24:02, A*24:09 and A*24:11N in EUR, SWA and OCE
B*15:02+ represents B*15:02 and B*15:13 in SEA.
DRB1*15:01+ represents DRB1*15:01 and DRB1*15:06 in EUR.
DQA1*01:01:01G represents DQA1*01:01, DQA1*01:04 and DQA1*01:05 in SSA, EUR, SEA, OCE, NAM, SAM and OTH.
DQA1*03:01:01G represents DQA1*03:01, DQA1*03:02 and DQA1*03:03 in SSA, NAF, EUR, SWA, SEA, OCE, NEA, NAM, SAM and OTH.
DQA1*05:01:01G represents DQA1*05:01, DQA1*05:02, DQA1*05:03 and DQA1*05:05 SSA, NAF, EUR, NEA, SEA, and OTH.
DQB1*02:01:01G represents DQB1*02:01 and DQB1*02:02 in SSA, NAF, EUR, SWA, SEA, and OTH.
DQB1*03:01:01G represents DQB1*03:01 and DQB1*03:09 in SEA, NEA and OTH.
DQB1*06:02+ represents DQB1*06:02 and DQB1*06:11 in SSA and OTH.
DPB1*02:01+ represents DPB1*02:01 and DPB1*48:01 in EUR, SEA and OCE.
DPB1*04:01+ represents DPB1*04:01, DPB1*23:01 and DPB1*39:01 in NAF, EUR,SWA, OCE, NEA, NAM, SAM, and OTH.
DPB1*04:02+ represents DPB1*04:02, DPB1*49:01 and DPB1*51:01 in SSA, EUR, SWA, and SEA.
Only a few of the FMF HLA-B alleles (e.g. B*40:02, or *51:01G) are shared across regions. The low CAF of these alleles, which represent 50% or less of the allelic diversity in each region [with the exception of Australia (AUS)], reflects the high level of polymorphism at this locus, and this pattern suggests that HLA-B is extremely responsive to local variation in immune challenges. This is consistent with the highest proportion (96·7%), compared with the other loci, of statistical deviations from neutrality as assessed by Tajima's tests51 of HLA-B, and also with other types of studies suggesting that this locus is under the strongest selection for heterozygous advantage.54,55 This extreme diversity may explain why, as the result of statistical limitations (e.g. mean sample size of only 127·1 ± 138·4 individuals in 90 populations analysed by Buhler and Sanchez-Mazas,51 compared with the large number of existing HLA-B alleles), the occurrence of rare HLA-B alleles is very heterogeneous among geographic regions and may give the impression that large numbers of regionally restricted alleles exist in all regions. South Amerindians however, carry some HLA-B alleles that are not detected (i.e. are rare or absent) elsewhere and that constitute a rather high proportion (∼ 15%) of the total allelic frequency, which probably results from a combination of genetic drift and natural selection in the colonization of South America.56–60
In contrast to HLA-B, some HLA-A, -C, and -DRB1 alleles are common over very large areas of the world, whereas others enjoy high frequencies only in specific regions. For example, the HLA-A*23:01 allele is one of the FMF alleles in African [Sub-Saharan Africa (SSA) and North Africa (NAF)] populations, but not in other populations, while A*02:01/*02:01:01G is one of the FMF alleles in all regions but Oceania (OCE), where it is ranked fifth (data not shown). Similarly, HLA-C*07:01G is one of the FMF alleles in Africa, Europe (EUR), and Southwest Asia (SWA), while *07:02G is one of the FMF alleles in EUR, Southeast Asia (SEA), OCE, Northeast Asia (NEA), and the Americas [North America (NAM) and South America (SAM)]. At the DRB1 locus, DRB1*11:01 is one of the FMF alleles in SSA, SWA and OCE, and *15:01 is one of the FMF alleles in NAF, EUR, SWA, OCE and NEA. Based on their CAFs, the FMF alleles at these loci represent 40–70% of the allelic diversity in each region.
Patterns of allelic diversity at the class I and DRB1 loci differ considerably from those at DQA1, DQB1, DPA1 and DPB1. At the latter loci, a small number of alleles are observed at high frequencies all over the world (resulting in most cases, at least for DPB1, in ‘L-shaped’ rather than even frequency distributions). The DQA1*03:01/*03:01:01G and *05:01/*05:01:01G alleles are two of the FMF alleles in all regions; the DQB1*0301/*03:01:01G allele is one of the FMF alleles in all regions; DPA1*01:03, *02:01, and *02:02 are three of the FMF alleles in all surveyed regions (and are the only DPA1 alleles observed in SAM); and the DPB1*04:01 and *04:02G alleles are one or two of the FMF alleles in all regions. Moreover, based on their CAFs, the FMF alleles at these loci represent 60–90% of the allelic diversity in each region.
The trends observed for the DQ and DP loci contrast markedly with those for the DRB1 locus, and the differences may reflect divergent strategies of class II allelic diversification. Although there is low diversity in the genes that encode the α and β subunits of the DQ and DP proteins, a population may display greater diversity of heterodimeric DQ and DP proteins than DR proteins because the DQ and DP heterodimers may be encoded both in the cis and the trans positions of their genes (although for DQA1 and DQB1, particular combinations form unstable dimers61,62). As there is much less variation of the DRA gene, this may be driving DRB1 to diversify in a manner more similar to the class I loci.
Patterns of HLA genetic variation worldwide
Despite evidence of natural selection acting on the evolution of the HLA polymorphism, as discussed above, this immunogenetic system is highly informative for anthropological studies, as the patterns of HLA genetic variation reveal spatial and demographic human populations expansions that occurred in the past. At the global level, genetic distances between populations estimated from frequency data for all HLA loci are highly significantly correlated with geographic distances, these correlations reaching intermediate to high values (r ≅ 0·2–0·5).40 This is also true when populations from Taiwan (TW), OCE, and NAM and SAM, which exhibit a very high degree of diversification probably because of rapid genetic drift, are excluded. Significant correlations with geography are also obtained at the global scale when genetic distances are estimated by weighting them by the molecular distances (i.e. the nucleotide differences) among the alleles.51 This result is therefore robust and leads to the conclusion that human migrations were a primary force in the evolution of HLA variation worldwide, in addition to demographic expansions (contributing to allelic diversification) and contractions (contributing to population diversification).
HLA genetic differentiations in Africa
Genetic signatures of the history of modern humans are even more detectable when one focuses on the HLA genetic patterns within specific continental areas. The following examples are illustrative. In Africa, linguistic differentiations among populations speaking languages of each of the four main African linguistic phyla – Niger-Congo (NC), Nilo-Saharan (NS), Afro-Asiatic (AA) and Khoisan (KH) – are excellent predictors of HLA genetic differentiations: according to a recent analysis of HLA-DRB1 variation in Africa,63 AA populations from Ethiopia (i.e. Amhara and Oromo, which exhibit a very high frequency of DRB1*13:02, but also elevated *07:01 and *03:01 frequencies) cluster with AA populations from North Africa, whereas the Nyangatom, a NS population, also from Ethiopia, show a peculiar genetic profile and share some similarities (high frequencies of *11:01) with NC, the latter being further differentiated into West Africans (high frequencies of *13:04) and Central-South Africans (high frequencies of *15:03). Therefore, although the HLA genetic patterns of African populations appear to be geographically structured according to South, West, East and North differentiations,64 a close relationship is also found for the DRB1 locus between genetic and linguistic variation in Africa. This confirms the conclusions drawn from the study of other genetic markers like GM (as described in an earlier section), RH and the Y chromosome:13,14,65 at least for these polymorphisms, present African genetic patterns are mostly explained by recent migrations (i.e. within the last ∼ 15 000 years) corresponding to the expansion of the main linguistic families in this continent.
HLA genetic differentiations in Europe
At loci HLA-C and -DRB1 (and this is also the case for GM, as stated above), the HLA genetic structure of Europeans reveals marked variation between West-Central and North populations, on one hand, and Southeast populations, on the other (with elevated frequencies of DRB1*11:04, DRB1*11:01 and C*04:01 compared with the other regions), a sharp genetic boundary being detected approximately at the level of the Alps.66,67 This may be the consequence of reduced levels of gene flow across these mountains during the peopling history of this continent, most probably during the Neolithic where demic diffusion occurred and probably followed a punctuated or geographically non-homogeneous rather than continuous mode of population migration from the Near East.68–71 The HLA genetic map of Europe is also characterized by an extreme differentiation of some populations, like the Norwegian Sami (high cumulated frequencies of A*03:01G, B*27:05G, C*01:02, DRB1*08:01 and DQB1*04:02), which are more closely related, genetically, to the Finnish population speaking a language of the same Uralic family (non Indo-European) than to other Norwegians.72 On the other hand, Basques, a cultural and linguistic isolate in Northwest Spain, only exhibit slightly different HLA frequencies compared with Indo-European populations,73,74 which is consistent with genome-wide scale analyses.75
HLA genetic differentiations in East Asia and Oceania
In East Asia, latitudinal genetic clines are observed at all classical HLA loci, with higher levels of internal genetic diversity in Northeastern than in Southeastern populations.19 Uneven distributions of some HLA alleles and allelic lineages are also found between Northeast and Southeast Asian populations, with a restricted geographic distribution of some alleles detected in the south (HLA-A*02:03, *02:07, *11:02, B*13:01, *15:02, *38:02, *46:01, C*04:03, DPB1**21:01, DRB1*12:02, *13:12, *14:04), whereas many alleles observed in the north are more globally distributed.19 These results challenge current views sustaining a unique origin of East Asian populations in Southeast Asia (e.g. ref. 76), as they are more compatible with an overlapping model (comparable to the ‘pincer model’ proposed by Ding et al.77) suggesting that modern humans arrived in East Asia from the west through both a northern and a southern route, and after that underwent substantial gene flow by migrating both northward from the south and southward from the north, but at different periods, in East Asia.19
Some results are also relevant for Oceania. For example, HLA-DRB1 data confirm some genetic relationship between Papua New Guinea Highlands populations and Australian Aborigines (with several DRB1*04 and DRB1*14 alleles shared among them), indicating that they may be common descendants of an ancient colonization of this area,78 which was a unique landmass (‘Sahul’) during Palaeolithic glacial periods. On the other hand, Australian and Papuan populations differ genetically from Austronesian-speaking populations, which are highly diversified among them, and more particularly Taiwan aborigines,79,80 whose geographic expansion colonized the entire Pacific area during the last 4500 years.
As a relevant illustration, Fig. 3 shows a summarized view (average genetic distances on loci HLA-A, -B and -DRB1) of HLA genetic relationships in East Asia (including Taiwan aborigines). The major East Asian linguistic groups are well discriminated and Taiwanese populations (all Austronesians represented in the figure except Yami, located in the small Lan-Yu island off the southeast coast of Taiwan, and who speak a Malayo-Polynesian language) are scattered on the right side. The Pazeh and the Siraya, located on the western coast of Taiwan, are close to continental East Asians (Chinese Han), whereas the Ami living in the east coast lie in an outer position; these results may sustain the linguistic theory proposed by Sagart.21
Figure 3.
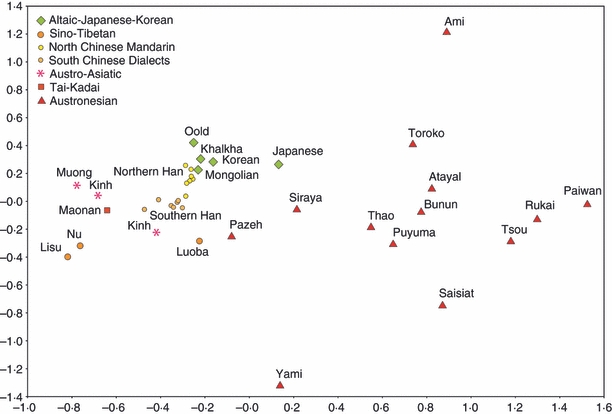
Multidimensional scaling analysis (MDS) of 39 populations from East Asia tested for HLA (average distances were computed on HLA-A, HLA-B and HLA-DRB1 data). Each point represents a population and its symbol the linguistic family to which its language belongs. Stress value = 0.10 (good).
HLA genetic differentiations in America
Amerindian populations are also distant genetically from each other for HLA, and even more discriminated when genetic distances are weighted with the molecular distances among alleles.51 Their allelic diversity is limited, with some alleles exhibiting very high frequencies (e.g. DRB1*04:07, *04:11, *0802, *14:02 and/or *1602, depending on the population). Amerindian alleles belong to a subset of lineages observed in East Asia, in accordance with the peopling of the Americas through the Bering Strait. In both Oceania and the Americas, rapid genetic drift as the result of small population sizes and reduced migration levels led to a drop of genetic diversity, but the large molecular differentiation among most HLA alleles might have helped to ensure immunological protection.
Study of American Indian populations from Mexico and South America shows intriguing observations. In spite of the finding of a restricted number of alleles, all HLA loci with the exception of DPB1 present high levels of heterozygosity.49,51 In Amerindian populations, very few allelic lineages (four HLA-A, seven HLA-B, seven HLA-C, five HLA-DRB1, two HLA-DQA1, two HLA-DQB1 and five HLA-DPB1) are detected, but several alleles of the same lineage are present in each population. Many of the alleles found in these populations are not observed in other outbred populations.56–60,81–84 It can be postulated that these alleles were generated in America and are novel alleles. Gene conversion events could be invoked as the mechanism for their generation. In fact, all putative novel alleles may derive from a few founder alleles (those alleles of each lineage found in other populations) and all the nucleotide sequences donated in the gene conversion events may have come from other founder alleles. Almost all novel alleles identified differ from other alleles in the same lineages by amino acid substitutions in residues contributing to the peptide-binding groove, and may potentially have new peptide-binding capabilities.56–60 Most of the postulated gene conversion events may involve donor and recipient alleles of the same locus. The HLA-B locus presents the highest degree of diversity, and the majority of the putative novel alleles found in these populations comes from this locus. Therefore, it has been postulated that HLA-B has diversified more rapidly in the South American populations.56,60 Interestingly, novel HLA-B alleles are present at the highest gene frequencies in many populations, suggesting that novel alleles generated in America were positively selected in these populations probably because they provided selective advantages.57–59 It is conceivable that, with a limited founder polymorphism, any novel allele that arose in these environments would enlarge the peptide-binding repertoire of these populations. Perhaps the HLA-B locus diverged more than the HLA-A or -DRB1 loci in the South American populations, as a result of a higher probability for intra-locus gene conversions because this locus presented a larger number of founder alleles.
The example of Easter Island
The informative value of HLA typing in anthropological investigations may be illustrated by our studies on Easter Island (for more details, see refs 85–87). Although the available data suggest that Easter Island was first colonized by eastern-migrating Polynesians around 1000 years ago, there is also evidence of an early South American contact. As a matter of fact, the Norwegian explorer Thor Heyerdahl proposed that Easter Island was first populated by American Indians (Amerindians). Previous studies of mtDNA or other chromosomal markers have, however, not been able to demonstrate an early Amerindian contribution to the gene pool on Easter Island or other Polynesian islands, before the Peruvian slave raids in Polynesia in the early 1860s, which resulted in an admixture of Amerindian and European genes in the area.
To address this issue we carried out studies of DNA from blood samples collected in 1971 and 2008 from reputedly non-admixed native Easter Islanders. All typed individuals carried mtDNA of Polynesian origin, and most males carried Y-chromosome markers of Polynesian origin while the rest carried Y chromosome markers of European origin. Genomic typing of HLA demonstrated, however, that some individuals carried HLA alleles that are typically detected in Amerindians. For example, some individuals had an HLA haplotype carrying A*02:12, B*39:05 and other alleles, which are not detected or are very rare in non-Amerindian populations (ref. 49; see also Table 4). We could trace the introduction of this haplotype on Easter Island to a time before the Peruvian slave raids. Our studies cannot establish exactly when these Amerindian alleles were introduced to Easter Island, but they indicate that it may have occurred in ‘prehistoric’ times; i.e. before the island was discovered by Europeans in 1722, but after the island had been inhabited by Polynesians.
There are at least two explanations why an early Amerindian contribution to the gene pool on Easter Island was not detected by studies of mtDNA and Y-chromosome markers. One is that the Amerindian HLA alleles may have been subject to different selective forces than Amerindian mtDNA and Y-chromosome markers, because the HLA genes encode molecules of great importance in immune responses. Another explanation is genetic drift. At the end of the 1800s approximately 100 individuals were left on the island as the result of the Peruvian slave raids and epidemics. Uniparental markers such as mtDNA and Y-chromosome markers are more sensitive to genetic drift than genes that are inherited from both parents. In any case, our results illustrate the usefulness of HLA typing to complement studies of mtDNA and other chromosomal markers in anthropological investigations.
Evolutionary interpretation: human migrations history versus selection
Almost all classical HLA loci are under the influence of some form of natural selection in addition to the stochastic forces – random genetic drift, demographic evolution and migration – associated with human peopling history. This has been shown through different approaches: (i) selective neutrality tests, which often reveal deviations from neutral expectations toward an excess of heterozygotes,46,48,49,51,88 although homozygous excess has also been observed; (ii) comparisons of synonymous versus non-synonymous substitution rates, indicating an excess of amino acid replacements in the PBR of the HLA molecules;54,89 (iii) deep coalescent times of most HLA lineages, explainable by balancing selection;90 and (iv) computer simulation studies,55 more recently improved by ABC approaches to infer selection coefficients in specific situations.91 These results may be explained by our knowledge of the immune function of both class I and class II HLA molecules, the main hypothesis being that allelic diversity would have been favoured to better protect individuals in pathogen-rich environments, among other theories.92 Indirect support for this hypothesis has been provided by Prugnolle et al.93 who found a significant correlation between HLA class I heterozygosity levels in populations and pathogen richness at the global level. However, this correlation tends to drop when Amerindian populations are not taken into account (J.-F. Lemaître, M. Currat and A. Sanchez-Mazas, in preparation). As mentioned above, Amerindians may behave as isolated populations in which significant founder effects restrict the level of polymorphism. These populations show high levels of lineage differentiation that may have been selected to cope with environmental factors. Therefore, a better investigation of the relationship between the molecular diversity of HLA alleles and the function of HLA molecules should be undertaken to confirm the hypothesis of pathogen-driven selection.
On the other hand, most studies aimed at estimating selective coefficients (s) at the HLA loci showed that amino acid sites at the PBR region of HLA molecules are under weak selective constraint, as s values do not exceed a few per cent, (e.g. refs 54, 91) whereas other selected polymorphisms may reach much higher values (e.g. 10–20% for G6PD/A- relative to malaria94). Also, because it may depend on the pathogenic environment, the intensity of selection operating on the HLA loci may not be uniform across different geographic regions and may even be absent in specific geographic areas, as shown for Southwest Europe compared with Northwest Africa for HLA-DRB1.91 Therefore, it would be imprudent to dismiss the use of HLA polymorphism to study the history of human migrations because of selection. Rather, in addition to comparisons of HLA to neutral markers by using classical population genetics analyses,46 new approaches using computer simulation, such as those used by Currat et al.,91 can now be applied to disentangle the effects of stochastic and deterministic factors on the evolution of HLA polymorphism. This will certainly help to improve the interpretation of HLA diversity patterns worldwide in the near future.
Human genetic diversity as revealed by studies of the KIR polymorphism
Nature and function of KIR molecules
Constituting 5–15% of the peripheral blood mononuclear cells,95 the NK cells are an integral component of innate immunity, which depends upon their ability to rapidly secrete cytokines and chemokines, as well as to directly kill unhealthy cells.96 When HLA class I expression is generally down-regulated in virally infected or malignantly transformed cells, rendering the cells resistant to cytolysis by cytotoxic T lymphocytes, these aberrant levels of class I expression can result in spontaneous destruction by NK cells, a concept originally termed the ‘missing-self’ hypothesis.97 Normal healthy cells are protected from spontaneous NK cell killing when they express an appropriate ligand for an inhibitory receptor carried by NK cells. In contrast to the cytotoxic T lymphocytes, the NK cells use a vast array of germline-encoded non-arranging receptors that can trigger either inhibitory or activating signals.98 The net signal integrated from the inhibitory and activating receptors determines the effector function of NK cells.98
The human NK cell function is largely controlled by a family of polymorphic killer cell immunoglobulin-like receptors (or KIR) located in the leucocyte receptor complex that maps to chromosome 19q13.4.99 Fourteen KIR receptors triggering either inhibition (3DL1–3, 2DL1–3, 2DL5) or activation (3DS1, 2DS1–5), or both (2DL4) have been identified. HLA-C is the primary ligand for inhibitory KIR.100 KIR3DL1 binds to the Bw4 serological epitope present on 40% of the HLA-B allotypes and certain HLA-A allotypes (HLA-A23, -A24, -A25 and -A32).101 KIR3DL2 has been shown to recognize certain HLA-A allotypes (HLA-A3 and -A11); however, the precise specificity of this receptor has not been defined.102 The KIR2DL4 receptor binds to the trophoblast-specific non-classical class I molecule HLA-G and induces rapid interferon-γ production that promotes vascularization of the maternal decidua during early pregnancy.103
Although the specificity of the inhibitory KIRs has been extensively characterized, very little is known about the ligands for the activating KIRs. Certain activating KIRs are predicted to bind to the same HLA class I ligands as their structurally related inhibitory KIRs.
KIR polymorphism at the protein and DNA levels
Variable gene content KIR haplotypes
The number and type of KIR genes differ substantially between haplotypes (Fig. 4). Nearly 30 distinct KIR haplotypes with distinct gene content have been characterized to date.104 They are broadly classified into two groups, A and B. Only four KIR genes (KIR2DL4, 3DL2 and 3DL3, 3DP1) are invariably present on all KIR haplotypes so they are referred to as ‘framework’ genes.105 Group A haplotypes have a fixed gene content comprising KIR3DL3-2DL3-2DP1-2DL1-3DP1-2DL4-3DL1-2DS4-3DL2 (Fig. 4, haplotype 1), but are diversified through allelic polymorphism of the individual genes. In contrast, group B haplotypes have a variable gene content comprising several genes and alleles, some of which are not on the A haplotype (Fig. 4, haplotypes 2–6). Hence, B haplotypes generally encode more activating KIR than the A haplotype that encodes a single activating receptor, KIR2DS4. Homozygotes for group A haplotypes (Fig. 4, haplotype 1) have only seven functional KIR genes, whereas heterozygotes for group A and group B haplotypes (Fig. 4, haplotypes 1 + 2) may have all 14 functional KIR genes.
Figure 4.
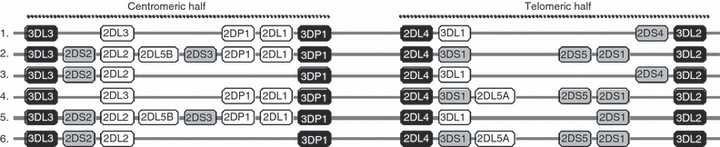
KIR haplotypes have variable gene content. Map of selected KIR haplotypes is shown. Haplotype 1 represents group-A KIR haplotype and the remainder are the representative of over 30 known group-B haplotypes. The framework genes, present in all haplotypes are shown in black boxes; genes encoding activating KIR are in gray boxes; and those for inhibitory receptors are in white boxes. KIR2DP1 and KIR3DP1 are pseudogenes that do not encode any functional receptors.
The function of the inhibitory KIR depends on the availability of their specific cognate HLA class I ligands. Given that both KIR genes at chromosome 19q13.4 and HLA genes at chromosome 6p21.3 are polymorphic and display significant variations, the independent segregation of these unlinked gene families produce a great diversity in the number and type of KIR–HLA pairs in individuals.
Nature of KIR gene polymorphism
In addition to haplotypic diversity, each KIR gene exhibits considerable sequence polymorphism. As of May 2010 a total of 347 KIR sequences have been deposited into the GenBank (http://www.ncbi.nlm.nih.gov/Genbank/) and IPD-KIR databases (http://www.ebi.ac.uk/ipd/kir/index.html). The inhibitory KIR genes are relatively more polymorphic, whereas the activating KIR genes are generally conserved. Because of the similarity in sequence of the genes there have been many reports of unequal recombinations. This has led to duplication of the genes on the same haplotype106 or to the converse of haplotypes missing genes, including framework genes.107
KIR diversity in human populations
Studies in a limited number of KIR loci and populations to date support the notion that variation within and between populations in the activating KIR is maintained primarily through gene-content variation, rather than allelic diversity. In contrast, although most individuals bear the majority of the inhibitory KIRs, significant allelic polymorphism is often present at these loci. The extensive polymorphism of KIR genes and their alleles has been reviewed previously.6 The synergistic combination of allelic polymorphism and variable gene content individualizes KIR genotypes to an extent where unrelated individuals almost always have different KIR types. Furthermore, the KIR receptors are clonally expressed on NK cells, so that each NK cell clone expresses only a portion of the genes carried by the gene profile of the individual.108 Stochastic expression of different combinations of receptors by NK cells results in this repertoire of NK clones with a variety of ligand specificities. This level of diversity probably reflects a strong pressure from pathogens on the human NK cell response.
KIR gene content diversity in human populations
All human populations have both group A and group B haplotypes, but their frequencies vary considerably.109–111 Worldwide, approximately 30% of individuals are homozygous for the canonical A haplotypes, which are found in all populations examined to date; however, a wide range in the A haplotype frequency is observed between populations, from 8 to 80%. These patterns of haplotypic variation result in differential gene content profiles in world populations; over 300 distinct KIR genotypes have been identified in a collection of worldwide human populations (http://www.allelefrequencies.net). Nevertheless, diversity in KIR gene content between populations can be attributed in large part to frequency variation in common haplotypes, which may reflect both population history and local adaptation. Haplotype estimation in world populations112 across the entire KIR region suggests that the six gene-content haplotypes illustrated in Fig. 4 can account for ∼ 85% of the total observed variation in most world regions; some exceptions are found within Africa and Oceania,113,114 where extensive diversity in the B haplotype is observed, with numerous other, low-frequency haplotypes in addition to those represented in Fig. 4.
By comparative analysis of world populations, a link was found between the prehistoric human migrations and the evolution of two groups of KIR haplotypes distinguished by their content of activating KIR genes.111 The natives of America,115,116 Australia117 and India,118–120 who had extensive prehistoric migrations, carried high frequencies of B haplotypes. Presumably the aboriginal populations of India, Australia and America acquired activating KIR genes to survive the environmental challenges during their distant migrations from Africa.119 In contrast, most Northeast Asians (> 55%), including Chinese, Japanese and Koreans, who settled in the lands of more temperate latitudes where the environmental changes between summer and winter are subtle, carry only group A haplotypes, which express no or only one activating KIR receptor.121–123 In Africans and Europeans, the A and B haplotypes are distributed equally, which suggests a balancing selection.
Patterns of worldwide KIR diversity
In nearly all human populations studied to date, within each of the centromeric and telomeric portions of the KIR cluster (with KIR3DP1 and KIR2DL4 delineating the dividing point for these) there exists extensive linkage disequilibrium (LD).124 For example, across all populations examined for the KIR anthropology component of the 15th International Histocompatibility and Immunogenetics Workshop (IHIW),125 the average overall LD between the centromeric B haplotype loci KIR2DL2 and KIR2DS2 was shown to be nearly complete (Wn = 0·99). Likewise, the telomeric B loci KIR3DS1 and KIR2DS1 are also in very strong LD (Wn = 0·92). In contrast, much less LD is observed between loci of the centromeric and telomeric portions of the cluster in all populations in this study; the overall LD between KIR2DL2 and KIR3DS1 is very low (Wn = 0·10).
The centromeric and telomeric portions of the KIR cluster each have distinct patterns of worldwide variation. Balanced frequencies are often observed for the centromeric KIR A and B haplotypes; the frequency of Cen-A (i.e. characterized by the presence of KIR2DL3, KIR2DP1 and KIR2DL1) in most populations worldwide is ∼ 50–60%, roughly that which is observed for the extended A haplotype. The notable exception is within East Asian populations,110,111,126 where the frequency of the centromeric B haplotype loci KIR2DL2 and KIR2DS2 is generally very low and Cen-A is observed at frequencies greater than 80%; the frequency of the extended (centromeric and telomeric) A haplotype also tends to be highest in these populations. It is interesting to note, however, that these exceptionally high Cen-A frequencies are generally not observed in Amerindian populations,112 suggesting that this shift occurred within East Asia subsequent to the differentiation of the Amerindians from these populations. Although the loci associated with the full-length motif Cen-B1 (i.e. characterized by the presence of KIR2DL2, KIR2DS2, KIR2DL5, KIR2DS3/S5, KIR2DP1 and KIR2DL1) are very common within Africa,110,112,127 the much shorter Cen-B2 (i.e. characterized by the presence of the framework genes in addition to KIR2DL2 and KIR2DS2) is observed primarily outside Africa, and this motif largely replaces Cen-B1 in some populations outside Africa (J. Hollenbach, unpublished results). However, there is no clear pattern or gradient associated with this motif, which appears to be distributed somewhat sporadically across several world regions. African populations in general exhibit substantially greater haplotypic diversity within the centromeric KIR region relative to other world regions.
The telomeric portion of the KIR is characterized by a pattern of variation more closely related to population demographics. As previously noted, the stimulatory KIR3DS1 is found at much lower frequencies in African populations relative to most other world populations;112,128 its frequency increases with geographic distance from Africa.110 Although the African populations exhibit some of the highest frequencies for the centromeric B haplotype loci, the frequency of all telomeric B haplotype activating loci is in general very low in African populations. However, whereas the overall frequency of the extended B haplotype is comparatively low among the Asian populations, extended B haplotype frequencies are relatively high in the African populations. Other world populations generally range between these extremes. It is striking, however, that despite this variation, the worldwide frequency of A and B haplotype heterozygosity is generally stable, with an average frequency of 44%, suggesting that there is a population-level advantage in maintaining these balanced frequencies.125
Finally, although it is likely that KIR2DS3 and KIR2DS5 are alleles of a duplicated locus, which may appear on either the centromeric, telomeric, or both portions of the KIR haplotype,129 current typing methodologies are generally unable to distinguish between the two loci, and population level data are a reflection of the presence or absence of the two alleles regardless of position in the haplotype. In African populations, the frequency of KIR2DS5, in parallel with the remaining telomeric B haplotype genes (KIR3DS1 and KIR2DS1) with which it is generally associated, is extremely low. In contrast, KIR2DS5 is almost always observed in Amerindian populations regardless of whether the locus is centromeric or telomeric in the KIR region and KIR2DS3 is largely absent in these populations.112,115,130 Notably, whereas KIR2DS3 is rarely seen in Amerindian populations, it is observed at moderate frequencies in East Asian populations, suggesting that the fixation of the KIR2DS5 allele at these loci occurred in conjunction with or subsequent to the New World migration and divergence of Amerindian populations.
Evolutionary interpretation: human migrations history versus selection
Meta-analyses of populations gathered worldwide from publications and the http://www.allelefrequencies.net database131 have shown that KIR polymorphism is correlated to geography,6,119,132 despite some limitations in the anthropological characterization of these data. For instance, gene presence/absence frequencies at activating loci (i.e. DS genes) and inhibitory loci (i.e. DL genes) linked to KIR haplotype B clearly reflect a geographical gradient among populations.133 However, the same study on inhibitory loci linked to KIR haplotype A did not show such a correlation. It is important to note that these meta-analyses are based on KIR gene content only, and do not take allelic variation into account, which may explain the different patterns observed between A and B haplotypes. Indeed, because of the polymorphism peculiarities of both haplotype groups (see above), gene content polymorphism for B-related loci appear to be sufficiently discriminative for population genetic comparisons, whereas similar analyses on A-related loci may rely on allelic typing. The study of a limited number of populations where KIR variations were examined at the allele level appears to corroborate this hypothesis.132 In light of these studies, KIR genes appear to be good markers for anthropological studies, similar to the polymorphisms of GM and HLA genes, and mtDNA and Y chromosome markers. However, more in-depth analyses, notably at the allelic level and including more populations with more thorough anthropological characterization, must be achieved to confirm this.
In addition to demographic factors and stochastic forces such as gene flow and genetic drift, KIR diversity is thought to have been shaped by various selective forces. The KIR inhibitory and activating receptors, among others, regulate NK cell functions134 and KIR gene content has been associated with infection, cancer, autoimmunity, pregnancy syndromes, and transplant outcome. These features are likely to make KIR a good candidate for ongoing adaptive evolution. In particular, balancing selection is proposed as the main force shaping the evolution of genes involved in innate135 and acquired immunity.136,137 These last few years, several lines of evidence for KIR selection, both at the haplotypic and the gene levels, have been discussed. For instance, it is proposed that some form of selection is acting to maintain a balance of both haplotype groups in humans. This reflects their biological relevance and complementary roles for the survival of human populations (i.e. the hypothesis implies that A haplotypes are more specialized towards immune defence, whereas B haplotypes are more specialized towards reproduction).138 Two studies using high-resolution allelic typing in Japanese139 and Irish,140 respectively, have shown that higher levels of polymorphism than expected under neutrality are observed both at the haplotypic and allelic level for several telomeric KIR genes (i.e. KIR2DL4, KIR3DL1 and KIR2DS4). This is consistent with an effect of balancing selection maintaining diversity and several haplotypic/allelic variants with intermediate frequencies in both populations. Furthermore, LD analysis suggests that these three loci form ‘core’ haplotypes with distinguishable functions depending on the alleles present at each locus (e.g. KIR3DL1 alleles have been subdivided into three main complementary lineages from a functional point of view128 and all three lineages are strongly represented in the Irish population). Conversely, centromeric genes specifying HLA-C receptors (i.e. KIR2DL1 and KIR2DL3) exhibit less diversity than expected under neutrality, suggesting that their alleles have been subject to positive directional selection. The model proposed here is that balancing selection is maintaining a pool of functionally divergent haplotypes and alleles upon which positive selection can operate.139
It is now widely accepted that KIR genes are co-evolving with their HLA ligands.110,112,139–141 Interestingly, many associations reported between KIR and HLA do differ between populations, which argues against universal selective pressures in diverse human populations for specific KIR–HLA combinations.140 Because of their functional interactions with KIR, as well as the fact that HLA genes are subject to balancing selection49 and have been studied more thoroughly for anthropological purposes, the latter genes may provide an outline with which to draw a clearer picture of the respective roles of human migrations history and selection for shaping KIR gene polymorphism. By maintaining high levels of diversity within populations, balancing selection of HLA genes is likely to lessen their genetic differentiation, as observed for the HLA-DRB1 locus in Africa, Europe and East Asia.48,91 However, although significant deviations from neutrality were reported by this study, this selective effect did not disrupt the high and significant correlation found between genetic and geographic distances at the world scale. This was recently confirmed by meta-analyses performed on HLA-A, -B and -DRB1 loci, where population comparisons showed that HLA genetic patterns were mostly shaped by geographic and linguistic differentiations,40,50 despite the excess of heterozygotes at these loci. As already mentioned, the preliminary results obtained for KIR genes at the worldwide scale suggest similar patterns to those found for HLA, but await confirmation through more thorough analyses.
Conclusion: contributions of immunogenetics to anthropological studies
In this article, we have summarized our current knowledge of the polymorphism of three immunogenetic complexes, GM, HLA and KIR, in relation to their diversity in human populations and the interpretation of that knowledge. Actually, these three genetic complexes represent a small fraction of our genome restricted to three different chromosomes. Likewise, studies of mtDNA and Y-chromosome markers, which have proved to be highly informative to reconstruct gender-specific molecular phylogenies of the human species (refs 142, 143, among many others) also correspond to minor DNA fractions (∼ 0·0005% of the total haploid genome, for mtDNA, and ∼ 2%, for the Y chromosome). By contrast, analyses of microsatellites and single nucleotide polymorphisms have provided relevant information on the entire genome (e.g. refs 144, 145). Impressive technical improvements now also allow high throughput DNA sequencing with promising genome-wide application to the study of human genetic variation worldwide, although this is still in the early stages. Therefore, the study of immunogenetic complexes may be seen as a limited contribution to our knowledge of human genome diversity. Another possible drawback of the analysis of immunogenetic markers in the field of anthropology is the fact that they are prone to natural selection, as discussed in the present review. As IgG, HLA and KIR molecules are instrumental in immune responses, their evolution is clearly influenced by environmental factors, which may be a disadvantage when one tries to reconstruct the peopling history of modern humans. Indeed, when selection is at work, the observed genetic relationships among human populations may not reflect their degree of historical relatedness, as can also be concluded for some highly variable phenotypic traits like human pigmentation.26,27 This would speak for neutral markers corresponding to non-coding regions of the genome, like microsatellites and single nucleotide polymorphisms, being preferred for genetic studies in anthropology.
On the other hand, general conclusions drawn by analysing the patterns of genetic diversity of widely studied immunogenetic markers, like GM and HLA, are shown to be congruent with those found for other genetic markers. This is the case for at least five major results.
Of the total genetic diversity of the human species, the highest level of variation is found within populations, whereas inter-population variation represents only a minor proportion of the total genetic variance. This reinforces the hypothesis, also held by a majority of palaeontologists, that all modern human populations share a recent common origin (at about 100 000–200 000 years before present, according to the fossil record), as opposed to multi-regionalist models claiming phylogenetic continuities between local Homo erectus and Homo sapiens in several regions of the world. We note, however, that the proportion of inter-population variation differs depending on the genetic system: it is around 15% for allozymes,24 most DNA markers,22,23 and HLA-DPB1,25,49 and is slightly lower for the other HLA loci (∼ 10% on average), but is notably higher for GM (∼ 46%, including ∼ 39% among geographic groups and ∼ 7% among populations within geographic groups).12 This may be the result, in the case of GM, of a bias in frequency estimation because of serological typing (as discussed above), although the effect of positive selection cannot be totally ruled out. In the case of HLA, we can conclude that balancing selection lowers inter-population variation although this effect is not very pronounced.
The highest level of genetic diversity is observed in East and Central East African populations; i.e. Ethiopian (and others like Kenyan and Tanzanian) populations speaking languages of the Afro-Asiatic family are highly diverse for both immunogenetic and other markers like GM, HLA and mtDNA.14,146 This suggests that East African populations underwent a huge demographic expansion leading to a significant diversification of their genetic pool. Actually, such an expansion appears to be very ancient compared with other regions of the world,16 which is compatible with the hypothesis of an origin of the modern humans’ diaspora in East Africa;
In contrast, Amerindians exhibit a low level of diversity, together with a high amount of differentiation among populations, for widely studied polymorphisms.147 This is also often the case for Oceanian populations, such as Taiwanese and Polynesians. This result is robust across all genetic polymorphisms, despite the maintenance of genetic variation through balancing selection for some immunogenetic systems like HLA. This means that in the case of the peopling of America and Oceania, genetic drift has been a main mechanism by which populations differentiated, because of small effective population sizes, although HLA traces of natural selection are suggested at the DNA level by the presence of a high diversity of rare HLA-B alleles and the abundance of molecularly distant alleles at all loci.
The global genetic variation is mainly structured by geography: recently, a highly comprehensive characterization of human genetic variation based on the study of 650 000 single nucleotide polymorphisms in 51 populations showed that the genetic pattern is continuous from one continent to another and may be explained by shared ancestry with continuous gene flow, except in a few cases where recent admixture may have occurred.148 The same conclusions have been drawn from the study of immunogenetic polymorphisms.10,12,88
Most polymorphisms exhibit genetic signatures of past cultural differentiations. Cases where genetic variation parallels linguistic diversity are common, e.g. at the continental level of sub-Saharan Africa, the genetic structure correlates with the linguistic structure for GM, HLA and Y-chromosome markers.15,149
Immunogenetics is therefore an informative tool in anthropology, despite the effect of natural selection, which is clearly demonstrated for HLA but appears to be weak. Moreover, the study of immunogenetic markers may provide important novel information for anthropological studies. Indeed, what is often considered to be a disadvantage in anthropological studies – a non-neutral mode of evolution of the studied polymorphisms – may be highly relevant to understanding complementary aspects of human evolution, like environmental changes. Relevant results obtained through computer simulation have recently been obtained by Currat et al.,91 who estimated an unequal coefficient of selection for HLA-DRB1 in Southwest European (0·7%) and Northwest African (1·9%) populations separated by the Strait of Gibraltar. This difference can be seen as a genetic signature of heterogeneous environments in the past, i.e. different pathogen richness or prevalence of specific infectious diseases in the two regions. Also, the case of Amerindians would deserve deeper investigation to understand the evolution of their peculiar HLA genetic profiles. This could also be carried out by simulating different scenarios taking into account both the initial settlement of America and its recent history marked by European colonization, which brought many new pathogens to this continent. The study of polymorphisms of important molecules for immune responses opens crucial areas of research in the field of human evolution, such as gene–pathogen co-evolution.
Acknowledgments
This work received financial support from the Swiss National Science Foundation (SNF, Switzerland) grants no. 3100A0—112651 and 31003A—127465 (A.S.M.), the ESF (Europe) COST grant of Action BM0803 ‘HLA-NET’ (A.S.M.), the Oslo University Hospital Rikshospitalet, and Medinova (E.T.), and the US National Institute of Health Grant no. AI067068 (J.A.H. and S.J.M.).
Disclosures
The authors declare no conflicts of interests.
References
- 1.Owen R. Karl Landsteiner and the first human marker locus. Genetics. 2000;155:995–8. doi: 10.1093/genetics/155.3.995. [DOI] [PMC free article] [PubMed] [Google Scholar]
- 2.Mourant AE. The Distribution of the Human Blood Groups. Oxford: Blackwell; 1954. [Google Scholar]
- 3.Grubb R. Agglutination of erythrocytes coated with “incomplete” anti-Rh by certain rheumatoid arthritic sera and some other sera. The existence of human serum groups. Acta Pathol Microbiol Scand. 1956;39:195–7. [PubMed] [Google Scholar]
- 4.Steinberg A, Cook C. The Distribution of Human Immunoglobulin Allotypes. Oxford, New-York: Oxford University Press; 1981. [Google Scholar]
- 5.Dausset J. Iso-leuco-anticorps. Acta Haematol. 1958;20:156–66. doi: 10.1159/000205478. [DOI] [PubMed] [Google Scholar]
- 6.Middleton D, Gonzelez F. The extensive polymorphism of KIR genes. Immunology. 2010;129:8–19. doi: 10.1111/j.1365-2567.2009.03208.x. [DOI] [PMC free article] [PubMed] [Google Scholar]
- 7.Horuk R, Chitnis CE, Darbonne WC, Colby TJ, Rybicki A, Hadley TJ, Miller LH. A receptor for the malarial parasite Plasmodium vivax: the erythrocyte chemokine receptor. Science. 1993;261:1182–4. doi: 10.1126/science.7689250. [DOI] [PubMed] [Google Scholar]
- 8.Kawashima Y, Pfafferott K, Frater J, et al. Adaptation of HIV-1 to human leukocyte antigen class I. Nature. 2009;458:641–5. doi: 10.1038/nature07746. Epub 2009 Feb 25. [DOI] [PMC free article] [PubMed] [Google Scholar]
- 9.Cavalli-Sforza LL, Bodmer WL. The Genetics of Human Populations. San Francisco: W.H. Freeman and Co; 1971. [Google Scholar]
- 10.Cavalli-Sforza LL, Menozzi P, Piazza A. The History and Geography of Human Genes. Princeton, New Jersey: Princeton University Press; 1994. [Google Scholar]
- 11.Jefferis R, Lefranc MP. Human immunoglobulin allotypes: possible implications for immunogenicity. MAbs. 2009;1:332–8. doi: 10.4161/mabs.1.4.9122. [DOI] [PMC free article] [PubMed] [Google Scholar]
- 12.Dugoujon JM, Hazout S, Loirat F, Mourrieras B, Crouau-Roy B, Sanchez-Mazas A. GM haplotype diversity of 82 populations over the world suggests a centrifugal model of human migrations. Am J Phys Anthropol. 2004;125:175–92. doi: 10.1002/ajpa.10405. [DOI] [PubMed] [Google Scholar]
- 13.Excoffier L, Harding R, Sokal RR, Pellegrini B, Sanchez-Mazas A. Spatial differentiation of RH and GM haplotype frequencies in Sub-Saharan Africa and its relation to linguistic affinities. Hum Biol. 1991;63:3. [PubMed] [Google Scholar]
- 14.Excoffier L, Pellegrini P, Sanchez-Mazas A, Simon C, Langaney A. Genetics and history of Sub-Saharan Africa. Y Phys Anthrop. 1987;30:151–94. [Google Scholar]
- 15.Sanchez-Mazas A, Poloni ES. Encyclopedia of Life Science (ELS) Chichester: John Wiley & Sons, Ltd; Genetic Diversity in Africa. DOI: 10.1002/9780470015902.a0020800. [Google Scholar]
- 16.Excoffier L, Schneider S. Why hunter-gatherer populations do not show signs of pleistocene demographic expansions. Proc Natl Acad Sci USA. 1999;96:10597–602. doi: 10.1073/pnas.96.19.10597. [DOI] [PMC free article] [PubMed] [Google Scholar]
- 17.Poloni ES, Sanchez-Mazas A, Jacques G, Sagart L. Comparing linguistic and genetic relationships among East Asian populations: a study of the RH and GM polymorphisms. In: Sagart L, Blench R, Sanchez-Mazas A, editors. The Peopling of East Asia: Putting Together Archaeology, Linguistics and Genetics. London & New York: RoutledgeCurzon; 2005. pp. 252–72. [Google Scholar]
- 18.Sanchez-Mazas A. Evidences génétiques du peuplement de l’Asie orientale. Arch des Sci. 2008;61:53–68. [Google Scholar]
- 19.Di D, Sanchez-Mazas A. Challenging views on the peopling history of East Asia: the story according to HLA markers. Am J Phys Anthropol. 2011 doi: 10.1002/ajpa.21470. 144, doi: 10.1002/ajpa.21470. [DOI] [PubMed] [Google Scholar]
- 20.Sanchez-Mazas A, Osipova L, Dugoujon J-M, Sagart L, Poloni ES. The GM genetic polymorphism in Taiwan aborigines: new data revealing remarkable differentiation patterns. In: Sanchez-Mazas A, Blench R, Ross M, Peiros I, Lin M, editors. Past Human Migrations in East Asia: Matching Archaeology, Linguistics and Genetics. London, New York: Routledge; 2008. pp. 313–33. [Google Scholar]
- 21.Sagart L. The higher phylogeny of Austronesian and the position of Tai-Kadai. Oceanic Linguistics. 2004;43:411–44. [Google Scholar]
- 22.Barbujani G, Magagni A, Minch E, Cavalli-Sforza LL. An apportionment of human DNA diversity. Proc Natl Acad Sci USA. 1997;94:4516–9. doi: 10.1073/pnas.94.9.4516. [DOI] [PMC free article] [PubMed] [Google Scholar]
- 23.Excoffier L, Hamilton G. Comment on “Genetic structure of human populations”. Science. 2003;300:1877. doi: 10.1126/science.1083411. author reply. [DOI] [PubMed] [Google Scholar]
- 24.Lewontin R. The appointment of human diversity. Evol Biol. 1972;6:381–98. [Google Scholar]
- 25.Sanchez-Mazas A. An apportionment of human HLA diversity. Tissue Antigens. 2007;69(Suppl 1):198–202. doi: 10.1111/j.1399-0039.2006.00802.x. [DOI] [PubMed] [Google Scholar]
- 26.Relethford JH. Apportionment of global human genetic diversity based on craniometrics and skin color. Am J Phys Anthropol. 2002;118:393–8. doi: 10.1002/ajpa.10079. [DOI] [PubMed] [Google Scholar]
- 27.Relethford JH. Race and global patterns of phenotypic variation. Am J Phys Anthropol. 2009;139:16–22. doi: 10.1002/ajpa.20900. [DOI] [PubMed] [Google Scholar]
- 28.Dugoujon JM, Cambon-Thomsen A. Immunoglobulin allotypes (GM and KM) and their interactions with HLA antigens in autoimmune diseases: a review. Autoimmunity. 1995;22:245–60. doi: 10.3109/08916939508995322. [DOI] [PubMed] [Google Scholar]
- 29.Dugoujon JM, Guitard E, Senegas MT. Gm and Km allotypes in autoimmune diseases. G Ital Cardiol. 1992;22:85–95. [PubMed] [Google Scholar]
- 30.Migot-Nabias F, Noukpo JM, Guitard E, Doritchamou J, Garcia A, Dugoujon JM. Imbalanced distribution of GM immunoglobulin allotypes according to the clinical presentation of Plasmodium falciparum malaria in Beninese children. J Infect Dis. 2008;198:1892–5. doi: 10.1086/593210. [DOI] [PubMed] [Google Scholar]
- 31.Piazza A, Van Loghem E, De Lange G, Curtoni ES, Ulizzi L, Terrenato L. Immunoglobulin allotypes in Sardinia. Am J Hum Genet. 1976;28:77–86. [PMC free article] [PubMed] [Google Scholar]
- 32.Schanfield MS, Ohkura K, Lin M, Shyu R, Gershowitz H. Immunoglobulin allotypes among Taiwan aborigines: evidence of malarial selection could affect studies of population affinity. Hum Biol. 2002;74:363–79. doi: 10.1353/hub.2002.0033. [DOI] [PubMed] [Google Scholar]
- 33.Kron MA, Ramirez B, Belizario V, Jr, Pandey JP. Immunoglobulin allotypes among the Bicolanos of Sorsogon province, Luzon, Philippines: implications of phenotypes for filariasis. Exp Clin Immunogenet. 1999;16:65–71. doi: 10.1159/000019097. [DOI] [PubMed] [Google Scholar]
- 34.Dard P, Lefranc M-P, Osipova L, Sanchez-Mazas A. DNA sequence variability of IGHG3 alleles associated to the main G3m haplotypes in human populations. Eur J Hum Genet. 2001;9:765–72. doi: 10.1038/sj.ejhg.5200700. [DOI] [PubMed] [Google Scholar]
- 35.Underhill PA, Passarino G, Lin AA, Shen P, Mirazon Lahr M, Foley RA, Oefner PJ, Cavalli-Sforza LL. The phylogeography of Y chromosome binary haplotypes and the origins of modern human populations. Ann Hum Genet. 2001;1:43–62. doi: 10.1046/j.1469-1809.2001.6510043.x. [DOI] [PubMed] [Google Scholar]
- 36.Hammer MF, Karafet TM, Redd AJ, Jarjanazi H, Santachiara-Benerecetti S, Soodyall H, Zegura SL. Hierarchical patterns of global human Y-chromosome diversity. Mol Biol Evol. 2001;18:1189–203. doi: 10.1093/oxfordjournals.molbev.a003906. [DOI] [PubMed] [Google Scholar]
- 37.Mehra NK. The HLA Complex in Biology and Medicine. New Delhi: Jaypee Brothers Medical Publishers (P) LTD; 2010. [Google Scholar]
- 38.Gaudieri S, Dawkins RL, Habara K, Kulski JK, Gojobori T. SNP profile within the human major histocompatibility complex reveals an extreme and interrupted level of nucleotide diversity. Genome Res. 2000;10:1579–86. doi: 10.1101/gr.127200. [DOI] [PMC free article] [PubMed] [Google Scholar]
- 39.Robinson J, Mistry K, McWilliam H, Lopez R, Parham P, Marsh SG. The IMGT/HLA database. Nucleic Acids Res. 2010;11:11. [Google Scholar]
- 40.Buhler S. Etude du polymorphisme moléculaire des gènes HLA de classes I et II à l’échelle mondiale: analyse de la diversité nucléotidique dans les populations. Geneva, Switzerland: Department of Anthropology, University of Geneva; 2007. [Google Scholar]
- 41.Englehard V. Structure of peptides associated with class I and II MHC molecules. Annu Rev Immunol. 1994;12:181–207. doi: 10.1146/annurev.iy.12.040194.001145. [DOI] [PubMed] [Google Scholar]
- 42.Fernandez-Vina MA, Falco M, Gao X, Cerna M, Sun Y, Raimondi E, Stastny P. DQA1*03 subtypes have different associations with DRB1 and DQB1 alleles. Hum Immunol. 1994;39:290–8. doi: 10.1016/0198-8859(94)90272-0. [DOI] [PubMed] [Google Scholar]
- 43.Fernandez-Vina MA, Gao XJ, Moraes ME, et al. Alleles at four HLA class II loci determined by oligonucleotide hybridization and their associations in five ethnic groups. Immunogenetics. 1991;34:299–312. doi: 10.1007/BF00211994. [DOI] [PubMed] [Google Scholar]
- 44.Cano P, Klitz W, Mack SJ, et al. Common and well-documented HLA alleles: report of the Ad-Hoc committee of the American Society for Histocompatiblity and Immunogenetics. Hum Immunol. 2007;68:392–417. doi: 10.1016/j.humimm.2007.01.014. Epub 2007 Feb 15. [DOI] [PubMed] [Google Scholar]
- 45.Middleton D, Gonzalez F, Fernandez-Vina M, et al. A bioinformatics approach to ascertaining the rarity of HLA alleles. Tissue Antigens. 2009;74:480–5. doi: 10.1111/j.1399-0039.2009.01361.x. Epub 2009 Sep 29. [DOI] [PubMed] [Google Scholar]
- 46.Meyer D, Single RM, Mack SJ, Erlich HA, Thomson G. Signatures of demographic history and natural selection in the human major histocompatibility complex Loci. Genetics. 2006;173:2121–42. doi: 10.1534/genetics.105.052837. [DOI] [PMC free article] [PubMed] [Google Scholar]
- 47.Salamon H, Klitz W, Easteal S, et al. Evolution of HLA class II molecules: allelic and amino acid site variability across populations. Genetics. 1999;152:393–400. doi: 10.1093/genetics/152.1.393. [DOI] [PMC free article] [PubMed] [Google Scholar]
- 48.Sanchez-Mazas A. African diversity from the HLA point of view: influence of genetic drift, geography, linguistics, and natural selection. Hum Immunol. 2001;62:937–48. doi: 10.1016/s0198-8859(01)00293-2. [DOI] [PubMed] [Google Scholar]
- 49.Solberg OD, Mack SJ, Lancaster AK, Single RM, Tsai Y, Sanchez-Mazas A, Thomson G. Balancing selection and heterogeneity across the classical human leukocyte antigen loci: a meta-analytic review of 497 population studies. Hum Immunol. 2008;69:443–64. doi: 10.1016/j.humimm.2008.05.001. [DOI] [PMC free article] [PubMed] [Google Scholar]
- 50.Nunes JM, Riccio ME, Buhler S, et al. Analysis of the HLA population data (AHPD) submitted to the 15th International Histocompatibility/Immunogenetics Workshop by using the Gene[rate] computer tools accommodating ambiguous data (AHPD project report) Tissue Antigens. 2010;76:18–30. doi: 10.1111/j.1399-0039.2010.01469.x. [DOI] [PubMed] [Google Scholar]
- 51.Buhler S, Sanchez-Mazas A. HLA DNA sequence variation among human populations: molecular signatures of demographic and selective events. PLoS ONE. 2011;6:e14643. doi: 10.1371/journal.pone.0014643. [DOI] [PMC free article] [PubMed] [Google Scholar]
- 52.Hughes AL, Nei M. Pattern of nucleotide substitution at major histocompatibility complex class I loci reveals overdominant selection. Nature. 1988;335:167–70. doi: 10.1038/335167a0. [DOI] [PubMed] [Google Scholar]
- 53.Hughes AL, Nei M. Nucleotide substitution at major histocompatibility complex class II loci: evidence for overdominant selection. Proc Natl Acad Sci USA. 1989;86:958–62. doi: 10.1073/pnas.86.3.958. [DOI] [PMC free article] [PubMed] [Google Scholar]
- 54.Satta Y, O'HUigin C, Takahata N, Klein J. Intensity of natural selection at the major histocompatibility complex loci. Proc Natl Acad Sci USA. 1994;91:7184–8. doi: 10.1073/pnas.91.15.7184. [DOI] [PMC free article] [PubMed] [Google Scholar]
- 55.Slatkin M, Muirhead CA. A method for estimating the intensity of overdominant selection from the distribution of allele frequencies. Genetics. 2000;156:2119–26. doi: 10.1093/genetics/156.4.2119. [DOI] [PMC free article] [PubMed] [Google Scholar]
- 56.Belich MP, Madrigal JA, Hildebrand WH, Zemmour J, Williams RC, Luz R, Petzl-Erler ML, Parham P. Unusual HLA-B alleles in two tribes of Brazilian Indians. Nature. 1992;357:326–9. doi: 10.1038/357326a0. [DOI] [PubMed] [Google Scholar]
- 57.Fernandez-Vina MA, Lazaro AM, Marcos CY, Nulf C, Raimondi E, Haas EJ, Stastny P. Dissimilar evolution of B-locus versus A-locus and class II loci of the HLA region in South American Indian tribes. Tissue Antigens. 1997;50:233–50. doi: 10.1111/j.1399-0039.1997.tb02867.x. [DOI] [PubMed] [Google Scholar]
- 58.Lazaro AM, Moraes ME, Marcos CY, Moraes JR, Fernandez-Vina MA, Stastny P. Evolution of HLA-class I compared to HLA-class II polymorphism in Terena, a South-American Indian tribe. Hum Immunol. 1999;60:1138–49. doi: 10.1016/s0198-8859(99)00092-0. [DOI] [PubMed] [Google Scholar]
- 59.Parham P, Arnett KL, Adams EJ, et al. Episodic evolution and turnover of HLA-B in the indigenous human populations of the Americas. Tissue Antigens. 1997;50:219–32. doi: 10.1111/j.1399-0039.1997.tb02866.x. [DOI] [PubMed] [Google Scholar]
- 60.Watkins DI, McAdam SN, Liu X, et al. New recombinant HLA-B alleles in a tribe of South American Amerindians indicate rapid evolution of MHC class I loci. Nature. 1992;357:329–33. doi: 10.1038/357329a0. [DOI] [PubMed] [Google Scholar]
- 61.Kwok WW, Kovats S, Thurtle P, Nepom GT. HLA-DQ allelic polymorphisms constrain patterns of class II heterodimer formation. J Immunol. 1993;150:2263–72. [PubMed] [Google Scholar]
- 62.Kwok WW, Nepom GT, Raymond FC. HLA-DQ polymorphisms are highly selective for peptide binding interactions. J Immunol. 1995;155:2468–76. [PubMed] [Google Scholar]
- 63.Ries F. Etude du polymorphisme HLA-DRB1 de trois populations éthiopiennes et d'autres populations africaines. Geneva, Switzerland: Department of Anthropology, University of Geneva; 2009. [Google Scholar]
- 64.Nunes J-M, Riccio ME, Buhler S, et al. Analysis of HLA population data (AHPD) submitted to the 15th International Histocompatibility/Immunogenetics Workshop by using the GENE[RATE] computer tools accommodating ambiguous data (AHPD project report) Tissue Antigens. 2010;76:18–30. doi: 10.1111/j.1399-0039.2010.01469.x. [DOI] [PubMed] [Google Scholar]
- 65.Sanchez-Mazas A. African diversity from the HLA point of view: influence of genetic drift, geography, linguistics, and natural selection. Hum Immunol. 2001;62:937–48. doi: 10.1016/s0198-8859(01)00293-2. [DOI] [PubMed] [Google Scholar]
- 66.Buhler S, Megarbane A, Lefranc G, Tiercy J-M. HLA-C molecular characterization of a Lebanese population and genetic structure of 39 populations from Europe to India-Pakistan. Tissue Antigens. 2006;68:44–57. doi: 10.1111/j.1399-0039.2006.00621.x. [DOI] [PubMed] [Google Scholar]
- 67.Sanchez-Mazas A, Buhler S. Structure génétique des populations du pourtour méditerranéen d'après les polymorphismes GM et HLA-DRB1. In: Serageldin I, Crubézy E, Gibert M, El-Faham M, editors. Le peuplement de la Méditerranée: Synthèse et questions d'avenir. Alexandria: Bibliotheca Alexandrina; 2009. pp. 15–32. [Google Scholar]
- 68.Mazurié de Keroualin K. Genèse et diffusion de l'agriculture en Europe: agriculteurs, chasseurs, pasteurs. Paris: Errance; 2003. [Google Scholar]
- 69.Guilaine J. De la vague à la tombe : la conquête néolithique de la Méditerranée (8000–2000 avant J.-C.) Paris: Ed. du Seuil.; 2003. [Google Scholar]
- 70.Chikhi L, Destro-Bisol G, Bertorelle G, Pascali V, Barbujani G. Clines of nuclear DNA markers suggest a largely neolithic ancestry of the European gene pool. Proc Natl Acad Sci USA. 1998;95:9053–8. doi: 10.1073/pnas.95.15.9053. [DOI] [PMC free article] [PubMed] [Google Scholar]
- 71.Pinhasi R, Fort J, Ammerman AJ. Tracing the origin and spread of agriculture in Europe. PLoS Biol. 2005;3:e410. doi: 10.1371/journal.pbio.0030410. Epub 2005 Nov 29. [DOI] [PMC free article] [PubMed] [Google Scholar]
- 72.Harbo HF, Riccio E, Lorentzen AR, et al. Norwegian Sami differ significantly from other Norwegians according to their HLA profile. Tissue Antigens. 2009;75:207–17. doi: 10.1111/j.1399-0039.2009.01425.x. [DOI] [PubMed] [Google Scholar]
- 73.Comas D, Calafell F, Mateu E, Perez-Lezaun A, Bertranpetit J. HLA evidence for the lack of genetic heterogeneity in Basques. Ann Hum Genet. 1998;62:123–32. doi: 10.1046/j.1469-1809.1998.6220123.x. [DOI] [PubMed] [Google Scholar]
- 74.Comas D, Mateu E, Calafell F, Pérez-Lezaun A, Bosch E, Martínez-Arias R, Bertranpetit J. HLA class I and class II DNA typing and the origin of Basques. Tissue Antigens. 1998;51:30–40. doi: 10.1111/j.1399-0039.1998.tb02944.x. [DOI] [PubMed] [Google Scholar]
- 75.Laayouni H, Calafell F, Bertranpetit J. A genome-wide survey does not show the genetic distinctiveness of Basques. Hum Genet. 2010;127:455–8. doi: 10.1007/s00439-010-0798-3. Epub 2010 Feb 16. [DOI] [PubMed] [Google Scholar]
- 76.Abdulla MA, Ahmed I, Assawamakin A, et al. Mapping human genetic diversity in Asia. Science. 2009;326:1541–5. doi: 10.1126/science.1177074. [DOI] [PubMed] [Google Scholar]
- 77.Ding YC, Wooding S, Harpending HC, et al. Population structure and history in East Asia. Proc Natl Acad Sci USA. 2000;97:14003–6. doi: 10.1073/pnas.240441297. [DOI] [PMC free article] [PubMed] [Google Scholar]
- 78.Mack SJ, Bugawan TL, Moonsamy PV, et al. Evolution of Pacific/Asian populations inferred from HLA class II allele frequency distributions. Tissue Antigens. 2000;55:383–400. doi: 10.1034/j.1399-0039.2000.550501.x. [DOI] [PubMed] [Google Scholar]
- 79.Sanchez-Mazas A, Poloni ES, Jacques G, Sagart L. HLA genetic diversity and linguistic variation in East Asia. In: Sagart L, Blench R, Sanchez-Mazas A, editors. The Peopling of East Asia: Putting Together Archaeology, Linguistics and Genetics. London & New York: RoutledgeCurzon; 2005. pp. 273–96. [Google Scholar]
- 80.Lin M, Chu C-C, Broadberry RE, Yu L-C, Loo J-H, Trejaut JA. Genetic diversity of Taiwan's indigenous people: possible relationship with insular Southeast Asia. In: Sagart L, Blench R, Sanchez-Mazas A, editors. The Peopling of East Asia: Putting Together Archaeology, Linguistics and Genetics. London & New York: RoutledgeCurzon; 2005. pp. 230–47. [Google Scholar]
- 81.Cerna M, Falco M, Friedman H, Raimondi E, Maccagno A, Fernandez-Vina M, Stastny P. Differences in HLA class II alleles of isolated South American Indian populations from Brazil and Argentina. Hum Immunol. 1993;37:213–20. doi: 10.1016/0198-8859(93)90504-t. [DOI] [PubMed] [Google Scholar]
- 82.Fernandez-Vina M, Moraes JR, Moraes ME, Miller S, Stastny P. HLA class II haplotypes in Amerindians and in black North and South Americans. Tissue Antigens. 1991;38:235–7. doi: 10.1111/j.1399-0039.1991.tb01904.x. [DOI] [PubMed] [Google Scholar]
- 83.Hollenbach JA, Thomson G, Cao K, et al. HLA diversity, differentiation, and haplotype evolution in Mesoamerican Natives. Hum Immunol. 2001;62:378–90. doi: 10.1016/s0198-8859(01)00212-9. [DOI] [PubMed] [Google Scholar]
- 84.Trachtenberg EA, Erlich HA, Rickards O, DeStefano GF, Klitz W. HLA class II linkage disequilibrium and haplotype evolution in the Cayapa Indians of Ecuador. Am J Hum Genet. 1995;57:415–24. [PMC free article] [PubMed] [Google Scholar]
- 85.Thorsby E. Evidence of an early Amerindian contribution to the Polynesian gene pool on Easter Island. In: Wallin P, Martinsson-Wallin H, editors. Selected Papers from the VII International Conference on Easter Island and the Pacific: Migration, Identity and Cultural Heritage. Visby: Gotland University Press; 2010. pp. 285–95. [Google Scholar]
- 86.Thorsby E, Flam ST, Woldseth B, Dupuy BM, Sanchez-Mazas A, Fernandez-Vina MA. Further evidence of an Amerindian contribution to the Polynesian gene pool on Easter Island. Tissue Antigens. 2009;73:582–5. doi: 10.1111/j.1399-0039.2009.01233.x. [DOI] [PubMed] [Google Scholar]
- 87.Lie BA, Dupuy BM, Spurkland A, Fernandez-Vina MA, Hagelberg E, Thorsby E. Molecular genetic studies of natives on Easter Island: evidence of an early European and Amerindian contribution to the Polynesian gene pool. Tissue Antigens. 2007;69:10–8. doi: 10.1111/j.1399-0039.2006.00717.x. [DOI] [PubMed] [Google Scholar]
- 88.Sanchez-Mazas A. International Histocompatibility Workshop Anthropology/Human Genetic Diversity Joint Report. Chapter 7: HLA genetic differentiation of the 13th IHWC population data relative to worldwide linguistic families. In: Hansen JA, editor. Immunobiology of the Human MHC: Proceedings of the 13th International Histocompatibility Workshop and Conference. Vol. 1. Seattle, WA: IHWG Press; 2007. p. 1. [Google Scholar]
- 89.Takahata N, Satta Y, Klein J. Polymorphism and balancing selection at major histocompatibility complex loci. Genetics. 1992;130:925–38. doi: 10.1093/genetics/130.4.925. [DOI] [PMC free article] [PubMed] [Google Scholar]
- 90.Klein J, Satta Y, O'HUigin C, Takahata N. The molecular descent of the major histocompatibility complex. Annu Rev Immunol. 1993;11:269–95. doi: 10.1146/annurev.iy.11.040193.001413. [DOI] [PubMed] [Google Scholar]
- 91.Currat M, Poloni ES, Sanchez-Mazas A. Human genetic differentiation across the Strait of Gibraltar. BMC Evol Biol. 2010;10:237. doi: 10.1186/1471-2148-10-237. [DOI] [PMC free article] [PubMed] [Google Scholar]
- 92.Meyer D, Thomson G. How selection shapes variation of the human major histocompatibility complex: a review. Ann Hum Genet. 2001;65:1–26. doi: 10.1046/j.1469-1809.2001.6510001.x. [DOI] [PubMed] [Google Scholar]
- 93.Prugnolle F, Manica A, Charpentier M, Guegan JF, Guernier V, Balloux F. Pathogen-driven selection and worldwide HLA class I diversity. Curr Biol. 2005;15:1022–7. doi: 10.1016/j.cub.2005.04.050. [DOI] [PubMed] [Google Scholar]
- 94.Saunders MA, Slatkin M, Garner C, Hammer MF, Nachman MW. The extent of linkage disequilibrium caused by selection on G6PD in humans. Genetics. 2005;171:1219–29. doi: 10.1534/genetics.105.048140. Epub 2005 Jul 14. [DOI] [PMC free article] [PubMed] [Google Scholar]
- 95.Blum KS, Pabst R. Lymphocyte numbers and subsets in the human blood. Do they mirror the situation in all organs? Immunol Lett. 2007;108:45–51. doi: 10.1016/j.imlet.2006.10.009. [DOI] [PubMed] [Google Scholar]
- 96.Lanier LL. Evolutionary struggles between NK cells and viruses. Nat Rev Immunol. 2008;8:259–68. doi: 10.1038/nri2276. [DOI] [PMC free article] [PubMed] [Google Scholar]
- 97.Ljunggren HG, Karre K. In search of the ‘missing self’: MHC molecules and NK cell recognition. Immunol Today. 1990;11:237–44. doi: 10.1016/0167-5699(90)90097-s. [DOI] [PubMed] [Google Scholar]
- 98.Lanier LL. NK cell recognition. Annu Rev Immunol. 2005;23:225–74. doi: 10.1146/annurev.immunol.23.021704.115526. [DOI] [PubMed] [Google Scholar]
- 99.Vilches C, Parham P. KIR: diverse, rapidly evolving receptors of innate and adaptive immunity. Annu Rev Immunol. 2002;20:217–51. doi: 10.1146/annurev.immunol.20.092501.134942. [DOI] [PubMed] [Google Scholar]
- 100.Colonna M. Specificity and function of immunoglobulin superfamily NK cell inhibitory and stimulatory receptors. Immunol Rev. 1997;155:127–33. doi: 10.1111/j.1600-065x.1997.tb00945.x. [DOI] [PubMed] [Google Scholar]
- 101.Thananchai H, Gillespie G, Martin MP, et al. Cutting Edge: allele-specific and peptide-dependent interactions between KIR3DL1 and HLA-A and HLA-B. J Immunol. 2007;178:33–7. doi: 10.4049/jimmunol.178.1.33. [DOI] [PubMed] [Google Scholar]
- 102.Pende D, Biassoni R, Cantoni C, et al. The natural killer cell receptor specific for HLA-A allotypes: a novel member of the p58/p70 family of inhibitory receptors that is characterized by three immunoglobulin-like domains and is expressed as a 140-kD disulphide-linked dimer. J Exp Med. 1996;184:505–18. doi: 10.1084/jem.184.2.505. [DOI] [PMC free article] [PubMed] [Google Scholar]
- 103.Moffett-King A. Natural killer cells and pregnancy. Nat Rev Immunol. 2002;2:656–63. doi: 10.1038/nri886. [DOI] [PubMed] [Google Scholar]
- 104.Hsu KC, Liu XR, Selvakumar A, Mickelson E, O'Reilly RJ, Dupont B. Killer Ig-like receptor haplotype analysis by gene content: evidence for genomic diversity with a minimum of six basic framework haplotypes, each with multiple subsets. J Immunol. 2002;169:5118–29. doi: 10.4049/jimmunol.169.9.5118. [DOI] [PubMed] [Google Scholar]
- 105.Wilson MJ, Torkar M, Haude A, Milne S, Jones T, Sheer D, Beck S, Trowsdale J. Plasticity in the organization and sequences of human KIR/ILT gene families. Proc Natl Acad Sci USA. 2000;97:4778–83. doi: 10.1073/pnas.080588597. [DOI] [PMC free article] [PubMed] [Google Scholar]
- 106.Williams F, Maxwell LD, Halfpenny IA, Meenagh A, Sleator C, Curran MD, Middleton D. Multiple copies of KIR 3DL/S1 and KIR 2DL4 genes identified in a number of individuals. Hum Immunol. 2003;64:729–32. doi: 10.1016/s0198-8859(03)00089-2. [DOI] [PubMed] [Google Scholar]
- 107.Traherne JA, Martin M, Ward R, et al. Mechanisms of copy number variation and hybrid gene formation in the KIR immune gene complex. Hum Mol Genet. 2010;19:737–51. doi: 10.1093/hmg/ddp538. [DOI] [PMC free article] [PubMed] [Google Scholar]
- 108.Valiante NM, Uhrberg M, Shilling HG, et al. Functionally and structurally distinct NK cell receptor repertoires in the peripheral blood of two human donors. Immunity. 1997;7:739–51. doi: 10.1016/s1074-7613(00)80393-3. [DOI] [PubMed] [Google Scholar]
- 109.Ashouri E, Farjadian S, Reed EF, Ghaderi A, Rajalingam R. KIR gene content diversity in four Iranian populations. Immunogenetics. 2009;61:483–92. doi: 10.1007/s00251-009-0378-7. [DOI] [PMC free article] [PubMed] [Google Scholar]
- 110.Single RM, Martin MP, Gao X, Meyer D, Yeager M, Kidd J, Kidd KK, Carrington M. Global diversity and evidence for co-evolution of KIR and HLA genes. Nat Genet. 2007;39:1114–9. doi: 10.1038/ng2077. [DOI] [PubMed] [Google Scholar]
- 111.Yawata M, Yawata N, Abi-Rached L, Parham P. Variation within the human killer cell immunoglobulin-like receptor (KIR) gene family. Crit Rev Immunol. 2002;6:463–82. [PubMed] [Google Scholar]
- 112.Hollenbach JA, Meenagh A, Sleator C, et al. Report from the killer immunoglobulin-like receptor (KIR) anthropology component of the 15th International Histocompatibility Workshop: worldwide variation in the KIR loci and further evidence for the co-evolution of KIR and HLA. Tissue Antigens. 2010;76:9–17. doi: 10.1111/j.1399-0039.2010.01459.x. [DOI] [PubMed] [Google Scholar]
- 113.Denis L, Sivula J, Gourraud PA, et al. Genetic diversity of KIR natural killer cell markers in populations from France, Guadeloupe, Finland, Senegal and Reunion. Tissue Antigens. 2005;66:267–76. doi: 10.1111/j.1399-0039.2005.00473.x. [DOI] [PubMed] [Google Scholar]
- 114.Single RM, Martin MP, Meyer D, Gao X, Carrington M. Methods for assessing gene content diversity of KIR with examples from a global set of populations. Immunogenetics. 2008;60:711–25. doi: 10.1007/s00251-008-0331-1. [DOI] [PMC free article] [PubMed] [Google Scholar]
- 115.Gendzekhadze K, Norman PJ, Abi-Rached L, Layrisse Z, Parham P. High KIR diversity in Amerindians is maintained using few gene-content haplotypes. Immunogenetics. 2006;58:474–80. doi: 10.1007/s00251-006-0108-3. [DOI] [PubMed] [Google Scholar]
- 116.Ewerton PD, Leite Mde M, Magalhaes M, Sena L, Melo dos Santos EJ. Amazonian Amerindians exhibit high variability of KIR profiles. Immunogenetics. 2007;59:625–30. doi: 10.1007/s00251-007-0229-3. [DOI] [PubMed] [Google Scholar]
- 117.Toneva M, Lepage V, Lafay G, et al. Genomic diversity of natural killer cell receptor genes in three populations. Tissue Antigens. 2001;57:358–62. doi: 10.1034/j.1399-0039.2001.057004358.x. [DOI] [PubMed] [Google Scholar]
- 118.Kulkarni S, Single RM, Martin MP, Rajalingam R, Badwe R, Joshi N, Carrington M. Comparison of the rapidly evolving KIR locus in Parsis and natives of India. Immunogenetics. 2008;4:121–9. doi: 10.1007/s00251-008-0279-1. [DOI] [PubMed] [Google Scholar]
- 119.Rajalingam R, Du Z, Meenagh A, et al. Distinct diversity of KIR genes in three southern Indian populations: comparison with world populations revealed a link between KIR gene content and pre-historic human migrations. Immunogenetics. 2008;60:207–17. doi: 10.1007/s00251-008-0286-2. [DOI] [PubMed] [Google Scholar]
- 120.Rajalingam R, Krausa P, Shilling HG, et al. Distinctive KIR and HLA diversity in a panel of north Indian Hindus. Immunogenetics. 2002;53:1009–19. doi: 10.1007/s00251-001-0425-5. [DOI] [PubMed] [Google Scholar]
- 121.Jiang K, Zhu FM, Lv QF, Yan LX. Distribution of killer cell immunoglobulin-like receptor genes in the Chinese Han population. Tissue Antigens. 2005;65:556–63. doi: 10.1111/j.1399-0039.2005.00412.x. [DOI] [PubMed] [Google Scholar]
- 122.Whang DH, Park H, Yoon JA, Park MH. Haplotype analysis of killer cell immunoglobulin-like receptor genes in 77 Korean families. Hum Immunol. 2005;66:146–54. doi: 10.1016/j.humimm.2004.10.013. [DOI] [PubMed] [Google Scholar]
- 123.Yawata M, Yawata N, McQueen KL, Cheng NW, Guethlein LA, Rajalingam R, Shilling HG, Parham P. Predominance of group A KIR haplotypes in Japanese associated with diverse NK cell repertoires of KIR expression. Immunogenetics. 2002;54:543–50. doi: 10.1007/s00251-002-0497-x. [DOI] [PubMed] [Google Scholar]
- 124.Gourraud PA, Meenagh A, Cambon-Thomsen A, Middleton D. Linkage disequilibrium organization of the human KIR superlocus: implications for KIR data analyses. Immunogenetics. 2010;12:729–40. doi: 10.1007/s00251-010-0478-4. [DOI] [PMC free article] [PubMed] [Google Scholar]
- 125.Hollenbach JA, Meenagh A, Sleator C, et al. Report from the killer immunoglobulin-like receptor (KIR) anthropology component of the 15th International Histocompatibility Workshop: worldwide variation in the KIR loci and further evidence for the co-evolution of KIR and HLA. Tissue Antigens. 2010;76:9–17. doi: 10.1111/j.1399-0039.2010.01459.x. [DOI] [PubMed] [Google Scholar]
- 126.Zhu BF, Wang HD, Shen CM, et al. Killer cell immunoglobulin-like receptor gene diversity in the Tibetan ethnic minority group of China. Hum Immunol. 2010;71:1116–23. doi: 10.1016/j.humimm.2010.07.010. [DOI] [PubMed] [Google Scholar]
- 127.Hou L, Chen M, Jiang B, Wu D, Ng J, Hurley CK. Thirty allele-level haplotypes centered around KIR2DL5 define the diversity in an African American population. Immunogenetics. 2010;62:491–8. doi: 10.1007/s00251-010-0458-8. [DOI] [PMC free article] [PubMed] [Google Scholar]
- 128.Norman PJ, Abi-Rached L, Gendzekhadze K, et al. Unusual selection on the KIR3DL1/S1 natural killer cell receptor in Africans. Nat Genet. 2007;39:1092–9. doi: 10.1038/ng2111. [DOI] [PubMed] [Google Scholar]
- 129.Ordonez D, Meenagh A, Gomez-Lozano N, Castano J, Middleton D, Vilches C. Duplication, mutation and recombination of the human orphan gene KIR2DS3 contribute to the diversity of KIR haplotypes. Genes Immun. 2008;9:431–7. doi: 10.1038/gene.2008.34. [DOI] [PubMed] [Google Scholar]
- 130.Flores AC, Marcos CY, Paladino N, et al. KIR genes polymorphism in Argentinean Caucasoid and Amerindian populations. Tissue Antigens. 2007;69:568–76. doi: 10.1111/j.1399-0039.2007.00824.x. [DOI] [PubMed] [Google Scholar]
- 131.Middleton D, Menchaca L, Rood H, Komerofsky R. New allele frequency database: http://www.allelefrequencies.net. Tissue Antigens. 2003;61:403–7. doi: 10.1034/j.1399-0039.2003.00062.x. [DOI] [PubMed] [Google Scholar]
- 132.Middleton D, Meenagh A, Moscoso J, Arnaiz-Villena A. Killer immunoglobulin receptor gene and allele frequencies in Caucasoid, Oriental and Black populations from different continents. Tissue Antigens. 2008;71:105–13. doi: 10.1111/j.1399-0039.2007.00973.x. [DOI] [PubMed] [Google Scholar]
- 133.Middleton D, Meenagh A, Serrano-Vela JI, Moscoso J, Arnaiz-Villena A. Different Evolution of Inhibitory and Activating Killer Immunoglobulin Receptors (KIR) in Worldwide Human Populations. Open Immunol J. 2008;1:42–50. [Google Scholar]
- 134.Cheent K, Khakoo SI. Natural killer cells: integrating diversity with function. Immunology. 2009;126:449–57. doi: 10.1111/j.1365-2567.2009.03045.x. [DOI] [PMC free article] [PubMed] [Google Scholar]
- 135.Ferrer-Admetlla A, Bosch E, Sikora M, et al. Balancing selection is the main force shaping the evolution of innate immunity genes. J Immunol. 2008;181:1315–22. doi: 10.4049/jimmunol.181.2.1315. [DOI] [PubMed] [Google Scholar]
- 136.Bernatchez L, Landry C. MHC studies in nonmodel vertebrates: what have we learned about natural selection in 15 years? J Evol Biol. 2003;16:363–77. doi: 10.1046/j.1420-9101.2003.00531.x. [DOI] [PubMed] [Google Scholar]
- 137.Garrigan D, Hedrick PW. Perspective: detecting adaptive molecular polymorphism: lessons from the MHC. Evolution. 2003;57:1707–22. doi: 10.1111/j.0014-3820.2003.tb00580.x. [DOI] [PubMed] [Google Scholar]
- 138.Parham P. The genetic and evolutionary balances in human NK cell receptor diversity. Semin Immunol. 2008;20:311–6. doi: 10.1016/j.smim.2008.10.002. [DOI] [PMC free article] [PubMed] [Google Scholar]
- 139.Yawata M, Yawata N, Draghi M, Little AM, Partheniou F, Parham P. Roles for HLA and KIR polymorphisms in natural killer cell repertoire selection and modulation of effector function. J Exp Med. 2006;203:633–45. doi: 10.1084/jem.20051884. [DOI] [PMC free article] [PubMed] [Google Scholar]
- 140.Guinan KJ, Cunningham RT, Meenagh A, Dring MM, Middleton D, Gardiner CM. Receptor systems controlling natural killer cell function are genetically stratified in Europe. Genes Immun. 2010;11:67–78. doi: 10.1038/gene.2009.60. [DOI] [PubMed] [Google Scholar]
- 141.Hao L, Nei M. Rapid expansion of killer cell immunoglobulin-like receptor genes in primates and their coevolution with MHC Class I genes. Gene. 2005;347:149–59. doi: 10.1016/j.gene.2004.12.012. [DOI] [PubMed] [Google Scholar]
- 142.Ingman M, Kaessmann H, Paabo S, Gyllensten U. Mitochondrial genome variation and the origin of modern humans. Nature. 2000;408:708–13. doi: 10.1038/35047064. [DOI] [PubMed] [Google Scholar]
- 143.Chiaroni J, Underhill PA, Cavalli-Sforza LL. Y chromosome diversity, human expansion, drift, and cultural evolution. Proc Natl Acad Sci USA. 2009;106:20174–9. doi: 10.1073/pnas.0910803106. Epub 2009 Nov 17. [DOI] [PMC free article] [PubMed] [Google Scholar]
- 144.Rosenberg NA, Pritchard JK, Weber JL, Cann HM, Kidd KK, Zhivotovsky LA, Feldman MW. Genetic structure of human populations. Science. 2002;298:2381–5. doi: 10.1126/science.1078311. [DOI] [PubMed] [Google Scholar]
- 145.Jakobsson M, Scholz SW, Scheet P, et al. Genotype, haplotype and copy-number variation in worldwide human populations. Nature. 2008;451:998–1003. doi: 10.1038/nature06742. [DOI] [PubMed] [Google Scholar]
- 146.Poloni ES, Naciri Y, Bucho R, Niba R, Kervaire B, Excoffier L, Langaney A, Sanchez-Mazas A. Genetic Evidence for Complexity in Ethnic Differentiation and History in East Africa. Ann Hum Genet. 2009;73:582–600. doi: 10.1111/j.1469-1809.2009.00541.x. [DOI] [PubMed] [Google Scholar]
- 147.Wang S, Lewis CM, Jakobsson M, et al. Genetic variation and population structure in native Americans. PLoS Genet. 2007;3:e185. doi: 10.1371/journal.pgen.0030185. [DOI] [PMC free article] [PubMed] [Google Scholar]
- 148.Li JZ, Absher DM, Tang H, et al. Worldwide human relationships inferred from genome-wide patterns of variation. Science. 2008;319:1100–4. doi: 10.1126/science.1153717. [DOI] [PubMed] [Google Scholar]
- 149.de Filippo C, Barbieri C, Whitten M, et al. Y-chromosomal variation in Sub-Saharan Africa: insights into the history of Niger-Congo groups. Mol Biol Evol. 2010;25:25. doi: 10.1093/molbev/msq312. [DOI] [PMC free article] [PubMed] [Google Scholar]