Abstract
An essential step of the reverse transcription of the HIV-1 genome is the first strand transfer that requires the annealing of the TAR RNA hairpin to the cTAR DNA hairpin. HIV-1 nucleocapsid protein (NC) plays a crucial role by facilitating annealing of the complementary hairpins. Using nuclear magnetic resonance and gel retardation assays, we investigated the interaction between NC and the top half of the cTAR DNA (mini-cTAR). We show that NC(11-55) binds the TGG sequence in the lower stem that is destabilized by the adjacent internal loop. The 5′ thymine interacts with residues of the N-terminal zinc knuckle and the 3′ guanine is inserted in the hydrophobic plateau of the C-terminal zinc knuckle. The TGG sequence is preferred relative to the apical and internal loops containing unpaired guanines. Investigation of the DNA–protein contacts shows the major role of hydrophobic interactions involving nucleobases and deoxyribose sugars. A similar network of hydrophobic contacts is observed in the published NC:DNA complexes, whereas NC contacts ribose differently in NC:RNA complexes. We propose that the binding polarity of NC is related to these contacts that could be responsible for the preferential binding to single-stranded nucleic acids.
INTRODUCTION
Strand transfer events occurring during the reverse transcription of the human immunodeficiency virus-1 (HIV-1) genome are intimately connected to the dimeric nature of the genome (1–3) and play an important role in the recombination process that allows the virus to escape the host immunological and cellular defenses as well as the antiretroviral therapies (4–7). Two obligatory strand transfers are required for reverse transcription of the HIV-1 genome (8). During the first strand transfer, the minus-strand strong-stop DNA (ss-cDNA), the first product of reverse transcription, is transferred to the 3′-end of the viral RNA in a reaction mediated by base pairing of the complementary R sequences at the 3′-ends of the RNA and DNA molecules. The R RNA sequence folds into secondary structures corresponding to the transactivator response element (TAR) hairpin and the upper part of the poly(A) hairpin (9,10). Similarly, the R sequence of ss-cDNA is predicted to fold into hairpins that are complementary to the TAR and poly(A) RNA sequences and are therefore named cTAR and cpoly(A), respectively. The TAR structure is far more important than the poly(A) hairpin in the first strand transfer (11–13). The first strand transfer is greatly enhanced by HIV-1 nucleocapsid protein (NC) (14,15). This enhancement is due at least in part to the ability of NC to increase the TAR RNA–DNA annealing process by ∼105-fold (16). NC is a short and basic protein that contains two zinc knuckles, each of them possessing a conserved CCHC metal-ion binding motif. Besides its role in the first strand transfer, NC displays multiple functions during the viral replication cycle in both the early and late steps, due to its nucleic acid chaperone activity (14,17). This activity facilitates the rearrangement of nucleic acids into conformations that are thermodynamically more stable (14,18). This chaperone function is based on two independent components, namely the destabilization of nucleic acid duplexes by the zinc knuckles (19–25) and the aggregation of nucleic acids, mainly by the basic N-terminal domain (26–29).
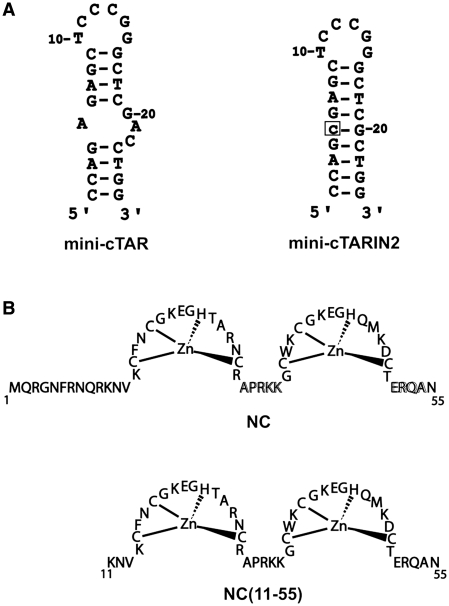
The full-length TAR and cTAR form stem–loops with complementary apical loops of six residues and a series of conserved bulges/internal loops (16,22,30). The TAR RNA–DNA annealing process was shown to proceed either through a ‘kissing’ pathway involving the apical loops of TAR and cTAR or through a ‘zipper’ pathway involving the 3′/5′ termini (16,22,29,31–33). While the ‘kissing’ mechanism appears clearly dominant in the absence of NC or at sub-saturating NC concentrations (9,16), a switch to the ‘zipper’ pathway is observed at saturating NC concentrations (16,22). Similarly, annealing of the mini-TAR and mini-cTAR sequences, corresponding to the top half of TAR and cTAR hairpins (Figure 1), was shown to proceed mainly through loop–loop interaction, while alternative pathways, such as annealing through the stem ends, also contribute at saturating NC concentrations (29).
Figure 1.
(A) Secondary structures for the mini-cTAR sequences (39). The single base addition in mini-cTARIN2 is boxed. (B) Sequences of proteins used in this study.
In the present study, we investigated the binding of NC to mini-cTAR using gel retardation assays and nuclear magnetic resonance (NMR) methods. In a previous study, fluorescence methods showed that up to four NC(12-55) (a truncated form of NC) molecules could bind to mini-cTAR under low ionic strength conditions (20) and that the internal loop rather than the apical loop constituted a preferential binding site for NC (20). In contrast to previous NC:nucleic acid complexes determined by NMR (34–38) that contain a single binding site with unpaired guanines, the mini-cTAR hairpin contains two loops and an unstable lower stem with unpaired guanines (39) that are potential binding sites for NC. This DNA hairpin is therefore well suited for an NMR study of nucleic acid recognition by NC.
Here, we determined by NMR the structure of the NC(11-55):mini-cTAR complex. The structural features of the complex were well identified due to a clear preference of NC(11-55) for a single site in mini-cTAR and a large number of intermolecular NOEs between the peptide and DNA. Data clearly show that the lower stem, but not the apical loop of mini-cTAR, constitutes a strong binding site for NC. Moreover, comparison with the five available structures of NC:nucleic acid complexes (34–38) allows to get a better understanding of the structural basis of nucleic acid recognition by NC.
MATERIALS AND METHODS
Protein and oligonucleotide preparation
The NC(11-55) peptide was synthesized by the stepwise solid-phase method with Fmoc amino acids as described (40). Peptide purity was >98%. An extinction coefficient of 5700 M−1 cm−1 was used to determine the peptide concentration. The peptide was prepared with 3 eq. of ZnCl2 to ensure saturation of the finger motifs and it was dissolved in 90% H2O/10% D2O. Unlabeled mini-cTAR DNA (26 nt) was obtained from Eurogentec (Belgium) and prepared at a 1 mM mini-cTAR (26 nt) concentration in 90% H2O/10% D2O. For complex formation, to avoid aggregation, we cooled the mini-cTAR DNA solution on ice prior addition of NC(11-55). The concentrations of the NMR samples of NC(11-55):mini-cTAR complexes were around 1 mM at a 1:1 molar ratio in 90% H2O/10%D2O solutions in the absence of NaCl or MgCl2 at pH 6.5.
NMR experiments
NMR data were collected with Bruker AVANCE 500 MHz spectrometer (Bruker BioSpin S.A., Wissembourg, France). The proton assignments were obtained from 2D NOESY (τm = 50, 100, 150, 200 and 300 ms) and 2D TOCSY (41) (τm = 60, 80 and 100 ms) that were recorded at 283, 288, 293 and 298 K. For the NC(11-55):mini-cTAR DNA complex, proton resonance assignments were obtained from 2D NOESY (τm =50, 100, 150, 200 and 300 ms) and 2D TOCSY (τm =60, 80 and 100 ms) that were recorded at 283, 293, 298 and 303 K. The NOESY and TOCSY were acquired under the following experimental conditions: a total of 64 scans, 2048 data points and 512 t1 increments with spectral widths of 6000 Hz [mini-cTAR (26 nt) and NC(11-55)]; for the NC(11-55):mini-cTAR complex, a total of 128 scans, 2048 real t2 points with spectral widths of 6000 and 10 000 Hz for experiments in H2O, 512 t1 time proportional phase increments, and a relaxation delay of 2 s between scans. The water signal was suppressed with a WATERGATE sequence (42).
Structure calculations for NC(11-55) and the NC(11-55):mini cTAR DNA complex
All structures were calculated using XPLOR NIH (version 2.23) (43,44). For the free peptide, distance restraints of 1.8–2.5, 1.8–3.5, 1.8–4.5 and 1.8–6.0 Å were used to represent qualitatively observed strong, medium, weak and very weak cross-peak intensities, respectively. Three-hundred and six distance constraints were used in XPLOR to generate 50 conformers.
For the complex, NOE cross-peak volumes were estimated from 2D NOE spectra at 298 and 303 K and recorded at several mixing times. Distance restraints were classified into five categories based on the NOE intensities observed with upper limit distance restraints from a strong NOE (2.5 Å), medium (3.5 Å), medium weak (4 Å), weak (4.5 Å) to a very weak NOE (6 Å). These distances were calibrated with respect to the aromatic protons of Trp37 and H5–H6 cross- peak for the mini-cTAR. A force constant of 50 kcal mol−1 Å−2 was applied to the NOE-derived constraints.
Two sets of calculations were performed: (i) one including the whole molecule mini-cTAR and NC(11-55) with restraints involving the 26 residues of DNA and those of the protein and (ii) another one including only the C23–G26 residues and NC(11-55) with restraints involving only these residues and those of the protein. The second set of calculations was motivated by the fact that only T24, G25 and G26 residues presented intermolecular NOEs with protein residues. In addition, no inter-residues NOES are detected between the C23–G26 residues and any other residue of the mini-cTAR molecule. As we are interested first by the protein–DNA interface, the second set of calculations allowed us to select the best energy molecules on the basis of this interface and not of those of the whole complex. The first set of calculations was used to ensure that no bias was introduced by the procedure. Dihedral angle restraints and hydrogen bonds restraints were used only for the upper stem.
Structures of the complex were obtained using a protocol in which the two folded partners, calculated using NMR restraints measured for isolated molecules, have been positioned relatively to each other in five different orientations. At this point, NMR restraints measured for the complex were introduced as to dock protein on DNA molecules. For each of the five initial orientations, 10 structures were calculated and the two lowest-energy structures of each set were retained for subsequent analysis. Therefore, 10 structures were finally selected. These 10 final structures show a minimal number of NOEs violations >0.2 Å and good Ramachandran values. These 10 structures were used for the final structural analysis (Table 1).
Table 1.
Experimental constraints and structural statistics for NC(11-55):mini-cTAR
| NMR-derived distance restraints | ||
|---|---|---|
| Total distance restraints | 459 | |
| NC(11-55) | d(23CTGG26) | |
| Intra-residue | 132 | 22 |
| Sequential ( | i – j | = 1) | 137 | 3 |
| Medium range (1 < | i – j | <= 4) | 51 | |
| Long range (|i – j | > 4) | 73 | |
| Intermolecular | ||
| NOE-derived restraints | 41 | |
| Rmsd from idealized geometry (Å) | ||
| Bonds (Å) | 0.0045 ± 0.0003 | |
| Angles (deg) | 0.70 ± 0.03 | |
| X-Plor potential energies (kcal/mol) | ||
| E total | −296 ± 52 | |
| Ramachandran analysis of residues (%) | ||
| In most favorable region | 70.85 | |
| In additionally allowed regions | 25.02 | |
| In generously allowed regions | 3.23 | |
| In disallowed regions | 0.54 | |
| Backbone atoms | Heavy atoms | |
| Pairwise rmsd deviations (Å) | ||
| NC(15-28) | 0.40 ± 0.17 | 1.16 ± 0.29 |
| NC(36-49) | 0.36 ± 0.19 | 0.84 ± 0.20 |
| NC(15-49) | 0.65 ± 0.16 | 1.19 ± 0.27 |
| NC(15-49) & C23TGG26 | 1.41 ± 0.29 | |
Isothermal titration calorimetry experiments
The interaction between mini cTAR and NC(11-55) was investigated at 20°C in 50 mM Tris HCl, 30 mM NaCl, 0.2 mM MgCl2, pH 7.5 using a VP-ITC Microcalorimeter (Microcal Corp. Northampton, MA, USA). A typical titration experiment was done by monitoring under constant stirring (310 r.p.m.) the heat flow generated by repeated injections of 7 µl (in 14 s) of a concentrated peptide solution into the oligonucleotide solution contained in the 1.4 ml sample cell of the instrument. The quantity of heat accompanying each injection of titrant was calculated as the integral versus time of the experimental signal. A control experiment in which NC(11-55) was titrated into the buffer alone was performed in the same conditions to determine the heat of dilution. This latter was subtracted from the heats observed for the binding reaction. Instrument control, data acquisition and analysis were done with the VPViewer and the Origin software provided by the manufacturer.
Gel retardation assays
Mini-cTAR DNA was 5′-end labeled using T4 polynucleotide kinase (New England Biolabs, Ipswich, MA, USA) and [γ-32P] ATP (Perkin Elmer, Waltham, MA, USA). The 5′-end labeled mini-cTAR was purified by electrophoresis on a 15% denaturing polyacrylamide gel and isolated by elution followed by ethanol precipitation. Assays were carried out in a final volume of 10 µl. Mini-cTAR 32P-DNA (10 pmol) at 2 × 10³ cpm/pmol was dissolved in 6 µl of water, heated at 90°C for 2 min and chilled for 2 min on ice. Then, 2 µl of renaturation buffer was added (final concentrations: 30 mM NaCl, 0.2 mM MgCl2 and 25 mM Tris–HCl pH 7.5) and the sample was incubated for 15 min at 20°C in the absence or presence of protein at various concentrations. Gel loading buffer (final concentrations: 10% w/v glycerol, 0.01% w/v bromophenol blue, 0.01% w/v xylene cyanol) was added and the samples were analyzed by electrophoresis on a 14% polyacrylamide gel (Acrylamide:Bis-acrylamide=29:1) at 4°C in 0.5× TBE buffer (45 mM Tris-borate pH 8.3, 1 mM EDTA). After electrophoresis, the gel was fixed, dried and autoradiographed. Free DNA and protein-DNA complexes were quantified using a PhosphorImager and ImageQuant software (Molecular Dynamics, GE Healthcare Bio-Sciences Corp., Piscataway, NJ, USA). The fraction of bound mini-cTAR DNA (FR) was determined using the formula FR=1-(IF/IB+IF), where IF and IB are the band intensities of free and bound mini-cTAR DNAs, respectively.
RESULTS
Structures of the free partners
Analysis of interactions between NC(11-55) and mini-cTAR has been preceded by the determination of structural and dynamic features of the free partners. Recently, using NMR and probing methods, we investigated the structural and dynamic properties of mini-cTAR (39). We showed that the internal loop is responsible for the asymmetric destabilization of mini-cTAR and that the internal dynamics of the different parts of the molecule occurred on a large range of time scales. The destabilization of the lower stem by the internal loop strongly affects its double-strand character (39). By contrast, the upper stem is not destabilized by the internal loop.
The three-dimensional structure of NC(11-55) has been determined using NMR experimental restraints in the presence of 1.5 eq. zinc atoms for each zinc knuckle. The strong tendency of the native NC to aggregate in the presence of nucleic acids led us to use NC(11-55), a truncated form of NC which lacks the basic N-terminal domain (Figure 1B) (20–22). Our structural data indicate that the folding of the two zinc knuckles around zinc ions is well resolved, while the linker between them is poorly defined. As a consequence, the relative positions and orientations of the two zinc knuckles are not well defined. The peptide structure is close to that reported by Morellet et al. (45) under similar conditions but with a lower pH (5.5 instead of 6.5 in the present study; the r.m.s.d. between the two structures is 0.75 Å with residues 15–49 including the linker residues). As reported by Morellet et al. (45), two inter zinc-knuckle NOEs are observed between Phe16 and Trp37 and Ala25 and Trp37, indicating that the two aromatic rings Phe16 and Trp37 are close in space.
Characterization of the binding of NC(11-55) to mini-cTAR
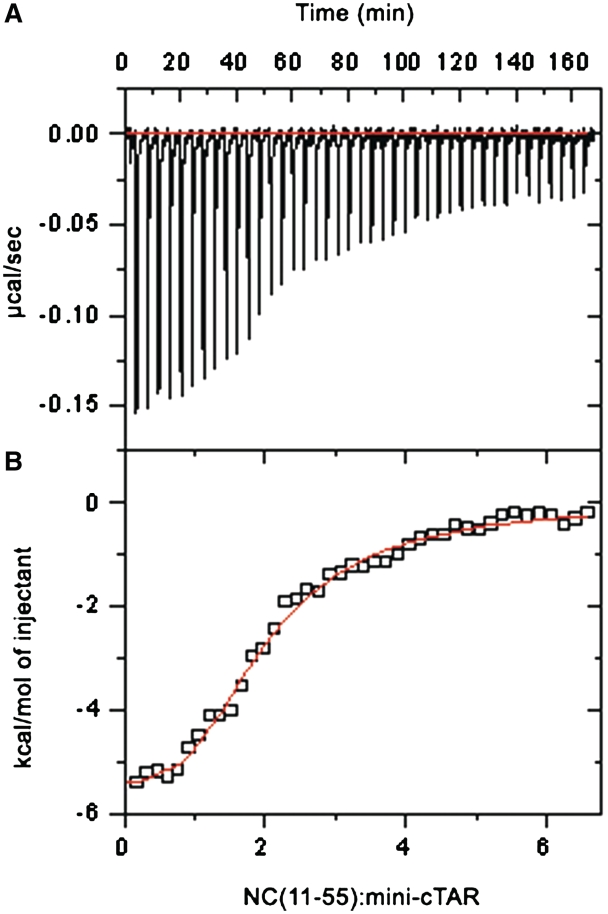
We used isothermal titration calorimetry (ITC) to determine the binding parameters for the NC(11-55):mini-cTAR interaction. Figure 2A shows the pattern for the titration of mini-cTAR by NC(11-55). The reaction appears exothermic, as each aliquot of NC(11-55) causes a negative peak of thermal power. Moreover, the figure shows that the heat effect decreases upon incremental additions of peptide due to saturation of mini-cTAR. When mini-cTAR saturation was achieved, further peptide injections were accompanied by a constant heat effect due to dilution, as independently verified. Integration of the area under each peak yielded the quantity of heat released per aliquot of peptide. Figure 2B depicts the heat release as a function of the molar ratio of peptide to oligonucleotide. A fit to a 1:1 binding model did not adequately describe the peptide concentration dependence of the calorimetric signal (X2 = 1.56 × 10⁵), suggesting that one molecule of mini-cTAR binds more than one molecule of NC(11-55) in the tested conditions. The titration data were more satisfactorily fitted to a binding model with two independent and identical sites for the peptide on mini-cTAR (X2 = 2.61 × 10⁴), and values of 1.6 ± 0.1 µM and −7.1 ± 0.1 kcal mol−1 for Kd the equilibrium dissociation constant and ΔH the reaction enthalpy, respectively. However, this model was clearly inconsistent with the NMR data showing a preferential binding site (see below). In fact, 2:1 binding model with independent but different sites appeared to be the simplest model to describe the calorimetric data (X2 = 1.9 × 10⁴). The best theoretical curve shown at figure 2B was obtained with Kd1 = 0.25 ± 0.01 µM and Kd2 = 3.4 ± 0.4 µM, respectively, and ΔH1 = −5.4 ± 0.15 kcal mol−1 and ΔH2 = −9.2 ± 0.3 kcal mol−1, respectively.
Figure 2.
Isothermal titration calorimetry data obtained for the reaction of NC(11-55) with mini-cTAR at 20°C in 50 mM Tris–HCl, 30 mM NaCl, 0.2 mM MgCl2. (A) Thermal power produced by the successive 7 µl injections of the peptide solution (109 µM) into the oligonucleotide solution (3.7 µM). The red line represents the baseline. (B) Quantities of heat accompanying the successive injections (open rectangle), calculated by integration of the peaks shown in (A) and corrected for the heat of dilution. The theoretical curve (in red) represents the least square fit of these data to a 2:1 binding model with independent sites of different affinities calculated with the best estimates of Kd1, Kd2, ΔH1 and ΔH2 given in the text.
In NMR studies, the complex was obtained by mixing 1 mM NC(11-55) with 1 mM mini-cTAR. A slight broadening of both the protein and DNA resonances was observed. As expected from the high concentrations used and the strong binding constants, we detected only one set of signals for the protein resonances, suggesting that all proteins were in the bound state (data not shown). Assignment of the DNA proton resonances allowed to identify, for residues C22, C23, T24, G25 and G26, two sets of distinct resonances in the H5/H1′ region (Supplementary Figure S1). For each residue, the chemical shifts of one of the two species were very close to the chemical shifts of free DNA, suggesting that the two sets correspond to the free and bound forms of mini-cTAR in chemical exchange. This is confirmed by the observation of exchange peaks in NOESY and TOCSY spectra connecting the two forms, and therefore consistent with a slow exchange process (Supplementary Figure S1). These exchange peaks are also very useful to assign DNA resonances since those of the free form are already known (39). From the equilibrium dissociation constants determined by ITC, assuming two different and independent binding sites, we calculated that ∼80% of the strong binding sites and ∼20% of the weak binding sites are occupied under the NMR conditions (46). Consequently, at a 1:1 ratio of peptide to mini-cTAR, 20% of the stronger binding sites of mini-cTAR are expected to be free of peptide due to the interaction of ∼20 % of the protein bulk with the weaker binding sites. This calculated distribution of NC(11-55) between its two binding sites is in agreement with the NMR data, indicating a slow exchange process between the bound and free forms, as well as with the resonance intensities in 1D spectra indicating a ratio 8:2 or 7:3 between the two binding sites (data not shown). Similarly, the presence of secondary binding sites besides a major one has also been observed for the NC(12-55):ΔP(–) PBS complex (34).
NMR signal assignments for the NC(11-55):mini-cTAR complex and analysis of NOE data
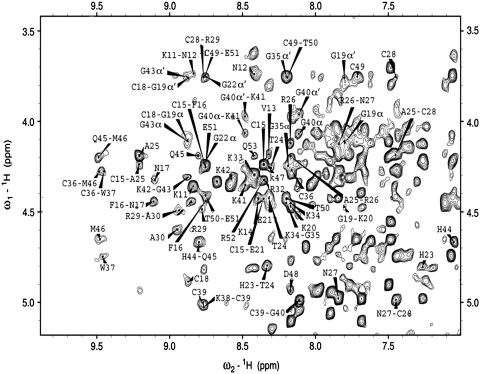
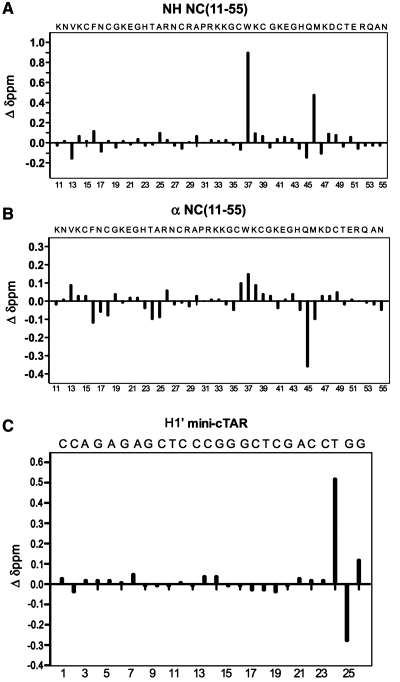
Nearly complete proton resonance assignment of the NC(11-55):mini-cTAR complex was obtained from 2D homonuclear TOCSY and NOESY spectra and using the previously assigned resonances for the free forms of mini-cTAR (39) and NC(11-55). Although formation of the 1:1 complex generates line broadening of the peptide resonances, the main resonances of both partners could be assigned in the complex, due to the high quality of the 2D NMR spectra. An illustrative example is the NH-Hα/Hα′ correlation region of the complex that is presented in Figure 3. Comparison of the chemical shifts between free and bound forms of NH and Hα/Hα′ protons shows large and selective variations that help to identify the peptide residues involved in the binding to mini-cTAR (Figure 4A and B). Strongest shifts were identified for Val13, Phe16, Thr24, Ala25, Cys36, Trp37, Gln45 (>0.35 p.p.m.) and Met46 residues (Figure 4A and B). Noticeably, most of the largest variations were observed for the residues of the C-terminal zinc knuckle (Trp37, Gln45 and Met46).
Figure 3.
Selected region of the 2D NOESY spectrum obtained at 25°C in H20 (pH 6.5) for the NC(11-55):mini-cTAR complex. Most of the intra-residues and inter-residues Hα/Hα′-NH cross-peaks of NC(11-55) are indicated with the name of the residue for the intra-residue and the names of the two residues for the inter-residue cross-peaks.
Figure 4.
Chemical shifts changes due to complex formation between mini-cTAR and NC(11-55). Chemical shifts changes of NH (A) and Hα (B) of NC(11-55) upon mini-cTAR binding. Chemical shifts changes of H1′ proton of mini-cTAR upon NC(11-55) binding (C). The chemical shift differences (in ppm) are obtained by taking the difference between the bound (1:1 complex) and the free form.
The CH3/H5/H6/H8 aromatic and H1′/H2′/H2′′ sugar resonances of mini-cTAR have been assigned using the assigned free resonances (39) and the exchange cross-peaks described above that connect the free and bound forms of DNA (34). The four families of protons (Figure 4C and Supplementary Figure S2) converge to indicate that residues T24, G26 and, to a lesser degree, G25 are the most affected residues in the complex. The weak perturbations observed for the other residues suggest that mini-cTAR exhibits a major binding site, in agreement with the ITC data.
Analysis of the intra-molecular NOE cross-peaks for DNA resonances in the imino to amino regions showed that the four Watson–Crick base pairs detected in the upper stem of mini-cTAR alone (39) are not destabilized, indicating that its double-stranded structure is maintained in the complex. Interestingly, a new imino proton signal is detected near 10 p.p.m. Most of the inter-molecular NOE data described below suggest that this signal is that of H1 G26. Indeed, this chemical shift is close to that of the imino proton of H1 guanine that forms a hydrogen bond with the NC hydrophobic platform in the NC(12-55):ΔP(–)PBS complex (34). NOE cross-peak patterns of the upper stem and apical loop were not perturbed by NC(11-55) whereas those of the C23TGG26 sequence in the lower stem (H6/H8-H1′/H2′/H2′′) were decreased in the bound mini-cTAR.
Analysis of the intra-molecular cross-peaks for NC(11-55) indicates that the folding of both zinc knuckles in bound peptide is similar to those of the free peptide. By contrast, a large difference is observed in the number of inter-knuckle NOEs in the free and bound forms. In the free form, only two NOEs involving residues of two different zinc knuckles are observed: (Phe16-Trp37 and Ala25-Trp37) while, in the complex, many residues of the two zinc knuckles are observed to be in contact: Phe16-Trp37 (with five different intermolecular NOEs), Phe16-Met46, Asn17-Trp37 and Ala25-Trp37. This relatively large number of NOEs demonstrates that the N and C-terminal zinc knuckles interact strongly with each other upon binding to mini-cTAR and that their interface is well defined.
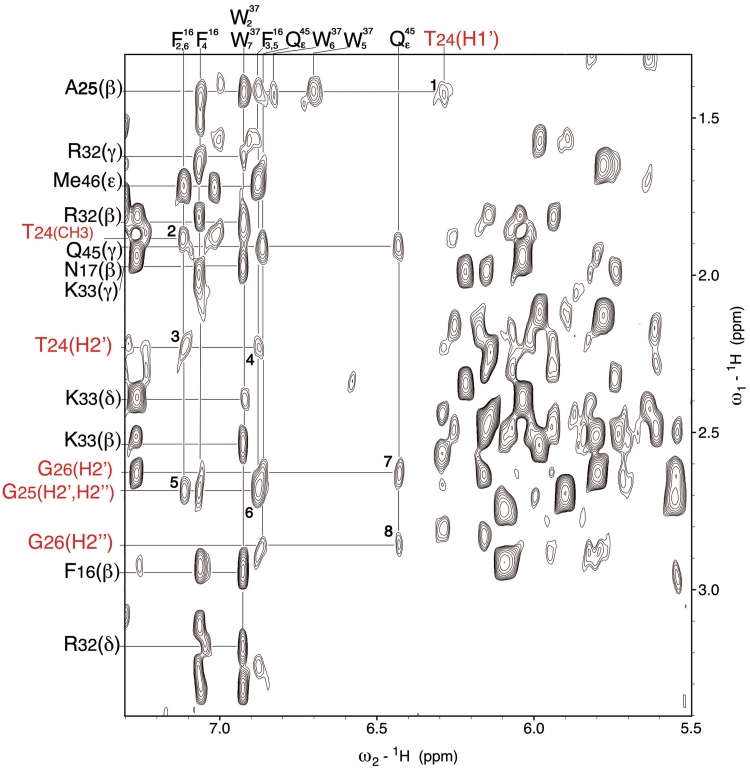
In the NOESY spectra, 41 inter-molecular NOEs have been identified between NC(11-55) and the T24, G25 and G26 residues. The main NOEs are observed between T24 and Val13, Phe16, Thr24 and Ala25; between G25 and Phe16, Thr24, Ala25 and Met46; and between G26 and Cys36, Trp37 and Gln45 (Figure 5).
Figure 5.
Portion of the NOESY spectrum recorded at 30°C in H2O (pH 6.5) for 1 mM of the NC(11-55):mini-cTAR complex. The spectrum shows some important intermolecular NOEs between the peptide and mini-cTAR: H1′ T24-Hβ A25 (1); CH3 T24-Hδ F16 (2); H2′ T24-Hδ F16 (3); H2′ T24-Hε F16 (4); H2′, H2′′ G25-Hδ F16 (5); H2′, H2′′ G25-Hε F16 (6); H2′ G26-δNH1 Q45 (7); H2′′ G26-δNH1 Q45 (8). Amino acid residues and nucleotides are in black and red, respectively. Note that T24 designates both the threonine 24 residue of NC(11-55) and the thymine 24 residue of mini-cTAR.
Taken together, the chemical shifts and NOE data converge to show that NC(11-55) binds preferentially the T24GG26 sequence located at the 3′-end of mini-cTAR. The NC(11-55) residues involved in the binding interactions within our complex suggest that the NC(11-55) mode of binding to mini-cTAR is close to that observed in the other NC:oligonucleotide complexes with solved structures (34–37).
Structure calculations
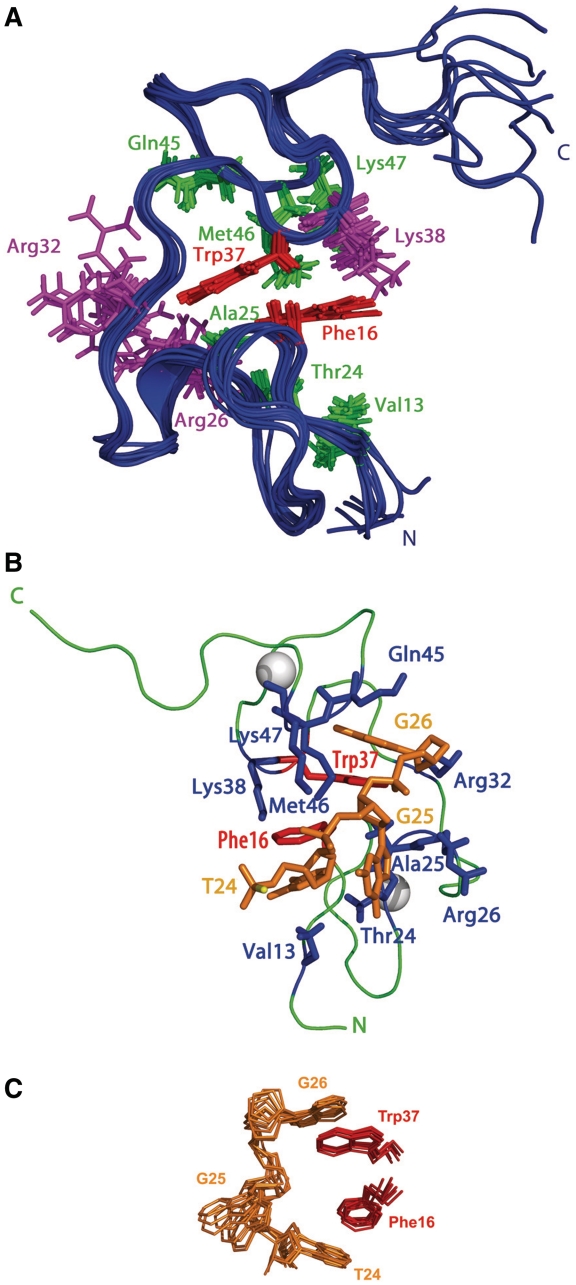
From the NOESY spectra, 459 NOE-derived interproton distance restraints were obtained. They consist of 393 intra-protein NOEs, 22 intra-DNA NOEs [involving only the four terminal residues C23–G26 residues of the 3′ region that interact with NC(11-55)] and 41 inter-molecular restraints NOEs (Table 1). No dihedral angle restraints were used for the C23–G26 residues. Fifty structures were calculated using a protocol in which the two folded partners have been positioned relatively to each other in five different orientations before running the calculations. For each of these five different initial configurations, 10 structures were calculated and the two lowest-energy structures of each set were kept for analysis, resulting in 10 final structures (Figure 6). These structures, present a minimal number of NOEs violations >0.2 Å and good Ramachandran values (Table 1). The superimposition for 15–49 residues of the protein shows a pairwise r.m.s.d. of 0.65± 0.16 Å. When the four terminal residues C23–G26 are included the r.m.s.d is 1.41 Å (Table 1). It is important to compare these results to those of the calculations performed with all the residues of mini-cTAR: these latter calculations indicate an r.m.s.d. for the same region of 1.45 Å (see ‘Materials and Methods’ section). Moreover, close comparison of the best structures show an r.m.s.d. of 1.38 Å between the two families of structures (the ones calculated with C23–G26 residues opposed to the ones calculated with all the residues). These data indicate that there is no impact of the other residues of mini-cTAR on the NCp7(11-55):C23TGG26 complex.
Figure 6.
Views showing the best structures of the NC(11-55):mini-cTAR complex (A). Superimposition of the 10 best structures of NC(11-55) in its bound form (backbone atoms from residues 15 to 49). Only side chains of protein residues interacting with DNA are represented. Residues are color coded as follows: Phe16 and Trp37, red; Val13, Thr24, Ala25, Gln45, Met46 and Lys47, green; Arg26, Arg32 and Lys38, purple. (B) View of a representative structure of NC(11-55):mini-cTAR complex showing amino-acid residues and nucleotides involved in the binding site. Residues are color coded as follows: Phe16 and Trp37, red; Val13, Thr24, Ala25, Arg26, Arg32, Lys38, Gln45, Met46 and Lys47, blue; T24, G25 and G26, orange. The zinc atoms are displayed as white spheres. (C) View of the 10 best structures of NC(11-55):T24GG26 interaction. T24, G25 and G26 are in orange; for the protein only Phe16 and Trp37 residues are shown (in red). The picture underlines the stacking interactions and the insertion of Phe16 and Trp37 between the nucleobases of T24 and G26.
Description of the structure
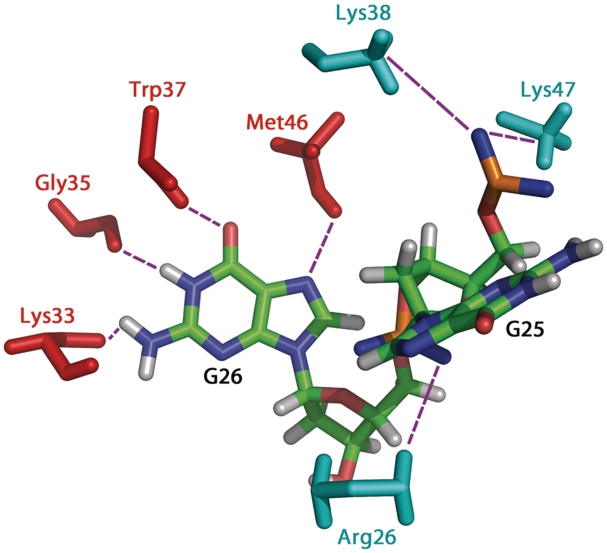
Both zinc knuckles of NC(11-55) are characterized by a hydrophobic cleft formed by Val13, Phe16, Thr24 and Ala25 for the N-terminal knuckle and Trp37, Gln45 and Met46 for the C-terminal knuckle (Figure 6A). In the NC(11-55):mini-cTAR complex, the nucleobase of G26 is inserted deeply in the C-terminal knuckle while the nucleobase of T24 is partly inserted in the N-terminal knuckle (Figure 6B). The nucleobase of T24 is involved in stacking interactions with the Phe16 and Val13 side chains (Figure 6B and C). The aromatic ring of G26 stacks with the Trp37 and Gln45 side chains (Figure 6B and C). In addition, the nucleobase of G26 is stabilized by four hydrogen bonds, namely GH1 with backbone carbonyl group of Gly35, H22 of G26 with backbone carbonyl group of Lys33, O6 of G26 with NH of Trp37, and NH of Met46 with N7 of G26 (Figure 7). The phosphodiester backbone of G26 makes electrostatic contacts with Arg26 (Figure 7). Although the nucleobase of G25 is not involved in interactions with NC(11-55), the ribose moiety of G25 makes hydrophobic contacts with Met46. Moreover, Lys38 and Lys47 form two salt-bridges (electrostatic contacts) with the phosphodiester backbone of G25 (Figure 7).
Figure 7.
View showing the electrostatic contacts and hydrogen bonds between NC(11-55) and mini-cTAR. Only the side-chain residues involved in the electrostatic contacts (Arg26, Lys38 and Lys47) and hydrogen bonds (Lys33, Gly35, Trp37 and Met46) are indicated in cyan and red, respectively. Electrostatic interactions are between: Arg26 and G26, Lys38 and G25, Lys47 and G25. Hydrogen bonds are between G26 and Lys33, Gly35, Trp37 and Met46.
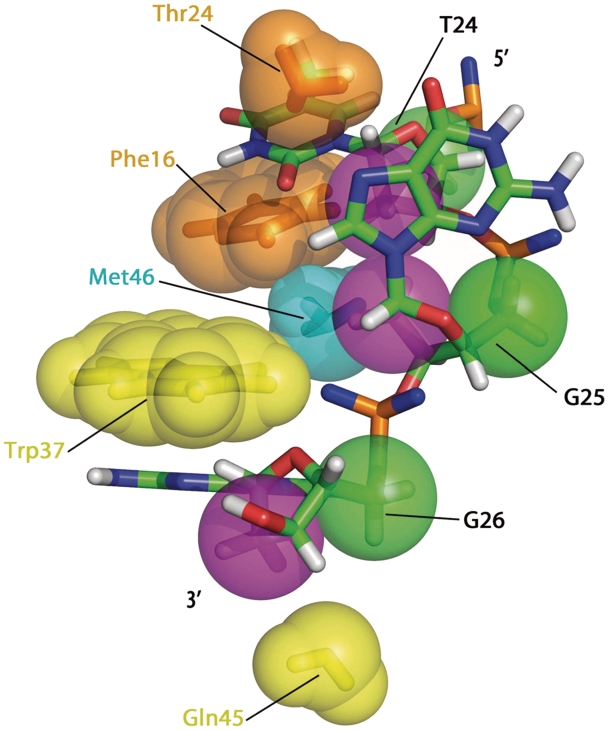
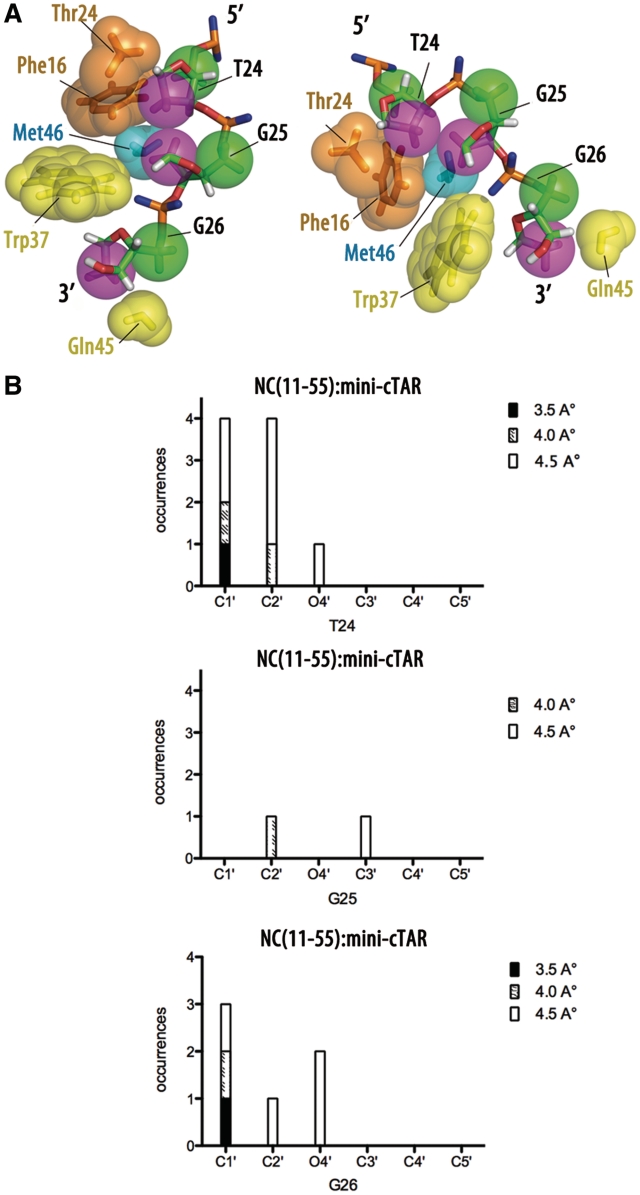
Numerous packing interactions involving not only the nucleobases of T24 and G26 but also the ribose moieties and phosphodiester backbones of T24, G25 and G26 characterize the NC(11-55):mini-cTAR complex. Contacts were identified by measuring the distances between the protein and DNA atoms following an approach followed in others studies (47). In DNA, the C1′ and C2′ carbons are mainly involved in contacts with protein hydrophobic groups, namely the aromatic side chain of Phe16 and Trp37, and the methyl groups of Thr24, Met46 and Val13. It is interesting to note that for the three residues T24, G25 and G26, hydrophobic contacts occur with the same ‘side’ of sugars. Indeed, if we define two sides for the deoxyribose sugars: one containing the C1′, C2′ and O4′ atoms (‘side’ 1), and another with the C4′ and C5′ atoms (‘side’ 2), we observe that hydrophobic contacts are made always with the ‘side’ 1. This is exemplified in Figures 8 and 9, where the violet spheres corresponding to ‘side’ 1 are clearly closer to the protein hydrophobic groups than the green spheres representing the ‘side’ 2. The contacts have been quantified following the approach depicted in Tolstorukov et al. (47) that consists to measure the close distance between atoms involved in van der Waals interactions and the results are reported in Figure 9B. Such a protein–DNA recognition involving deoxyribose sugars appears therefore as a possible means to stabilize the complex through contacts involving hydrophobic side chains.
Figure 8.
View of the NC(11-55):mini-cTAR complex displaying the hydrophobic contacts between the two partners. Hydrophobic side chains of Thr24, Phe16, Met46 Trp37, Gln45 residues of NC(11-55) are indicated by spheres of various colors. For the oligonucleotide, the C2′ and C5′ atoms are indicated by violet and green spheres, respectively.
Figure 9.
Hydrophobic contacts associated with the deoxyribose rings in the NC(11-55):mini-cTAR. (A) Two different views of the NC(11-55):mini-cTAR complex displaying the hydrophobic contacts involving the deoxyribose rings. Protein side chains in close contacts with deoxyriboses are displayed as spheres. For a better visualization of the contacts, the nucleobases of the nucleotide residues are not represented. In the deoxyriboses, C2′ and C5′ atoms are indicated by violet and green spheres, respectively. (B) Cumulative numbers of protein-DNA contacts involving sugar atoms in the NC(11-55):mini-cTAR complex. Contacts with sugars involve atoms C1′, C2′, O4′, C3′, C4′ and C5′ for the three residues T24, G25 and G26. The contacts were counted within three cutoff distances: 3.5 Å (black areas in the bars), 4.0 Å (hatched areas) and 4.5 Å (white areas).
Gel retardation analysis of the interaction between mini-cTAR DNA and NC(11-55)
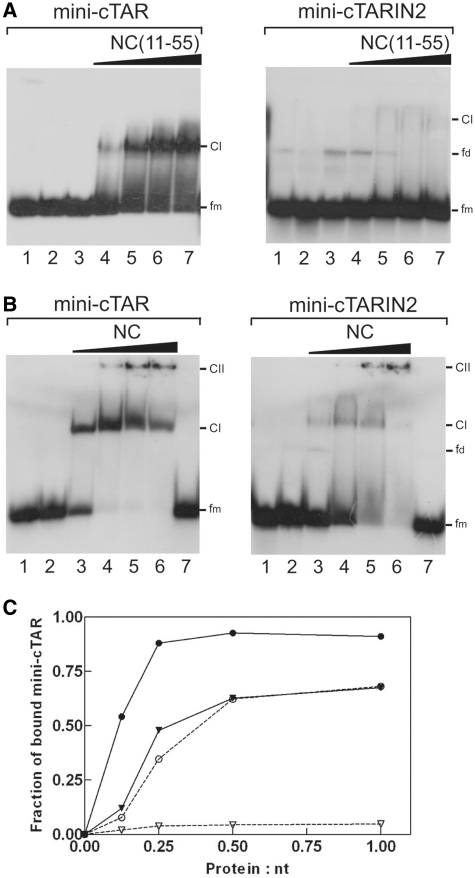
To confirm that the T24GG26 sequence is accessible to NC and the apical loop of mini-cTAR is not a strong binding site for NC, we carried out gel retardation assays with mini-cTAR and the mini-cTARIN2 mutant (Figure 10). In the mutant, the internal loop was deleted, while the apical loop was preserved (Figure 1A). As a consequence of the deletion of the internal loop, the T24GG26 sequence of mini-cTARIN2 is predicted to be included in a stable double-stranded stem. Heat-denatured mini-cTAR DNAs (Figure 10A and B, lanes 2 and 1, respectively) were used to locate the position of monomeric mini-cTAR DNAs. To identify the positions of bands corresponding to dimeric mini-cTAR DNAs, the proteins were removed before gel analysis (Figure 10A and B, lanes 1 and 7, respectively). After renaturation and incubation at a protein to nucleotide molar ratio of 1:1, the majority of mini-cTAR DNAs remained monomeric (Figure 10A and B, lanes 1 and 7, respectively). Addition of increasing amounts of NC(11-55) resulted in the appearance of band CI migrating at a rate expected for the NC(11-55):mini-cTAR complex (Figure 10A). Interestingly, the amount of protein-RNA complexes was barely detectable with the IN2 mutant, showing that the apical loop is not responsible for tight binding of NC(11-55) to mini-cTAR. Addition of increasing amounts of NC resulted in two bands (Figure 10B), namely the band CI migrating at a rate expected for the NC:mini-cTAR complex and the band CII corresponding to high-molecular-weight protein:mini-cTAR complexes (aggregates) that remained at the top of wells. Deletion of the internal loop significantly reduced the binding of NC to the IN2 mutant (Figure 10B and C).
Figure 10.
Gel retardation assays of protein:mini-cTAR DNA complexes formed in vitro. Mini-cTAR 32P-DNAs were incubated in presence of NC(11-55) (A) or NC (B) and analyzed by electrophoresis on a 14 % polyacrylamide gel as described in ‘Materials and Methods’ section. (A) Lane 1, controls mini-cTAR dimerization induced by NC(11-55) at a protein to nucleotide molar ratio of 1:1 (NC(11-55) was removed by phenol/chloroform before gel electrophoresis); lane 2, heat-denatured mini-cTAR DNAs; lanes 3, controls without protein; lanes 4–7, protein to nucleotide molar ratios were 1:8, 1:4, 1:2 and 1:1. (B) Lane 1, heat-denatured mini-cTAR DNAs; lane 2, controls without protein; lanes 3–6, protein to nucleotide molar ratios were 1:8, 1:4, 1:2 and 1:1; lane 7, controls mini-cTAR dimerization induced by NC at a protein to nucleotide molar ratio of 1:1 (NC was removed by phenol/chloroform before gel electrophoresis). Monomeric and dimeric forms of free mini-cTAR DNAs are indicated by fm and fd, respectively. CI indicates the protein:mini-cTAR complexes. CII indicates the high-molecular-mass protein:mini-cTAR complexes (aggregates). (C) Fraction of bound mini-cTAR as a function of the protein/oligonucleotide (expressed in nt) ratio. The graph was derived from the experiments shown in (A) and (B). Continuous line, mini-cTAR; broken lines, mini-cTARIN2; triangles, NC(11-55); circles, NC.
DISCUSSION
Nucleic acid sequence recognition by NC
NC preferentially binds single-stranded nucleic acids containing unpaired guanine residues (14,17). Structural and kinetic studies reported that the RNA apical loops displaying the GNG sequences constitute high-affinity-binding sites for NC (36–38). Moreover, studies performed with DNA oligonucleotides showed that NC binds with high affinity the TG, GNG and TNG sequences (23,48,49). Thus, similar preferences rules appear to be applicable to DNA and RNA sequences. Structural studies showed that three or four nucleic acid residues are involved in the protein binding and that in all cases a guanine residue is inserted deeply in a hydrophobic pocket located in the C-terminal zinc knuckle (34–38).
Most of the structures of NC:nucleic acid complexes reported to date were determined with stem–loop structures containing only one binding site for HIV-1 NC in the apical loop (35,37,50). The only exception is ΔP(–)PBS where two NC binding sites were reported: a high affinity site in the apical loop and a low affinity site (the CGG sequence) in the short stem (34). Mini-cTAR is thought to possess three potential NC binding sites, since it contains (Figure 1) two unpaired guanine residues in the apical loop, one unpaired guanine residue in the internal loop and a TG dinucleotide in the lower stem, which has been shown to alternate between single-stranded and double-stranded states (39). Therefore, mini-cTAR constitutes a good model to provide insights into the mechanisms of NC:DNA recognition and NC ability to discriminate between different putative binding sites. Our data show that NC(11-55) binds specifically to the T24GG26 sequence located in the unstable lower stem of mini-cTAR. A low-affinity-binding site was detected by ITC, but could not be further characterized by NMR experiments. Interestingly, chemical shift perturbations and inter-molecular NOEs showed that there is no significant NC binding to both the apical loop and the internal loop. Gel retardation experiments confirmed that the binding of NC(11-55) to the apical loop is very low since the amount of protein-RNA complexes was barely detectable with the mini-cTARIN2 mutant, where the internal loop is deleted but the apical loop is preserved (Figure 10). The apical loop is probably not a high affinity site for NC since its two unpaired guanine residues are involved in stacking interactions with neighbor residues, so that their availability to contact protein residues is limited (39). A similar conclusion could be reached with the G20 nucleobase in the internal loop, which was shown to be involved in a conformational exchange with neighbor nucleobases in the free form of mini-cTAR, so that residue G20 could pair with residue A5 or stack with residues A5 and A21 (39). In contrast, the G26 residue at the 3′ end is probably the most accessible unpaired guanine residue since the lower stem is strongly destabilized by the internal loop.
Interestingly, the binding site that we identified in mini-cTAR could be written as TNG, T24 and G26 being the two nucleobases making stacking interactions with Phe16 and Trp37, respectively. By contrast, the G25 nucleobase (N) does not make strong stacking interactions with NC(11-55) amino acids, suggesting that the T24G25 dinucleotide does not constitute a high-affinity-binding motif in mini-cTAR. Moreover, comparison of the NC(11-55):mini-cTAR complex with the NC(12-55):ΔP(–)PBS complex (34) indicates that residues T24 and G26 in mini-cTAR and the TG dinucleotide in the apical loop of ΔP(–)PBS play a similar role in the binding to NC. However, in contrast to the known NC:DNA complexes (34,35), a third residue (G25) makes electrostatic and hydrophobic contacts with NC(11-55). This is also the case in the NC:RNA complexes (37,50).
Our results underline that NC is able to discriminate between different guanine-containing motifs in single-stranded DNAs. The NC binding strength appears to depend on (i) the accessibility of the guanine residue and (ii) the presence of a thymine residue that can form specific hydrophobic interactions. These two factors converge toward the selection of the TNG site in the mini-cTAR hairpin. These data confirm the ability of NC to recognize specific sequences among various sites (48,49).
NC binds to DNAs and RNAs with opposite polarities
The interaction of the G26 residue in mini-cTAR with the C-terminal zinc knuckle through stacking interactions and numerous hydrogen bonds is highly similar to that observed with the guanine residues in other NC:nucleic acid complexes (35,36). Moreover, the binding mode of T24 with Phe16 located in the N-terminal zinc knuckle is close to that reported for the T6 residue of Δ(–)PBS (34). The binding mode of NC(11-55) to mini-cTAR could be considered to be intermediate between the two alternatives modes of NC binding already known. In the first mode characterized with DNA oligonucleotides (34,35), the C-terminal zinc knuckle (designated F2) interacts with a guanine residue and the N-terminal zinc knuckle (designated F1) interacts with the residue (C or T) immediately upstream to the guanine residue. In the second mode characterized in the three NC:RNA complexes (37,38,50), F1 and F2 interact (through both hydrogen bonding and stacking interactions) with two guanine residues separated by a third residue, i.e. the recognized sequence is GNG (36–38); in this latter mode F1 interacts with the nucleobase located at the 3′ side of the nucleobase interacting with F2. In the complex presented here, G26 interacts with F2 and T24 interacts with F1 like in the first mode but a third residue, G25, interacts with F2 which is a feature only found in the second mode. Note that in all the solved structures of NC:nucleic acid complexes (six with this study), Trp37 interacts with a guanine residue.
The binding polarity of NC complexed to mini-cTAR is similar to that observed in the two previously NMR-solved structures of NC:DNA complexes (34,35) but opposite to that observed in the NC:RNA complexes (37,50), where F1 recognizes a residue located downstream (3′) to the G residue recognized by F2. Thus, our data support the notion that the N to C-terminal chain of the protein is parallel to the 5′ to 3′ direction of DNA strand but antiparallel to the 5′ to 3′ direction of RNA strand.
Role of the sugars in the nucleic acid binding polarity of NC
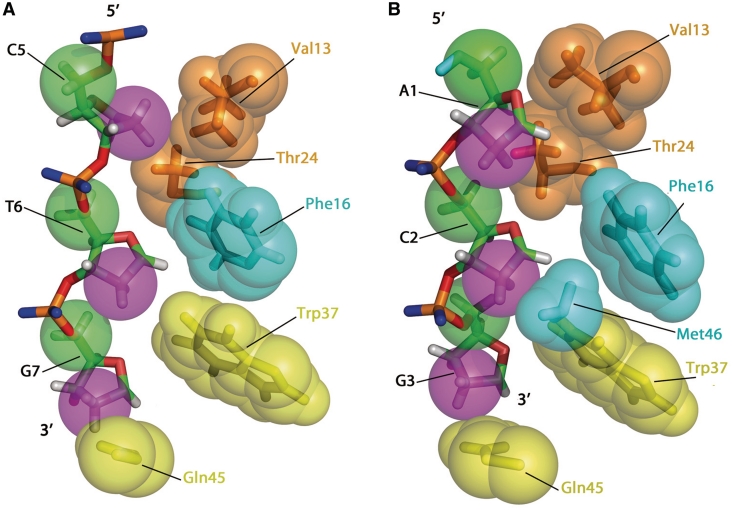
As underlined in recent studies (34,51), the NC:nucleic acids complexes are stabilized by hydrophobic, electrostatic and hydrogen bonding interactions. Most hydrophobic stacking interactions involve the G and T nucleobases and the Phe16 and Trp37 aromatic side chains. However, the NC(11-55):mini-cTAR complex shows also numerous hydrophobic contacts involving deoxyribose sugars. To obtain a clear view of the DNA atoms involved in these contacts, we measured the distances between the carbons/oxygen atoms of the deoxyribose sugars and the carbons/oxygens/nitrogen atoms of NC(11-55) (Figure 9). Our analysis allowed to identify hydrophobic contacts between the side chains of hydrophobic residues (Phe16, Thr24, Trp37, Gln45 and Met46) and carbons C1′ and C2′ of the sugar ring of the T24, G25, G26 residues whereas only few hydrophobic contacts with carbons C4′ and C5′ were observed (Figures 8 and 9). Hydrophobic contacts are well identified between: (i) Phe16 and C2′ of T24, (ii) Met46 and C2′ of G25, (iii) Trp37 and O4′ and C1′ of G26. This network of interactions indicate that the ‘side’ of the deoxyribose sugar bearing C1′ and C2′ atoms is positioned in close proximity with the protein residues while the other ‘side’ with C4′ and C5′ atoms is directed towards the outside of the complex (see the differences between green (C5′) and violet (C2′) in Figures 8 and 9A). Interestingly, a similar set of contacts involving the same ‘side’ of the sugars was observed for the two other available NC:DNA complexes (34,35) (Figure 11), suggesting that these hydrophobic interactions with the deoxyribose sugars are a hallmark of the binding of NC to DNA sequences.
Figure 11.
Views of the NC(12-55):PBS complex (A) (34) and the NC(12-53):d(ACGCC) complex (B) (35) displaying the hydrophobic contacts with the deoxyribose rings. The color code is similar to those of Figure 9.
As mentioned above, the orientation of the RNA chain in the NC:RNA complexes is opposite to that of the DNA chain in the NC:DNA complexes. Investigation of the sugar ribose contacts with the hydrophobic groups of the protein in the NC:RNA complexes indicates strong differences with those observed for the deoxyribose sugars in NC:DNA complexes. In the NC:SL3 complex, atoms O4′, C4′ and C5′ of G210 and A211 sugars are in close contacts with Phe16 while C2′ atoms bearing the polar OH, is far from the protein residues (Supplementary Figure S3). Similarly, in the NC:SL2 complex only the sugar atoms C4′ and C5′ of U210 are in close contact with Phe16 aromatic side chain (data not shown). Note also for these two complexes and particularly for the NC:SL3 complex the strong contacts between the O4′ and Phe16 that are not observed in the NC(11-55):DNA complexes (Supplementary Figure S3). Thus, in the NC:RNA complexes, the C2′ atoms bearing the polar OH group do not participate to the hydrophobic interface of the complex, while it is strongly involved in the DNA–protein interaction (Figure 8 and Supplementary Figure S3). We suggest that, due to the additional hydroxyl group at the C2′ position riboses as compared to deoxyriboses, the hydrophobic contacts of the sugars with the protein strongly differ in the two types of complexes. While the C2′, C1′ ‘side’ of the deoxyribose sugar is largely hydrophobic and is therefore involved in contacts with hydrophobic side chains of the protein, the same ‘side’ in RNA sugars is hydrophilic and does not participate in NC binding.
Therefore, we propose that the different sugar–protein contacts in the two kinds of complexes play an important role in the determination of the nucleic acid binding polarity of NC. Investigation of inter-molecular contacts in a great number of RNA:proteins complexes underscores the fact that although many researchers frequently focus their analysis on interactions between nucleobases and amino acid side chains, contacts involving nucleotide sugar constitute a significant and underestimated part of protein–nucleic acid interactions (52,53). Concerning contacts involving DNA sugars, statistical studies show that their contribution is minor in double-stranded nucleic acids except when the protein interacts mainly with the minor groove, (47,52,53). This is expected since the sugar deoxyriboses are hardly accessible in the major groove of double-stranded nucleic acids. The situation is very different when the protein contacts single-stranded in which sugar deoxyriboses are not buried in double helix, as it is probably the case for the lower stem of mini-cTAR. Indeed, the lower stem is not formed or the base pairing interaction between nucleotides C1CAG4 and C23TGG26 is only transient (39). The ability of NC to contact sugars through hydrophobic contacts could be critical for the selection of single stranded versus double-stranded nucleic acids. NC also recognizes single-stranded nucleic acids by interacting with unpaired nucleobases and more specifically with guanine residues. It is therefore likely that NC discriminates single-stranded from double-stranded nucleic acids recognizing unpaired nucleobases (guanines) and accessible sugars.
CONCLUSIONS
An important property of NC, which has been characterized by our study and the analysis of the available structural data, is its ability to recognize the polarity of the nucleic acid chain. This property is probably important for the strand transfer events occurring during reverse transcription and responsible for recombination. Interestingly, this property is shared by the family of proteins possessing an OB-fold (oligosaccharide/oligonucleotide binding fold). Most of the members of this family (RPA, EcSSB and BRCA2) are proteins involved in the DNA recombination (54–56).
Besides structural information, the present work underlines the ability of NC to select the TGG sequence among three putative regions possessing unpaired guanines. The reasons for this preferential binding, mobility and accessibility of residues and role of the context sequence will be investigated in future studies. Additional experiments will be necessary to demonstrate that the TGG sequence is really a strong binding site for NC in the full-length cTAR hairpin or in an extended version of mini-cTAR. Identification of preferred binding sites in the TAR and cTAR molecules is necessary to propose models for the annealing mechanism mediated by NC. However, to get a real insight into this mechanism, experiments involving the three partners TAR, cTAR and NC are required.
ACCESSION NUMBER
Coordinates for the final 10 structures has been deposited in the Protein Data Bank with the accession number 2L4L.
SUPPLEMENTARY DATA
Supplementary Data are available at NAR Online.
FUNDING
Agence Nationale de Recherche sur le Sida (to P.F. and O.M.). Funding for open access charge: Centre National de la Recherche Scientifique (CNRS LBPA UMR 8113).
Conflict of interest statement. None declared.
Supplementary Material
ACKNOWLEDGEMENTS
We thank Nelly Morellet from the ICSN for her technical advice in the preparation of NC:oligonucleotide complexes
REFERENCES
- 1.D'Souza V, Summers MF. How retroviruses select their genomes. Nat. Rev. Microbiol. 2005;3:643–655. doi: 10.1038/nrmicro1210. [DOI] [PubMed] [Google Scholar]
- 2.Paillart JC, Shehu-Xhilaga M, Marquet R, Mak J. Dimerization of retroviral RNA genomes: an inseparable pair. Nat. Rev. Microbiol. 2004;2:461–472. doi: 10.1038/nrmicro903. [DOI] [PubMed] [Google Scholar]
- 3.Russell RS, Liang C, Wainberg MA. Is HIV-1 RNA dimerization a prerequisite for packaging? Yes, no, probably? Retrovirology. 2004;1:23. doi: 10.1186/1742-4690-1-23. [DOI] [PMC free article] [PubMed] [Google Scholar]
- 4.Onafuwa-Nuga A, Telesnitsky A. The remarkable frequency of human immunodeficiency virus type 1 genetic recombination. Microbiol. Mol. Biol. Rev. 2009;73:451–480. doi: 10.1128/MMBR.00012-09. Table of Contents. [DOI] [PMC free article] [PubMed] [Google Scholar]
- 5.Zhang J, Tang LY, Li T, Ma Y, Sapp CM. Most retroviral recombinations occur during minus-strand DNA synthesis. J. Virol. 2000;74:2313–2322. doi: 10.1128/jvi.74.5.2313-2322.2000. [DOI] [PMC free article] [PubMed] [Google Scholar]
- 6.Rigby ST, Rose AE, Hanson MN, Bambara RA. Mechanism analysis indicates that recombination events in HIV-1 initiate and complete over short distances, explaining why recombination frequencies are similar in different sections of the genome. J. Mol. Biol. 2009;388:30–47. doi: 10.1016/j.jmb.2009.02.029. [DOI] [PMC free article] [PubMed] [Google Scholar]
- 7.Moumen A, Polomack L, Unge T, Veron M, Buc H, Negroni M. Evidence for a mechanism of recombination during reverse transcription dependent on the structure of the acceptor RNA. J. Biol. Chem. 2003;278:15973–15982. doi: 10.1074/jbc.M212306200. [DOI] [PubMed] [Google Scholar]
- 8.Basu VP, Song M, Gao L, Rigby ST, Hanson MN, Bambara RA. Strand transfer events during HIV-1 reverse transcription. Virus Res. 2008;134:19–38. doi: 10.1016/j.virusres.2007.12.017. [DOI] [PubMed] [Google Scholar]
- 9.Kanevsky I, Chaminade F, Ficheux D, Moumen A, Gorelick R, Negroni M, Darlix JL, Fosse P. Specific interactions between HIV-1 nucleocapsid protein and the TAR element. J. Mol. Biol. 2005;348:1059–1077. doi: 10.1016/j.jmb.2005.03.046. [DOI] [PubMed] [Google Scholar]
- 10.Watts JM, Dang KK, Gorelick RJ, Leonard CW, Bess JW, Jr, Swanstrom R, Burch CL, Weeks KM. Architecture and secondary structure of an entire HIV-1 RNA genome. Nature. 2009;460:711–716. doi: 10.1038/nature08237. [DOI] [PMC free article] [PubMed] [Google Scholar]
- 11.Ohi Y, Clever JL. Sequences in the 5′ and 3′ R elements of human immunodeficiency virus type 1 critical for efficient reverse transcription. J. Virol. 2000;74:8324–8334. doi: 10.1128/jvi.74.18.8324-8334.2000. [DOI] [PMC free article] [PubMed] [Google Scholar]
- 12.Berkhout B, Vastenhouw NL, Klasens BI, Huthoff H. Structural features in the HIV-1 repeat region facilitate strand transfer during reverse transcription. RNA. 2001;7:1097–1114. doi: 10.1017/s1355838201002035. [DOI] [PMC free article] [PubMed] [Google Scholar]
- 13.Moumen A, Polomack L, Roques B, Buc H, Negroni M. The HIV-1 repeated sequence R as a robust hot-spot for copy-choice recombination. Nucleic Acids Res. 2001;29:3814–3821. doi: 10.1093/nar/29.18.3814. [DOI] [PMC free article] [PubMed] [Google Scholar]
- 14.Levin JG, Guo J, Rouzina I, Musier-Forsyth K. Nucleic acid chaperone activity of HIV-1 nucleocapsid protein: critical role in reverse transcription and molecular mechanism. Prog. Nucleic Acid Res. Mol. Biol. 2005;80:217–286. doi: 10.1016/S0079-6603(05)80006-6. [DOI] [PubMed] [Google Scholar]
- 15.Thomas JA, Gorelick RJ. Nucleocapsid protein function in early infection processes. Virus Res. 2008;134:39–63. doi: 10.1016/j.virusres.2007.12.006. [DOI] [PMC free article] [PubMed] [Google Scholar]
- 16.Vo MN, Barany G, Rouzina I, Musier-Forsyth K. HIV-1 nucleocapsid protein switches the pathway of transactivation response element RNA/DNA annealing from loop-loop “kissing” to “zipper”. J. Mol. Biol. 2009;386:789–801. doi: 10.1016/j.jmb.2008.12.070. [DOI] [PMC free article] [PubMed] [Google Scholar]
- 17.Darlix JL, Garrido JL, Morellet N, Mely Y, de Rocquigny H. Properties, functions, and drug targeting of the multifunctional nucleocapsid protein of the human immunodeficiency virus. Adv. Pharmacol. 2007;55:299–346. doi: 10.1016/S1054-3589(07)55009-X. [DOI] [PubMed] [Google Scholar]
- 18.Zuniga S, Sola I, Cruz JL, Enjuanes L. Role of RNA chaperones in virus replication. Virus Res. 2009;139:253–266. doi: 10.1016/j.virusres.2008.06.015. [DOI] [PMC free article] [PubMed] [Google Scholar]
- 19.Beltz H, Azoulay J, Bernacchi S, Clamme JP, Ficheux D, Roques B, Darlix JL, Mely Y. Impact of the terminal bulges of HIV-1 cTAR DNA on its stability and the destabilizing activity of the nucleocapsid protein NCp7. J. Mol. Biol. 2003;328:95–108. doi: 10.1016/s0022-2836(03)00244-4. [DOI] [PubMed] [Google Scholar]
- 20.Beltz H, Piemont E, Schaub E, Ficheux D, Roques B, Darlix JL, Mely Y. Role of the structure of the top half of HIV-1 cTAR DNA on the nucleic acid destabilizing activity of the nucleocapsid protein NCp7. J. Mol. Biol. 2004;338:711–723. doi: 10.1016/j.jmb.2004.03.019. [DOI] [PubMed] [Google Scholar]
- 21.Beltz H, Clauss C, Piemont E, Ficheux D, Gorelick RJ, Roques B, Gabus C, Darlix JL, de Rocquigny H, Mely Y. Structural determinants of HIV-1 nucleocapsid protein for cTAR DNA binding and destabilization, and correlation with inhibition of self-primed DNA synthesis. J. Mol. Biol. 2005;348:1113–1126. doi: 10.1016/j.jmb.2005.02.042. [DOI] [PubMed] [Google Scholar]
- 22.Godet J, de Rocquigny H, Raja C, Glasser N, Ficheux D, Darlix JL, Mely Y. During the early phase of HIV-1 DNA synthesis, nucleocapsid protein directs hybridization of the TAR complementary sequences via the ends of their double-stranded stem. J. Mol. Biol. 2006;356:1180–1192. doi: 10.1016/j.jmb.2005.12.038. [DOI] [PubMed] [Google Scholar]
- 23.Avilov SV, Piemont E, Shvadchak V, de Rocquigny H, Mely Y. Probing dynamics of HIV-1 nucleocapsid protein/target hexanucleotide complexes by 2-aminopurine. Nucleic Acids Res. 2008;36:885–896. doi: 10.1093/nar/gkm1109. [DOI] [PMC free article] [PubMed] [Google Scholar]
- 24.Williams MC, Gorelick RJ, Musier-Forsyth K. Specific zinc-finger architecture required for HIV-1 nucleocapsid protein's nucleic acid chaperone function. Proc. Natl Acad. Sci. USA. 2002;99:8614–8619. doi: 10.1073/pnas.132128999. [DOI] [PMC free article] [PubMed] [Google Scholar]
- 25.Williams MC, Rouzina I, Wenner JR, Gorelick RJ, Musier-Forsyth K, Bloomfield VA. Mechanism for nucleic acid chaperone activity of HIV-1 nucleocapsid protein revealed by single molecule stretching. Proc. Natl Acad. Sci. USA. 2001;98:6121–6126. doi: 10.1073/pnas.101033198. [DOI] [PMC free article] [PubMed] [Google Scholar]
- 26.Stoylov SP, Vuilleumier C, Stoylova E, De Rocquigny H, Roques BP, Gerard D, Mely Y. Ordered aggregation of ribonucleic acids by the human immunodeficiency virus type 1 nucleocapsid protein. Biopolymers. 1997;41:301–312. doi: 10.1002/(SICI)1097-0282(199703)41:3<301::AID-BIP5>3.0.CO;2-W. [DOI] [PubMed] [Google Scholar]
- 27.Le Cam E, Coulaud D, Delain E, Petitjean P, Roques BP, Gerard D, Stoylova E, Vuilleumier C, Stoylov SP, Mely Y. Properties and growth mechanism of the ordered aggregation of a model RNA by the HIV-1 nucleocapsid protein: an electron microscopy investigation. Biopolymers. 1998;45:217–229. doi: 10.1002/(SICI)1097-0282(199803)45:3<217::AID-BIP4>3.0.CO;2-U. [DOI] [PubMed] [Google Scholar]
- 28.Mirambeau G, Lyonnais S, Coulaud D, Hameau L, Lafosse S, Jeusset J, Justome A, Delain E, Gorelick RJ, Le Cam E. Transmission electron microscopy reveals an optimal HIV-1 nucleocapsid aggregation with single-stranded nucleic acids and the mature HIV-1 nucleocapsid protein. J. Mol. Biol. 2006;364:496–511. doi: 10.1016/j.jmb.2006.08.065. [DOI] [PubMed] [Google Scholar]
- 29.Vo MN, Barany G, Rouzina I, Musier-Forsyth K. Mechanistic studies of mini-TAR RNA/DNA annealing in the absence and presence of HIV-1 nucleocapsid protein. J. Mol. Biol. 2006;363:244–261. doi: 10.1016/j.jmb.2006.08.039. [DOI] [PubMed] [Google Scholar]
- 30.Vo MN, Barany G, Rouzina I, Musier-Forsyth K. Effect of Mg(2+) and Na(+) on the nucleic acid chaperone activity of HIV-1 nucleocapsid protein: implications for reverse transcription. J. Mol. Biol. 2009;386:773–788. doi: 10.1016/j.jmb.2008.12.073. [DOI] [PMC free article] [PubMed] [Google Scholar]
- 31.Liu HW, Cosa G, Landes CF, Zeng Y, Kovaleski BJ, Mullen DG, Barany G, Musier-Forsyth K, Barbara PF. Single-molecule FRET studies of important intermediates in the nucleocapsid-protein-chaperoned minus-strand transfer step in HIV-1 reverse transcription. Biophys. J. 2005;89:3470–3479. doi: 10.1529/biophysj.105.065326. [DOI] [PMC free article] [PubMed] [Google Scholar]
- 32.Liu HW, Zeng Y, Landes CF, Kim YJ, Zhu Y, Ma X, Vo MN, Musier-Forsyth K, Barbara PF. Insights on the role of nucleic acid/protein interactions in chaperoned nucleic acid rearrangements of HIV-1 reverse transcription. Proc. Natl Acad. Sci. USA. 2007;104:5261–5267. doi: 10.1073/pnas.0700166104. [DOI] [PMC free article] [PubMed] [Google Scholar]
- 33.Zeng Y, Liu HW, Landes CF, Kim YJ, Ma X, Zhu Y, Musier-Forsyth K, Barbara PF. Probing nucleation, reverse annealing, and chaperone function along the reaction path of HIV-1 single-strand transfer. Proc. Natl Acad. Sci. USA. 2007;104:12651–12656. doi: 10.1073/pnas.0700350104. [DOI] [PMC free article] [PubMed] [Google Scholar]
- 34.Bourbigot S, Ramalanjaona N, Boudier C, Salgado GF, Roques BP, Mely Y, Bouaziz S, Morellet N. How the HIV-1 nucleocapsid protein binds and destabilises the (-)primer binding site during reverse transcription. J. Mol. Biol. 2008;383:1112–1128. doi: 10.1016/j.jmb.2008.08.046. [DOI] [PubMed] [Google Scholar]
- 35.Morellet N, Demene H, Teilleux V, Huynh-Dinh T, de Rocquigny H, Fournie-Zaluski MC, Roques BP. Structure of the complex between the HIV-1 nucleocapsid protein NCp7 and the single-stranded pentanucleotide d(ACGCC) J. Mol. Biol. 1998;283:419–434. doi: 10.1006/jmbi.1998.2098. [DOI] [PubMed] [Google Scholar]
- 36.De Guzman RN, Wu ZR, Stalling CC, Pappalardo L, Borer PN, Summers MF. Structure of the HIV-1 nucleocapsid protein bound to the SL3 psi-RNA recognition element. Science. 1998;279:384–388. doi: 10.1126/science.279.5349.384. [DOI] [PubMed] [Google Scholar]
- 37.Amarasinghe GK, De Guzman RN, Turner RB, Chancellor KJ, Wu ZR, Summers MF. NMR structure of the HIV-1 nucleocapsid protein bound to stem-loop SL2 of the psi-RNA packaging signal. Implications for genome recognition. J. Mol. Biol. 2000;301:491–511. doi: 10.1006/jmbi.2000.3979. [DOI] [PubMed] [Google Scholar]
- 38.Spriggs S, Garyu L, Connor R, Summers MF. Potential intra- and intermolecular interactions involving the unique-5′ region of the HIV-1 5′-UTR. Biochemistry. 2008;47:13064–13073. doi: 10.1021/bi8014373. [DOI] [PMC free article] [PubMed] [Google Scholar]
- 39.Zargarian L, Kanevsky I, Bazzi A, Boynard J, Chaminade F, Fosse P, Mauffret O. Structural and dynamic characterization of the upper part of the HIV-1 cTAR DNA hairpin. Nucleic Acids Res. 2009;37:4043–4054. doi: 10.1093/nar/gkp297. [DOI] [PMC free article] [PubMed] [Google Scholar]
- 40.de Rocquigny H, Ficheux D, Gabus C, Fournie-Zaluski MC, Darlix JL, Roques BP. First large scale chemical synthesis of the 72 amino acid HIV-1 nucleocapsid protein NCp7 in an active form. Biochem. Biophys. Res. Commun. 1991;180:1010–1018. doi: 10.1016/s0006-291x(05)81166-0. [DOI] [PubMed] [Google Scholar]
- 41.Griesinger C, Otting G, Wuthrich K, Ernst RR. Clean Tocsy for H-1 spin system-identification in macromolecules. J. Am. Chem. Soc. 1988;110:7870–7872. [Google Scholar]
- 42.Piotto M, Saudek V, Sklenar V. Gradient-tailored excitation for single-quantum NMR spectroscopy of aqueous solutions. J. Biomol. NMR. 1992;2:661–665. doi: 10.1007/BF02192855. [DOI] [PubMed] [Google Scholar]
- 43.Brunger AT. Version 3.1 Manual. New Haven CT: Yale University Press; 1982. [Google Scholar]
- 44.Brunger AT, Adams PD, Clore GM, DeLano WL, Gros P, Grosse-Kunstleve RW, Jiang JS, Kuszewski J, Nilges M, Pannu NS, et al. Crystallography & NMR system: A new software suite for macromolecular structure determination. Acta Crystallogr. D. Biol. Crystallogr. 1998;54(Pt 5):905–921. doi: 10.1107/s0907444998003254. [DOI] [PubMed] [Google Scholar]
- 45.Morellet N, Jullian N, De Rocquigny H, Maigret B, Darlix JL, Roques BP. Determination of the structure of the nucleocapsid protein NCp7 from the human immunodeficiency virus type 1 by 1H NMR. EMBO J. 1992;11:3059–3065. doi: 10.1002/j.1460-2075.1992.tb05377.x. [DOI] [PMC free article] [PubMed] [Google Scholar]
- 46.Wang ZX. An exact mathematical expression for describing competitive binding of two different ligands to a protein molecule. FEBS Lett. 1995;360:111–114. doi: 10.1016/0014-5793(95)00062-e. [DOI] [PubMed] [Google Scholar]
- 47.Tolstorukov MY, Jernigan RL, Zhurkin VB. Protein–DNA hydrophobic recognition in the minor groove is facilitated by sugar switching. J. Mol. Biol. 2004;337:65–76. doi: 10.1016/j.jmb.2004.01.011. [DOI] [PubMed] [Google Scholar]
- 48.Vuilleumier C, Bombarda E, Morellet N, Gerard D, Roques BP, Mely Y. Nucleic acid sequence discrimination by the HIV-1 nucleocapsid protein NCp7: a fluorescence study. Biochemistry. 1999;38:16816–16825. doi: 10.1021/bi991145p. [DOI] [PubMed] [Google Scholar]
- 49.Avilov SV, Godet J, Piemont E, Mely Y. Site-specific characterization of HIV-1 nucleocapsid protein binding to oligonucleotides with two binding sites. Biochemistry. 2009;48:2422–2430. doi: 10.1021/bi8022366. [DOI] [PubMed] [Google Scholar]
- 50.De Guzman RN, Wu ZR, Stalling CC, Pappalardo L, Borer PN, Summers MF. Structure of the HIV-1 nucleocapsid protein bound to the SL3 psi-RNA recognition element. Science. 1998;279:384–388. doi: 10.1126/science.279.5349.384. [DOI] [PubMed] [Google Scholar]
- 51.Mori M, Dietrich U, Manetti F, Botta M. Molecular dynamics and DFT study on HIV-1 nucleocapsid protein-7 in complex with viral genome. J. Chem. Inf. Model. 2010;51:638–650. doi: 10.1021/ci100070m. [DOI] [PubMed] [Google Scholar]
- 52.Hoffman MM, Khrapov MA, Cox JC, Yao J, Tong L, Ellington AD. AANT: the Amino Acid-Nucleotide Interaction Database. Nucleic Acids Res. 2004;32:D174–D181. doi: 10.1093/nar/gkh128. [DOI] [PMC free article] [PubMed] [Google Scholar]
- 53.Treger M, Westhof E. Statistical analysis of atomic contacts at RNA–protein interfaces. J. Mol. Recognit. 2001;14:199–214. doi: 10.1002/jmr.534. [DOI] [PubMed] [Google Scholar]
- 54.Yang H, Jeffrey PD, Miller J, Kinnucan E, Sun Y, Thoma NH, Zheng N, Chen PL, Lee WH, Pavletich NP. BRCA2 function in DNA binding and recombination from a BRCA2-DSS1-ssDNA structure. Science. 2002;297:1837–1848. doi: 10.1126/science.297.5588.1837. [DOI] [PubMed] [Google Scholar]
- 55.Theobald DL, Mitton-Fry RM, Wuttke DS. Nucleic acid recognition by OB-fold proteins. Annu. Rev. Biophys. Biomol. Struct. 2003;32:115–133. doi: 10.1146/annurev.biophys.32.110601.142506. [DOI] [PMC free article] [PubMed] [Google Scholar]
- 56.Bochkarev A, Bochkareva E. From RPA to BRCA2: lessons from single-stranded DNA binding by the OB-fold. Curr. Opin. Struct. Biol. 2004;14:36–42. doi: 10.1016/j.sbi.2004.01.001. [DOI] [PubMed] [Google Scholar]
Associated Data
This section collects any data citations, data availability statements, or supplementary materials included in this article.


