Abstract
We report procedures to allow incorporation and detection of 5-ethynyl-2′-deoxyuridine (EdU) in fission yeast, a thymidine analogue which has some technical advantages over use of bromodeoxyuridine. Low concentrations of EdU (1 µM) are sufficient to allow detection of incorporation in cells expressing thymidine kinase and human equilibrative nucleoside transporter 1 (hENT1). However EdU is toxic and activates the rad3-dependent checkpoint, resulting in cell cycle arrest, potentially limiting its applications for procedures which require labelling over more than one cell cycle. Limited DNA synthesis, when elongation is largely blocked by hydroxyurea, can be readily detected by EdU incorporation using fluorescence microscopy. Thus EdU should be useful for detecting early stages of S phase, or DNA synthesis associated with DNA repair and recombination.
INTRODUCTION
Detection of DNA replication by incorporation of halogenated nucleotides is of considerable use in monitoring S phase, cell proliferation, DNA repair and DNA recombination (1–6). In combination with DNA combing, newly replicated regions of chromosomes can be directly observed, allowing single molecule analyses of origin firing and rate of fork movement (7,8). Use of bromodeoxyuridine (BrdU) and related nucleosides presents some technical difficulties however, in that antibodies are used to detect incorporation, which requires DNA to be converted to a single-stranded form and permeabilization of fixed cells is needed. Recently, the use of 5-ethynyl-2′-deoxyuridine (EdU) has been described to detect DNA replication (9). This thymidine analogue contains an alkyne group which can be conjugated to a fluorescently labelled azide in a Cu(I)-catalyzed ‘click’ reaction. One advantage of this method is that incorporation can be detected in double-stranded DNA, and the fluorescent label is a small permeable molecule, thus access to the DNA is less of a problem than when using antibodies.
Here, we report simple procedures to enable labelling of fission yeast DNA with EdU and detection by flow cytometry and fluorescence microscopy. At levels which allow detection, EdU incorporation is toxic and activates the rad3-dependent checkpoint, which is a limitation for some experimental designs. Use of EdU in fission yeast has also been reported by the Forsburg lab in the Invitrogen Bioprobes series (Figure 3, http://www.invitrogen.com/etc/medialib/en/filelibrary/Support/BioProbes/BioProbes-61.Par.38879.File.dat/BioProbes-61-click-it-edu.pdf).
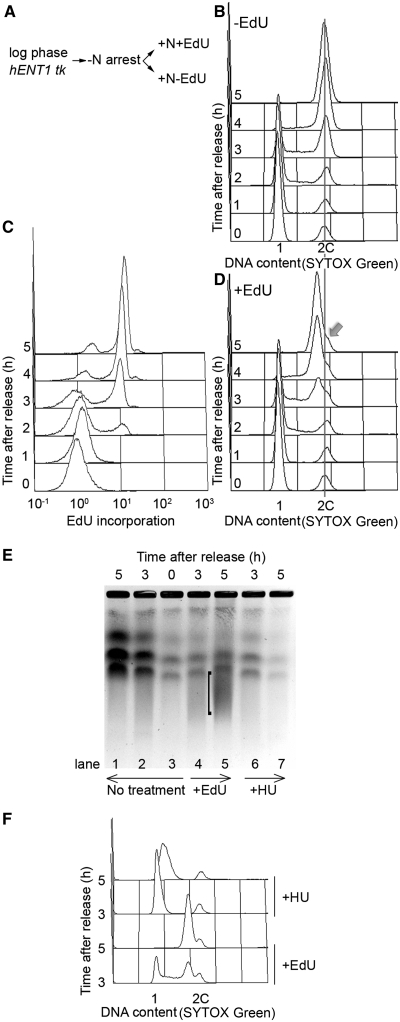
Figure 3.
Effects of EdU on the kinetics of DNA replication. (A) Scheme of experiment. adh1:tk adh1:hENT1 (P2470) cells were arrested in G1 by nitrogen starvation by growing in EMM lacking nitrogen for 16 h at 26°C, then released from the block at 32°C in EMM containing nitrogen, in the presence (1 μM) or absence of EdU, (B) Cells from the −EdU culture were processed for analysis of DNA content after SYTOX Green staining by flow cytometry in the absence of conjugation to fluorescent azide, (C) Cells from the +EdU culture were conjugated to fluorescent azide (Alexa Fluor 488) and fluorescence was quantitated by flow cytometry, (D) Cells from the +EdU culture were processed for analysis of DNA content after SYTOX Green staining by flow cytometry in the absence of conjugation to fluorescent azide. Cells arrested in G1 by nitrogen starvation (i.e. t = 0 time point) are mainly in G1 (1C), but 15–20% cells are in G2 (2C) (17); these cells have not replicated their DNA at the 5 h time point, and this shows as a shoulder (arrow) on the main 2C peak generated by replication of 1C cells. This peak is shifted to the left of the 2C position defined by the ‘G2 minus-nitrogen population’, probably due to some effect of EdU incorporation on SYTOX Green fluorescence (see text for further discussion). A longer time course shows disappearance of the shoulder at 6–7 h (Supplementary Figure S3) consistent with an earlier study showing that cells in the ‘G2 minus-nitrogen population’ replicate their DNA around this time (17), (E) Analysis of chromosomes by PFGE. DNA plugs were prepared from cells released from a G1 arrest as in (A) and grown without (lanes 1–3, ‘no treatment’) or with 10 μM EdU (lanes 4, 5, ‘+EdU’) for the times shown. As a control for partially replicated chromosomes, cells were grown in the presence of 12 mM HU (lanes 6–7 ‘+HU’). ‘[’indicates a smear in the 5 h +EdU sample, suggesting fragmented DNA. Equal quantities of cells were processed for each well. (F) Flow cytometric analysis of cells used to prepare samples shown in (E), showing that the HU block to DNA replication is maintained at the 5 h time point.
MATERIALS AND METHODS
Fission yeast methods and strain constructions
Strain construction and maintenance were as described previously, following standard procedures (10). Cells were grown in YE3S rich medium (Yeast Extract, supplemented with 250 mg/l adenine, uracil and leucine) or Edinburgh Minimal Medium (EMM) (10). Cells were arrested in G1 by growth in EMM lacking NH4Cl (EMM-N). Plasmids padh1prom-TK-kanMX6/pFS255, expressing herpes simplex thymidine kinase (TK) from the adh1 promoter, and padh1prom-hENT1-leu1/pFS181, expressing human equilibrative nucleoside transporter 1 (hENT1) from the adh1 promoter, were obtained from Addgene Inc (plasmids 12 382 and 12 536, respectively). adh1-TK was integrated into the adh1 locus by linearizing with MfeI; integration of the plasmid at adh1 was confirmed by colony PCR using the primers: 5′-CTACGACAAAAGAAGGCTAAAGGAATAGG-3′ and 5′-GCGGTCGAAGATGAGGGTGAGG-3′. adh1-hENT1 was integrated into the leu1-32 locus by linearizing with NruI; integration at leu1 was confirmed by colony PCR using the primers 5′-CAGACAAGCCCGTCAGGGCGCG-3′ and 5′-CAAAATACTTGCGAACCATCAAAGTGGAAAGG-3′.
Strains used were derived from P2 h− leu1-32. The following strains were used:
-
P2470 h− adh1::adh1prom-TK-kanMX6 leu1-32::adh1prom-hENT1-leu1+;
P2471 h− adh1::adh1prom-TK-kanMX6 leu1-32;
P2472 h− adh1::adh1prom-TK-kanMX6 leu1-32::adh1prom-hENT1-leu1+ rad3Δ::ura4+ ura4-D18.
Expression of TK in yeast was checked by growth sensitivity on YE3S plates containing 100 µM 5′-fluoro-2′-deoxyuridine (Sigma, F0503).
Detection of DNA content by flow cytometry
Cells (about 2×10⁶) were fixed in 70% ethanol and then treated with 0.1 mg/ml RNaseA in 10 mM EDTA pH 8.0 for at least 2 h at 37°C to eliminate RNA. Cells were stained with 1 µM SYTOX Green, sonicated and analysed using a Coulter Epics XL-MCL.
Determination of cell concentrations and cell viabilities
Cells were fixed in 80% formyl saline (0.9% NaCl, 3.7% formaldehyde) and cell concentrations were determined using a Sysmex F-820 Cell Counter (Kobe, Japan). To determine viabilities, cells were gently sonicated and 1000 cells were plated on YE3S plates.
Pulsed field gels
Pulsed field gel electrophoresis (PFGE) was carried out as previously described (11), using a 0.8% chromosomal grade agarose gel in TAE buffer (40 mM Tris–acetate, 2 mM EDTA, pH 8.3) in a CHEF III apparatus (Bio-Rad, Hercules, CA, USA). The settings were as follows: 2 V/cm; switch time, 30 min; angle, 106°; 14°C; 48 h.
EdU incorporation and detection
Cells were grown in YE3S or EMM medium containing EdU at the indicated concentration; EdU was added from a 10 mM stock in water. Following incorporation, cells were fixed by resuspending in 70% ethanol and washed in TBS (50 mM Tris, pH 7.4, 150 mM NaCl) twice. Approximately 2 × 10⁶ cells were resuspended in a freshly prepared cocktail containing 50 mM Tris, pH 7.4, 150 mM NaCl, 2 mM CuSO4, 10 µM Alexa Fluor 488 azide (added from 2 mM stock in DMSO; A10266, Invitrogen), 10 mM sodium ascorbate (added last from 0.1 M stock) and incubated in the dark for 30 min. Cells were washed in TBS twice, finally resuspending in 0.5 ml TBS. For detection of fluorescence by flow cytometry, cells were transferred to 1.5 ml Eppendorf tubes and sonicated for 20 s in a water bath (Diagenode Biorupter, power setting set to low/130 W) to break up the cell doublets before analysis using a Coulter Epics XL-MCL.
For analysis by fluorescence microscopy, cells were concentrated and mounted by mixing with an equal volume of 1.2% low melting temperature agarose, containing 50 ng/ml DAPI. Images were collected using a Zeiss Axioplan microscope, coupled to a Hamamatsu ORCA ER camera; open source µManager software (12) was used to control the camera and microscope.
RESULTS AND DISCUSSION
Strain modifications necessary for EdU incorporation
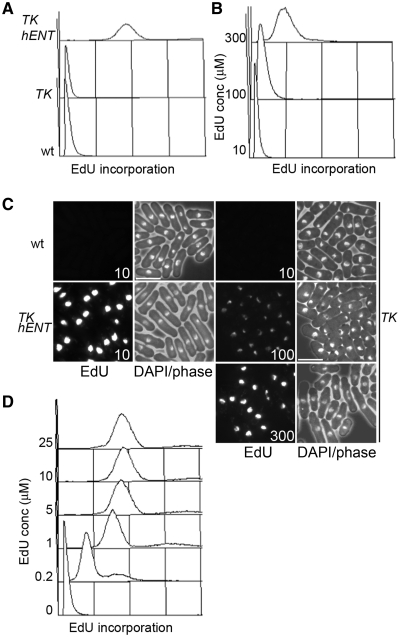
Efficient incorporation of BrdU into fission yeast requires expression of both TK and a nucleoside transporter (hENT1) (4,5), although moderately high levels of BrdU incorporation can be achieved by expression of TK alone (13). With medium containing 10 µM EdU, incorporation is readily detectable by flow cytometry and fluorescence microscopy with an adh1-TK adh1-hENT1 strain, whereas no incorporation was detectable when TK was expressed alone (Figure 1A and C). Only when EdU was used at a considerably higher concentration (100–300 µM) was incorporation detectable with a adh1-TK strain (Figure 1B and C). Using the adh1-TK adh1-hENT1 strain, higher concentrations of EdU did not result in an increased fluorescence signal by flow cytometry, and the concentration could be lowered to 1 µM with little reduction in sensitivity (Figure 1D).
Figure 1.
EdU incorporation in fission yeast strains expressing TK and hENT1. (A) Wild-type (P2), TK (adh1:tk, P2471) and TK hENT1 (adh1:tk adh1:hENT1, P2470) expressing strains were grown in YE3S containing 10 µM EdU for 3 h then fixed and conjugated to Alexa Fluor 488 azide before analysis by flow cytometry, (B) adh1:tk (P2471) cells were grown in YE3S containing the indicated concentrations of EdU for 3 h then analysed as in (A), (C) Cells from (A) and (B) were imaged by fluorescence microscopy. Bar = 10 µm and (D) adh1:tk adh1:hENT1 (P2470) cells were grown in YE3S containing the indicated concentrations of EdU for 3 h then processed as in (A) and analysed by flow cytometry. Linear x-axes are used to show EdU incorporation in all panels in this figure.
Effects of EdU incorporation on checkpoint activation and viability
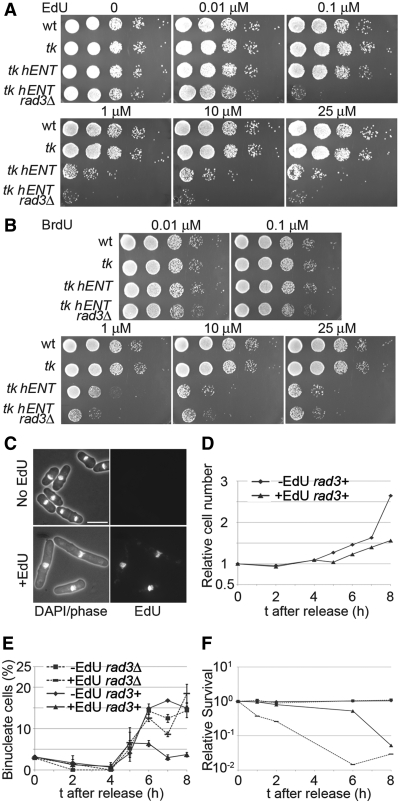
To determine whether growth in EdU has an effect on viability, dilutions of cells were spotted onto plates containing different concentrations of the nucleoside (Figure 2A); for comparison, strains were also spotted onto plates containing BrdU (Figure 2B). Wild-type cells, or cells expressing adh1-TK alone were not sensitive to EdU up to 25 µM, while cells expressing adh1-TK adh1-hENT1 showed reduced growth at 1 µM EdU. The sensitivity of adh1-TK adh1-hENT1 cells was exacerbated in a rad3Δ background, as growth was severely affected at a concentration of just 0.1 µM. This suggests that EdU incorporation leads to DNA damage and a functional rad3-dependent checkpoint mechanism is required for viability. In contrast to EdU, the rad3Δ strain is not particularly sensitive to BrdU at 0.1 µM, although at 1 µM there is a slight difference in growth compared to the rad3+ strain and higher concentrations are similarly toxic to both rad3Δ and rad3+ incorporating strains (Figure 2A and B). Sivakumar et al. (5) have noted that high concentrations of BrdU are toxic without causing cell elongation, which they speculate is due to disturbance of major groove–protein interactions. High concentrations of thymidine are also toxic to incorporating strains, presumably due to disturbance of cellular nucleotide pools (5).
Figure 2.
Effects of EdU incorporation on viability and cell cycle progression. (A) Serial dilutions (10-fold) of wild-type (P2), tk (adh1:tk, P2471), tk hENT (adh1:tk adh1:hENT1,P2470) and tk hENT rad3Δ (adh1:tk adh1:hENT1 rad3Δ, P2472) cells were spotted on to YE3S plates containing EdU at the indicated concentrations, (B) As (A) but cells were spotted onto YE3S plates containing BrdU at the indicated concentrations, (C) Cell elongation following growth in EdU. Lower panels show tk hENT (adh1:tk adh1:hENT1 (P2470)) cells grown in 1 μM EdU (YE3S medium) for 5 h and imaged following DAPI staining and EdU detection; upper panels show control cells from a culture lacking EdU. Bar = 10 µm, (D) Effect of EdU on cell division. tk hENT [adh1:tk adh1:hENT1 (P2470)] cells were arrested in G1 by growing in EMM-N for 16 h at 26°C, then released from the cell cycle block in EMM+N medium at 32°C in the presence (1 μM) or absence of EdU and cell concentrations were monitored. The effect of EdU on cell division of rad3Δ cells is shown in Supplementary Figure S2. (E and F) As (D) except that rad3+ [adh1:tk adh1:hENT1 (P2470)] and rad3Δ [adh1:tk adh1:hENT1 rad3Δ (P2472)] strains were released from a G1 block and the percentage of binucleate cells (E) and cell viabilities (F) were determined.
Consistent with these observations, adh1-TK adh1-hENT1 rad3+ cells became elongated when grown in 1 µM EdU (Figure 2C and Supplementary Figure S1). Cells released from a G1 block into medium containing EdU failed to carry out mitosis and cell division (Figure 2D and E) but the block to mitotic entry was relieved in a rad3Δ mutant and most cells arrested in a binucleate, septated state (Figure 2E and Supplementary Figures S1 and S2). Cells also lost viability when grown in EdU and this was exacerbated in the rad3Δ strain (Figure 2F). Toxicity effects of EdU on mammalian cells have also been reported (14), suggesting that EdU may not be suitable for continuous labelling studies.
To determine whether incorporation of EdU affects the kinetics of DNA replication, cells were arrested in G1 by nitrogen starvation and released from the block in the presence or absence of the nucleoside (Figure 3A). Cells from both cultures were stained with SYTOX Green without coupling EdU to fluorescent azide and analysed by flow cytometry (Figure 3B and D). Both cultures started S phase at the same time (∼2 h after release) and bulk replication was largely complete at 4 h, indicating that the duration of S phase was similar. For cells grown in EdU, the SYTOX Green histogram peaks showing DNA content for cells 4–5 h after release from the G1 block are shifted slightly to the left of the peaks for the minus EdU culture (Figure 3B and D, Supplementary Figure S3). Cells from the EdU containing culture were also conjugated to fluorescent azide and analysis of these cells by flow cytometry showed commencement of DNA replication at around 2 h in agreement with the SYTOX Green histogram (Figure 3C). On prolonged incubation, the peak of Alexa Fluor 488 fluorescence associated with EdU incorporation does not shift to the right of the peak shown at 5 h (data not shown), indicating that EdU is only incorporated into a single strand of DNA and that cells are arrested in the first cycle after release.
The leftward shift of the SYTOX Green histograms in Figure 3D could, in principle, be due to incomplete DNA replication in the presence of EdU. However, we think this is unlikely as a similar shift was seen when BrdU, rather than EdU, was incorporated (Supplementary Figure S4) and BrdU does not inhibit S phase completion (3,7). To investigate further whether EdU affects the completion of DNA replication, we analysed DNA from cells grown in EdU (10 μM) by PFGE, since incompletely replicated chromosomes fail to enter these gels (15). Cells were released from a G1 block in the presence or absence of EdU and samples were taken up to 5 h for analysis by PFGE and flow cytometry (Figure 3E and F). As a control for incomplete replication, chromosomes were analysed from cells grown in the presence of hydroxyurea (HU) (Figure 3E, lanes 6 and 7). Chromosomes are resolved from cells grown in EdU (Figure 3E, compare lanes 5 and 1) indicating completion of chromosome replication. However chromosome bands are fainter in the +EdU time points compared to the −EdU samples, and there is a smear of smaller DNA fragments. This may reflect the generation of double-strand breaks following EdU incorporation. Taken together, these results suggest that EdU does not inhibit completion of DNA replication. The reduction in SYTOX Green fluorescence seen with DNA containing EdU requires further investigation, but could be due to quenching or reduced binding of the dye.
Using EdU to detect limited DNA synthesis
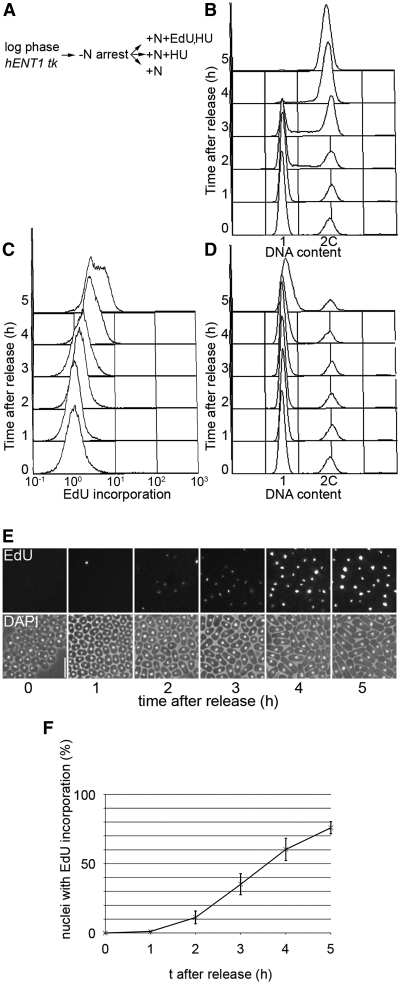
To investigate whether EdU incorporation provides a sensitive method for detecting DNA synthesis where only limited elongation has occurred, G1 arrested cells were released from the block into medium containing both EdU and HU (Figure 4A). Inhibition of ribonucleotide reductase by HU prevents bulk DNA replication although some fork progression from origins takes place [∼ 4–5 kb in Saccharomyces cerevisiae (16)]. In control cells, flow cytometric analysis of SYTOX Green-stained cells showed that S phase occurred around 2–4 h after release (Figure 4B) while in the presence of HU, no DNA replication was detected as expected (Figure 4D, Supplementary Figure S5). Following conjugation to azide, some EdU incorporation could be detected in the +HU+EdU culture by flow cytometry from 2 h (Figure 4C) but the clearest result was obtained by fluorescence microscopy (Figure 4E and F). Here, EdU incorporation could be detected as early as 2 h after release, around the time that S phase was commencing in the culture lacking HU.
Figure 4.
Detection of early S phase using EdU. (A) Scheme of experiment. adh1:tk adh1:hENT1 (P2470) cells were arrested in G1 by growth in EMM-N for 16 h at 26°C; cells were released from the cell cycle block by transferring to: (i) EMM only; (ii) EMM containing 12 mM HU; (iii) EMM containing 12 mM HU and 10 μM EdU (all cultures were incubated at 32°C), (B) Analysis of DNA contents of cells from the −EdU, −HU culture showing onset of S phase at around 2 h, (C) Flow cytometric analysis of EdU incorporation in cells from the +EdU+HU culture following conjugation to Alexa Fluor 488 azide, (D) Analysis of DNA contents of cells from the +EdU, +HU culture confirming early S phase arrest. S phase arrest was also shown by the −EdU, +HU culture (Supplementary Figure S5), (E) Cells from (C) were analysed by fluorescence microscopy. Bar = 10 µm and (F) Quantitative analysis of cells shown in (E).
Taken together, these results indicate that EdU is a useful thymidine analogue for detecting DNA synthesis in experiments involving short labelling periods and a single cell cycle, although evidence for DNA damage induced by EdU in fission yeast is a concern. The sensitivity and ease of detection of EdU incorporation even when the elongation step of DNA synthesis is largely inhibited should be of value for detecting early replicating parts of the genome, and the limited replication associated with DNA repair and recombination.
SUPPLEMENTARY DATA
Supplementary Data are available at NAR Online.
FUNDING
Funding for open access charge: Cancer Research UK.
Conflict of interest statement. None declared.
Supplementary Material
ACKNOWLEDGEMENTS
The authors thank Nick Rhind for provision of TK and hENT1-expressing strains that were used in early stages of this work.
REFERENCES
- 1.Terasawa M, Ogawa H, Tsukamoto Y, Shinohara M, Shirahige K, Kleckner N, Ogawa T. Meiotic recombination-related DNA synthesis and its implications for cross-over and non-cross-over recombinant formation. Proc. Natl Acad. Sci. USA. 2007;104:5965–5970. doi: 10.1073/pnas.0611490104. [DOI] [PMC free article] [PubMed] [Google Scholar]
- 2.Green MD, Sabatinos SA, Forsburg SL. Microscopy techniques to examine DNA replication in fission yeast. Methods Mol. Biol. 2009;521:463–482. doi: 10.1007/978-1-60327-815-7_26. [DOI] [PubMed] [Google Scholar]
- 3.Sabatinos SA, Forsburg SL. Measuring DNA content by flow cytometry in fission yeast. Methods Mol. Biol. 2009;521:449–461. doi: 10.1007/978-1-60327-815-7_25. [DOI] [PubMed] [Google Scholar]
- 4.Hodson JA, Bailis JM, Forsburg SL. Efficient labeling of fission yeast Schizosaccharomyces pombe with thymidine and BUdR. Nucleic Acids Res. 2003;31:e134. doi: 10.1093/nar/gng134. [DOI] [PMC free article] [PubMed] [Google Scholar]
- 5.Sivakumar S, Porter-Goff M, Patel PK, Benoit K, Rhind N. In vivo labeling of fission yeast DNA with thymidine and thymidine analogs. Methods. 2004;33:213–219. doi: 10.1016/j.ymeth.2003.11.016. [DOI] [PMC free article] [PubMed] [Google Scholar]
- 6.Rhind N. Incorporation of thymidine analogs for studying replication kinetics in fission yeast. Methods Mol. Biol. 2009;521:509–515. doi: 10.1007/978-1-60327-815-7_29. [DOI] [PMC free article] [PubMed] [Google Scholar]
- 7.Lengronne A, Pasero P, Bensimon A, Schwob E. Monitoring S phase progression globally and locally using BrdU incorporation in TK(+) yeast strains. Nucleic Acids Res. 2001;29:1433–1442. doi: 10.1093/nar/29.7.1433. [DOI] [PMC free article] [PubMed] [Google Scholar]
- 8.Patel PK, Arcangioli B, Baker SP, Bensimon A, Rhind N. DNA Replication Origins Fire Stochastically in Fission Yeast. Mol. Biol. Cell. 2006;17:308–316. doi: 10.1091/mbc.E05-07-0657. [DOI] [PMC free article] [PubMed] [Google Scholar]
- 9.Salic A, Mitchison TJ. A chemical method for fast and sensitive detection of DNA synthesis in vivo. Proc. Natl Acad. Sci. USA. 2008;105:2415–2420. doi: 10.1073/pnas.0712168105. [DOI] [PMC free article] [PubMed] [Google Scholar]
- 10.Moreno S, Klar A, Nurse P. Molecular genetic analysis of the fission yeast Schizosaccharomyces pombe. Meth. Enzymol. 1991;194:795–823. doi: 10.1016/0076-6879(91)94059-l. [DOI] [PubMed] [Google Scholar]
- 11.Kearsey SE, Stevenson AL, Toda T, Wang SW. Fission yeast Cut8 is required for the repair of DNA double-strand breaks, ribosomal DNA maintenance, and cell survival in the absence of Rqh1 helicase. Mol. Cell Biol. 2007;27:1558–1567. doi: 10.1128/MCB.01495-06. [DOI] [PMC free article] [PubMed] [Google Scholar]
- 12.Edelstein A, Amodaj N, Hoover K, Vale R, Stuurman N. Computer control of microscopes using microManager. Curr. Protoc. Mol. Biol. 2010;Chapter 14 doi: 10.1002/0471142727.mb1420s92. Unit 14–20. [DOI] [PMC free article] [PubMed] [Google Scholar]
- 13.Gomez M, Antequera F. Organization of DNA replication origins in the fission yeast genome. EMBO J. 1999;18:5683–5690. doi: 10.1093/emboj/18.20.5683. [DOI] [PMC free article] [PubMed] [Google Scholar]
- 14.Diermeier-Daucher S, Clarke ST, Hill D, Vollmann-Zwerenz A, Bradford JA, Brockhoff G. Cell type specific applicability of 5-ethynyl-2′-deoxyuridine (EdU) for dynamic proliferation assessment in flow cytometry. Cytometry A. 2009;75:535–546. doi: 10.1002/cyto.a.20712. [DOI] [PubMed] [Google Scholar]
- 15.Hennessy KM, Lee A, Chen E, Botstein D. A group of interacting yeast DNA replication genes. Genes Dev. 1991;5:958–969. doi: 10.1101/gad.5.6.958. [DOI] [PubMed] [Google Scholar]
- 16.Santocanale C, Diffley JF. A Mec1- and Rad53-dependent checkpoint controls late-firing origins of DNA replication. Nature. 1998;395:615–618. doi: 10.1038/27001. [DOI] [PubMed] [Google Scholar]
- 17.Mochida S, Yanagida M. Distinct modes of DNA damage response in S. pombe G0 and vegetative cells. Genes Cells. 2006;11:13–27. doi: 10.1111/j.1365-2443.2005.00917.x. [DOI] [PubMed] [Google Scholar]
Associated Data
This section collects any data citations, data availability statements, or supplementary materials included in this article.


