Abstract
N-Acetylaspartylglutamate (NAAG) is found at high concentrations in the vertebrate nervous system. NAAG is an agonist at group II metabotropic glutamate receptors. In addition to its role as a neuropeptide, a number of functions have been proposed for NAAG, including a role as a non-excitotoxic transport form of glutamate and a molecular water pump. We recently identified a NAAG synthetase (now renamed NAAG synthetase I, NAAGS-I), encoded by the ribosomal modification protein rimK-like family member B (Rimklb) gene, as a member of the ATP-grasp protein family. We show here that a structurally related protein, encoded by the ribosomal modification protein rimK-like family member A (Rimkla) gene, is another NAAG synthetase (NAAGS-II), which in addition, synthesizes the N-acetylated tripeptide N-acetylaspartylglutamylglutamate (NAAG2). In contrast, NAAG2 synthetase activity was undetectable in cells expressing NAAGS-I. Furthermore, we demonstrate by mass spectrometry the presence of NAAG2 in murine brain tissue and sciatic nerves. The highest concentrations of both, NAAG2 and NAAG, were found in sciatic nerves, spinal cord, and the brain stem, in accordance with the expression level of NAAGS-II. To our knowledge the presence of NAAG2 in the vertebrate nervous system has not been described before. The physiological role of NAAG2, e.g. whether it acts as a neurotransmitter, remains to be determined.
Keywords: Glutamate, Neurochemistry, Neuropeptide, Peptide Biosynthesis, Peptides, N-Acetylaspartate, N-Acetylaspartylglutamate
Introduction
N-Acetylaspartylglutamate (NAAG)3 is an abundant peptide in the vertebrate nervous system, found at high micromolar to low millimolar concentrations (1–3). A number of studies demonstrated that NAAG acts as a specific agonist at the group II metabotropic mGluR3 glutamate receptors (4–6). Agonistic and antagonistic effects of NAAG at N-methyl-d-asparatate receptors have been described (5, 7, 8), but could not be confirmed in later studies (9). Several reports indicate a neuroprotective role of NAAG (10–12), and in line with this, inhibitors of the NAAG hydrolyzing glutamate carboxypeptidase (GCP)-II have a significant neuroprotective effect in different model systems (13). Increasing NAAG concentrations by GCP-II inhibition appear to reduce glutamate release through activation of presynaptic mGluR3 receptors (for review, see Ref. 13).
NAAG may also be involved in neuron-glia signaling (14), although its specific role is not fully understood. Theoretically, synthesis of NAAG could also be an efficient way to transfer large amounts of glutamate from neurons to the extracellular fluid, avoiding the excitotoxic effect of free glutamate (15). A possible role of NAAG as a molecular water pump has also been suggested (16).
NAAG is synthesized independently of ribosome from N-acetylaspartate (NAA) and glutamate by NAAG synthetases. Although neurons are the major source of NAAG, it is also present in cultured oligodendrocytes and activated microglia (17). In the mammalian nervous system, the highest NAAG levels have been found in the brain stem, spinal cord, and peripheral nerves (1, 18–21). NAAG is released from synaptic terminals in a depolarization- and calcium-dependent manner, indicating its presence in synaptic vesicles (2). Extracellularly, NAAG is hydrolyzed by GCP-II or GCP-III to release NAA and glutamate (13). Glutamate is taken up by neurons or astrocytes, whereas the deliberated NAA is mainly taken up by oligodendrocytes, where NAA is hydrolyzed by aspartoacylase (23). The released acetyl groups may be used for lipid synthesis during myelin formation (23–25). NAAG may also be taken up by glial cells (26), e.g. via the proton-dependent high affinity oligopeptide transporter 2 (PEPT2) (27). The metabolic fate of NAAG taken up by glial cells, however, is not clear.
We and others recently reported that a member of the ATP-grasp protein family, encoded by the ribosomal modification protein rimK-like family member B (Rimklb) gene is a NAAG synthetase (28, 29). We also identified a homologous gene, ribosomal modification protein rimK-like family member A (Rimkla), potentially encoding a protein with significant sequence similarity to the NAAG synthetase. Collard et al. (29) showed that Rimkla indeed encodes a NAAG synthetase. We show here, however, that this enzyme (NAAG synthetase II, NAAGS-II) not only synthesizes NAAG, but is capable of condensing a second glutamate residue to its first reaction product, thereby generating the tripeptide N-acetylaspartylglutamylglutamate (NAAG2). Mass spectrometry confirmed the presence of NAAG2 in the murine nervous system, where NAAG2 concentration correlates with the Rimkla/NAAGS-II expression level. To our knowledge, NAAG2 has not been described previously. Its physiological role remains to be determined.
EXPERIMENTAL PROCEDURES
Synthesis of 14C-Labeled NAA
14C-Labeled NAA was synthesized using [14C]aspartate (GE Healthcare) and acetic acid anhydride (Merck, Darmstadt, Germany) as described by Gehl et al. (30), with minor modifications. Briefly, 11.7 nmol of acetic acid anhydride was mixed with 2.7 nmol of [14C]aspartate in a total volume of 500 μl and the reaction mixture was shaken vigorously for 30 min. The synthesized NAA was purified from residual cations by cation exchange chromatography using AG-50W-X8 cation exchange columns (Bio-Rad).
Plasmids
The murine NAAGS-II coding sequence was amplified from the IRAKp961P08126Q2 cDNA clone (RZPD, Berlin, Germany) with Taq DNA polymerase and oligonucleotides 5′-GCGGATCCTGCGCGCAGGTCTGGCTGCTGACC-3′ and 5′-GCGCCTGCAGTTAATGCTGTAACCAGGCTTGGGC-3′. The PCR product was treated with Klenow enzyme, digested with BamHI, and ligated into BamHI- and SmaI-digested pQE80L vector (Qiagen, Hilden, Germany), generating the pQE-NAAGS-II plasmid. NAAGS-II was further subcloned into the eukaryotic expression vector pFLAG (28) by ligating the NAAGS-II containing BamHI-NheI fragment of pQE-NAAGS-II into the BamHI- and XbaI-digested pFLAG, generating pFLAG-NAAGS-II. Expression plasmids encoding NaDC3, NAAGS-I, and Nat8l were generated as described previously (28). Murine PEPT2 was amplified in two fragments from brain cDNA with Phusion Polymerase (New England Biolabs, Frankfurt, Germany) and oligonucleotides 5′-CAGCGAGCAGCCCCTCTCTT-3′ and 5′-CGGTCTTCTACCTCTCCATCAATGC-3′ for the 5′ part and 5′-GCGCTGCAACTGCAAATGCCA-3′ and 5′-GCCAGGGGTCAGTCTCCATCCA-3′ for the 3′ part of the cDNA. Both fragments were combined in a fusion PCR (using oligonucleotides 5′-CAGCGAGCAGCCCCTCTCTT-3′ and 5′-GCCAGGGGTCAGTCTCCATCCA-3′), and ligated into SmaI-digested pBlueScript vector. To generate an expression plasmid encoding EGFP-tagged PEPT2, the open reading frame of PEPT2 was amplified with Phusion polymerase and oligonucleotides 5′-GCTCCGGACTTGAGGAGAGAGAGAGTAAGGAGC-3′ and 5′-CGCTCGAGCCAGGGGTCAGTCTCCATCCA-3′. The PCR product was digested with AccIII and XhoI and ligated into AccIII- and XhoI-digested pEGFP-C1 vector (Clontech). All DNA constructs were confirmed by DNA sequencing. As an irrelevant control plasmid, pFLAG-MacGAP (28) was transfected, or where indicated, pEGFP-C1 (Clontech), encoding enhanced green fluorescence protein (EGFP).
Western Blotting
SDS-PAGE and Western blot analysis was done as described (31). Briefly, cells were lysed in 20 mm Tris-HCl (pH 8.0), 150 mm NaCl, 1% Nonidet P-40, 2 mm EDTA, 1 mm PMSF, and centrifuged at 15,000 × g for 20 min and the supernatant was separated in 10% polyacrylamide gels. Proteins were transferred to nitrocellulose membranes by semi-dry blotting. Nonspecific binding sites were blocked with 3% milk powder in 20 mm Tris-HCl, 150 mm NaCl, 0.3% Tween 20 (TBS-T) and blots were stained with antibodies against the FLAG epitope (clone M2; Sigma) and peroxidase-conjugated goat anti-mouse antibodies (Dianova, Hamburg, Germany).
Cell Culture and Transfection
CHO-K1 and HEK-293T cells were grown in DMEM/Nut Mix F-12 (1:1) supplemented with 10% FCS, 2 mm l-glutamine, penicillin, and streptomycin. Transient transfections of CHO-K1 cells were done using ExGen500 (Fermentas), according to the manufacturer's instructions. HEK-293T cells were transfected using the calcium phosphate method (32).
Metabolic Labeling
Transiently transfected cells were metabolically labeled after transfection by adding [14C]glutamate (0.5 μCi/35-mm dish), [14C]protein hydrolysate (both from GE Healthcare) (2 μCi/35-mm dish), or [14C]NAA (0.25 μCi/35-mm dish) for 16 h. In some experiments, 10 mm NAA was added to the culture medium 1 h before metabolic labeling. After washing 3 times with PBS, cells were scraped in 1 ml of ice-cold 90% methanol and centrifuged for 5 min at 10,000 × g. The supernatant was dried in a SpeedVac concentrator, dissolved in water, and adjusted to pH 5–6 using sodium hydroxide. To remove cations from the peptide extract, the solution was passed through a cation exchange AG-50W-X8 resin column (Bio-Rad), and the eluate was dried in a SpeedVac concentrator. Dried extracts were dissolved in 20 μl of 20% ethanol and applied loaded onto Silica Gel 60 HPTLC plates (Merck, Darmstadt, Germany). In some experiments, 5 mm NAA, NAAG, or NAAG2 were added as internal standards. HPTLC plates were developed in one of the following solvent systems: (a) butanol/acetic acid/water (12:3:5) or (b) chloroform/methanol/acetic acid (9:1:5). Radioactive signals were visualized using Bioimager screens (Fujifilm, Düsseldorf, Germany). The unlabeled peptide standards (NAAG and NAAG2) were detected by UV scanning at 215 or 200 nm. The NAAG2 peptide was obtained from PANATecs GmbH (Tübingen, Germany).
GCP-II Assay
Recombinant hexahistidine-tagged GCP-II was obtained from R&D Systems (Minneapolis, MN). [14C]NAAG and [14C]NAAG2 were isolated from NAAGS-II and NaDC3 coexpressing HEK-293T cells, metabolically labeled with [14C]NAA. The GCP-II activity assay was done using 50 μl of GCP-II solution (containing 0.75 μg of the enzyme in 50 mm Hepes, 100 mm NaCl, pH 7.4) and different concentrations of 14C-labeled NAAG and NAAG2 (0.2–20 μm; with a constant amount of radiolabeled substrate (15,000 cpm of [14C]NAAG2; 30,000 cpm of [14C]NAAG)) of radioactive substrates. Reaction mixtures were incubated at 37 °C. To stop the reaction, aliquots (10 μl) of the assay mixture were heated for 5 min after 0, 20, 120, and 240 min. Samples (5 μl) were applied onto Silica Gel 60 HPTLC plates (Merck, Darmstadt Germany). Chromatograms were developed in n-butanol/acetic acid/water (8:2:2) followed by chloroform/methanol/acetic acid (9:1:5). The amounts of radiolabeled NAAG and NAAG2 remaining after hydrolysis were visualized using Bioimager screens (Fujifilm) and the signals were quantified with AIDA software (raytest Isotopenmessgeräte GmbH, Straubenhardt, Germany).
Peptide Transport Assay
Peptide transport activity of PEPT2 and NaDC3 was determined using HEK-293T cells transiently transfected with pEGFP-PEPT2 or pcDNA-NaDC3 (28) in 6-well plates. Control cells were transfected with pEGFP-C1 plasmid. Twenty hours after transfection, cells were incubated with different concentrations of 14C-labeled NAAG2, NAAG, or NAA (15,000 cpm/well) in MES buffer (25 mm MES/Tris, pH 6.0, 140 mm NaCl, 5.4 mm KCl, 1.8 mm CaCl2, 0.8 mm MgSO4, 5 mm glucose) or Locke's buffer (154 mm NaCl, 5.6 mm KCl, 3.6 mm NaHCO3, 1.3 mm CaCl2, 1 mm MgCl2, 5 mm glucose, 10 mm Hepes, pH 7.4) for 30 min at 37 °C. In some experiments, uptake of 14C-labeled substrates was measured in the presence of 5 mm unlabeled NAAG2 or NAAG. After washing 3 times with ice-cold PBS, cells were lysed in 1% SDS, and radioactivity was determined by liquid scintillation counting. Bound radioactivity in cells transfected with the pEGFP-C1 control plasmid was subtracted. Three independent experiments, each performed in duplicates, were done.
Digestion of Peptides with Carboxypeptidase Y
Five μl of dissolved peptides were incubated with 0.1 or 1 unit of carboxypeptidase Y (CPY) (Roche Applied Science) in 50 mm citrate buffer (pH 6.0) for 2 h at 37 °C. Samples were applied onto Silica Gel 60 HPTLC plates (Merck). Chromatograms were developed in one of the following solvents: n-butanol/acetic acid/water (8:2:2; v/v/v) or chloroform/methanol/acetic acid (9:1:5; v/v/v). Radioactive signals were visualized using Bioimager screens.
Acid Hydrolysis of Peptides
Aquaeous solutions of TLC-purified NAAG and NAAG2 from metabolically labeled cells were incubated with 4 volumes of 6 m HCl for 2 h at 110 °C. The samples were dried under vacuum and dissolved in 10 μl of 20% ethanol. The hydrolyzed samples and 14C-labeled glutamate and aspartate standards were applied onto Silica Gel 60 HPTLC plates and the chromatograms were developed in n-butanol/acetic acid/water (8:2:2; v/v/v). Radioactive signals were visualized using Bioimager screens and quantified using AIDA software.
HPLC and ESI-MS Analysis
For HPLC/ESI-MS analysis and quantification of NAAG and NAAG2, HEK-293T cells were harvested 48 h after transfection. Cells were washed three times with PBS. Cell pellets from two 35-mm dishes were combined and resuspended in 300 μl of ice-cold 90% methanol and sonicated. Protein precipitates were sedimented by centrifugation at 20,800 × g for 15 min at 4 °C. The protein pellet was used to measure the protein concentration using the bicinchoninic acid assay (Bio-Rad). The peptide extract was dried under vacuum and dissolved in 100 μl of distilled water. The solution was centrifuged at 20,800 × g (20 min) and the supernatant was subjected directly to HPLC analysis.
For quantification of NAAG and NAAG2 in mouse tissues, 2–3-month-old female C57BL/6 wild-type mice were used. Frozen tissues were homogenized in 500 μl of ice-cold 90% methanol with an ultraturrax tissue homogenizer (IKA-Werke, Staufen, Germany). Protein precipitates were sedimented by centrifugation for 20 min at 20,800 × g and 4 °C. The peptide extract was dried under vacuum and dissolved in 200 μl of distilled water. To sediment the unsoluble material, the solution was centrifuged for 20 min at 20,800 × g (at room temperature). The supernatant was subjected directly to HPLC analysis.
Samples were analyzed by a tandem LC/MS spectroscopy method. For HPLC (HPLC 1200 series, Agilent Technologies, Santa Clara, CA) a column (organic acid resin 250 × 4-mm sphere image; CS-chromatographie service GmbH, Langerwehe, Germany) with organic acid resin, PS-DVB with sulfonic acid changer, was used. The mobile phase consisted of 0.05% formic acid, and absorbance was detected at 214 nm. For equilibration, the column was washed with the mobile phase for 1 h at a flow rate of 1 ml/min. The flow rate for all analysis was 0.5 ml/min. The acquired data were analyzed by integration of the NAAG peak areas in HPLC. The NAAG detection limit was 6 nmol/g of protein for HEK-293T cells and 9.4 nmol/g of tissue (wet weight) for mouse tissues.
ESI/MS spectra (ESI-MS HCTultra, Bruker Daltonics, Bremen, Germany) were recorded in negative ion mode with Auto/MS fragmentation. Eluate fractions from the HPLC were directly injected. Nitrogen was used as drying gas at 350 °C. The collision gas was a mixture of helium with 3% argon. The capillary voltage was set to 4,000 V. Data of NAAG2 were analyzed by the intensities of the NAAG2 signals in the ESI main spectra compared with external standards measurement. The NAAG2 detection limit was 0.5 nmol/g of protein for HEK-293T cells and 0.8 nmol/g of tissue (wet weight) for mouse tissues.
Northern Blotting
Total RNA was isolated from different tissues of 10-week-old male C57BL/6 mice and E12.5 embryos using TRIzol (Invitrogen), as described (33). RNAs (20 μg/lane) were separated by agarose gel electrophoresis in the presence of 1 m formaldehyde and transferred onto Hybond N+ nylon membranes (Amersham Biosciences) using standard methods (34). Membranes were hybridized to the digoxigenin-labeled antisense NAAGS-II cRNA probe, followed by chemiluminescence detection, as described (33).
Quantitative Real Time RT-PCR
Total RNA from different mouse tissues (10-week-old C57BL/6 mice) was prepared as described above. cDNA was synthesized using SuperScript II reverse transcriptase (Invitrogen) and oligo(dT) primers, according to the manufacturer's instruction. Quantitative real time PCR was done using SYBR Green (Sigma) and the following primers, as described previously (33): ubiquitin C, 5′-AGGCAAGACCATCACCTTGGACG-3′ and 5′-CCATCACACCCAAGAACAAGCACA-3′; NAAGS-II, 5′-CCTATGGTGGGCACGAAGAC-3′ and 5′-CACATCATGGCGGACTAGGT-3′; and Nat8l (primer pair 1, 5′-TGTGCGCTGCACACGGACAT-3′ and 5′-TTGCCGTCCAGCACAGCCAC-3′, which anneal in exon 2 and exon 3, respectively; primer pair 2, 5′-GGGGGTGGGGGTGTCCTGAG-3′ and 5′-TTGGGCCCCCAGCCTGTCTT-3′; both oligonucleotides anneal in exon 3). Ct values were normalized to ubiquitin C by the 2−ΔCt method.
In Situ Hybridization
The plasmid pFLAG-NAAGS-II was linearized with BamHI or XbaI, and antisense and sense digoxigenin-labeled cRNA probes were synthesized with SP6- and T7-RNA polymerase, respectively, and the digoxigenin/dNTP mixture (Roche Applied Science), according to the manufacturer's instructions. Paraformaldehyde-fixed and paraffin-embedded brain sections (4 μm) from 10-week-old C57BL/6 mice were hybridized to antisense and sense cRNA probes as described (33). Sections were stained using anti-digoxigenin Ig-alkaline phosphatase conjugate and nitro blue tetrazolium chloride and 5-bromo-4-chloro-3-indolyl phosphate as substrate.
RESULTS
Rimkla/NAAGS-II Expressing Cells Synthesize Two Different NAA-containing Peptides
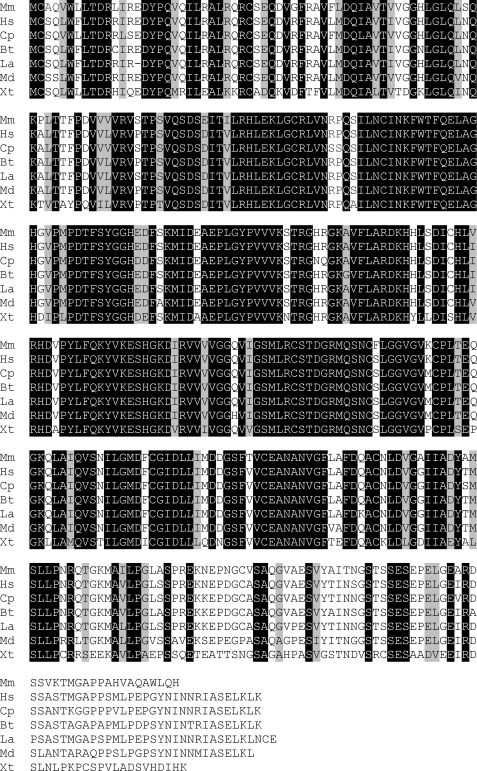
We have recently reported the identification of NAAGS-I, encoded by the Rimklb gene (28). Similar results were reported by Collard et al. (29), who also showed that the homologous gene Rimkla encodes a NAAG synthetase. The Rimkla gene product that we nameed NAAG synthetase II (NAAGS-II) is highly conserved between all mammalian species and is also found in Xenopus tropicalis (Fig. 1). Interestingly, in all other non-mammalian vertebrate genomes available in the databases only the orthologs of the NAAGS-I gene are present.
FIGURE 1.
Sequence comparison of NAAGS-II from different vertebrate species. The amino acid sequences of NAAGS-II from mouse (Mm), human (Hs), guinea pig (Cp), cow (Bt), elephant (La), opossum (Md), and X. tropicalis (Xt) were aligned using CLUSTALW. Residues identical in all sequences are shaded black and residues that are similar in all sequences are shaded gray.
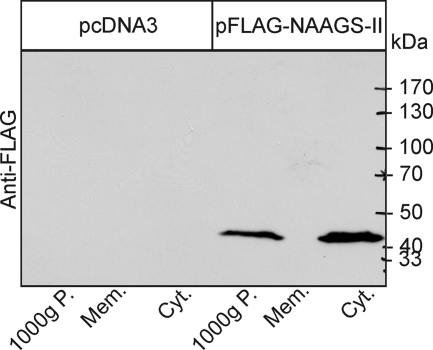
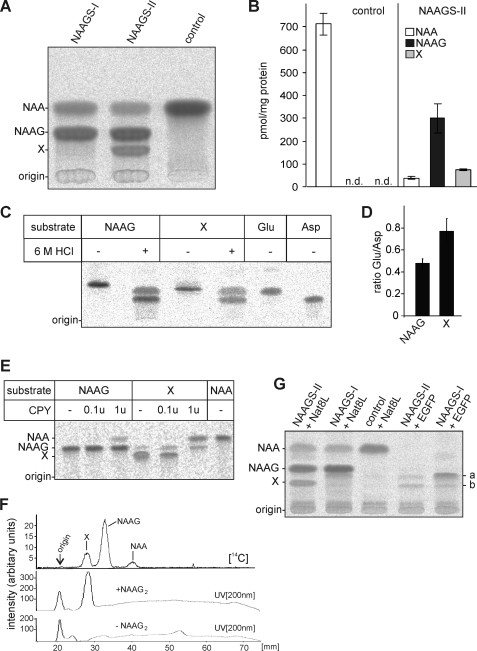
NAAGS-II was expressed as FLAG epitope-tagged protein in HEK-293T (Fig. 2) and CHO-K1 cells (data not shown). Western blot analysis showed expression of a 42-kDa protein (in good agreement with the predicted molecular mass) that was present in the cytosolic but not in the total membrane fraction of transfected cells (Fig. 2). Because hexahistidine-tagged Escherichia coli-expressed NAAGS-II was entirely insoluble in inclusion bodies, we could not detect in vitro NAAGS activity using bacterial expressed protein (data not shown). Therefore, we used transiently transfected cell lines to examine the activity of NAAGS-II. CHO-K1 cells were transiently cotransfected with NAAGS-II or NAAGS-I expression plasmids and the NaDC3 transporter, and metabolically labeled with [14C]NAA. Chromatographic analysis of methanol extracts revealed the presence of a peptide comigrating with the authentic NAAG standard in NAAGS-II and NAAGS-I expressing cells (Fig. 3, A and B). However, whereas NAAG was the only detectable product of NAAGS-I, NAAGS-II expressing cells synthesized an additional product that was not detectable in NAAGS-I expressing or control cells (Fig. 3, A and B). Similar results were obtained when HEK-293T cells were transfected (data not shown).
FIGURE 2.
Western blot analysis. HEK-293T cells were transiently transfected with pFLAG-NAAGS-II or the empty vector pcDNA3. Cells were homogenized and fractionated by differential centrifugation. Equal fractions of the 1,000 × g pellet, 100,000 × g pellet (Mem.), and the 100,000 × g supernatant (Cyt.) were analyzed by Western blotting using anti-FLAG antibody.
FIGURE 3.
Detection of NAAG synthesis by NAAGS-II. A, CHO-K1 cells transiently cotransfected with plasmids encoding the NAA transporter NaDC3 and NAAGS-I, NAAGS-II, or an irrelevant plasmid (control), were metabolically labeled with [14C]NAA for 16 h. Cells were homogenized in 90% methanol and, after cation exchange chromatography, analyzed by HPTLC. Positions of NAA and NAAG standards are indicated. In contrast to NAAGS-I expressing cells, NAAGS-II expression caused synthesis of an unknown product (X) in addition to the main pre-action product NAAG. B, the amount of NAA, and peptides NAAG and X synthesized in CHO-K1 cells expressing NAAGS-II together with NaDC3, and in control cells, metabolically labeled with [14C]NAA for 16 h were quantified using a Bioimager. Data shown are the mean ± S.D. (n = 3) of three experiments. N.D., not determined. C, HEK-293T cells coexpressing NAAGS-II and Nat8l were metabolically labeled with [14C]glutamate and NAAG and the unidentified products (X) were purified from a methanolic peptide extract by preparative TLC. NAAG and X were subjected to acid hydrolysis in 6 m HCl at 110 °C (+) and left untreated (−). Reaction products were separated by TLC together with 14C-labeled glutamate (Glu) and aspartate (Asp) standards. One representative experiment out of 4 independent experiments is shown. D, the ratio of [14C]Glu to [14C]Asp released by acid hydrolysis shown in C, demonstrated a significant higher Glu content in substance X compared with NAAG (mean ± S.D.; n = 4). E, NAAG and X were isolated as described in C, except that cells were labeled with [14C]NAA. Both substances were treated with increasing amounts of CPY and reaction products were separated by TLC. Although NAAG was a poor substrate for CPY, yielding only small amounts of NAA, peptide X was more efficiently digested by CPY, releasing NAA, and NAAG as an intermediate product (note that substance X could not be completely purified from contaminating NAAG by TLC; the NAAG signal, however, increased during incubation with CPY). F, peptide extracts from NaDC3 and NAAGS-II coexpressing CHO-K1 cells metabolically labeled with [14C]NAA (as shown in panel A) were separated by TLC, in the presence (+NAAG2) or absence (−NAAG2) of synthetic NAAG2, and the distribution of radioactivity was determined using a Bioimager. The position of the internal NAAG2 standard was detected by UV scan at 200 nm. 14C-Labeled substance X and synthetic NAAG2 comigrated. G, metabolic labeling of CHO-K1 cells expressing NAAGS-II or NAAGS-I (cotransfected with or without Nat8l expression plasmids or a control plasmid encoding the EGFP). These experiments showed that additional products (a and b) are synthesized by NAAGS-II and NAAGS-I in the presence and absence of NAA. These products were not detectable in cells transfected with a control and Nat8l expression plasmid.
The Second NAAGS-II Reaction Product Is N-Acetylaspartylglutamylglutamate
To identify the second NAAGS-II product (“X” in Fig. 3), cells were metabolically labeled with [14C]NAA or [14C]glutamate (or [14C]protein hydrolysate; data not shown), and the two NAA-derived products (NAAG and X) were purified by preparative thin layer chromatography (TLC). The isolated products were subjected to hydrolysis in 6 m HCl at 110 °C and the reaction products were analyzed by TLC. Two products were generated in both cases, which comigrated with aspartate and glutamate standards (Fig. 3C). Notably, the glutamate band was more intense relative to aspartate in the hydrolysis products of the second peptide (X) when compared with the hydrolysis products of NAAG (Fig. 3D), suggesting that this molecule contains two glutamate residues attached to NAA. To confirm this, both peptides were treated with CPY, releasing the products NAA and glutamate from NAAG and NAA, and NAAG and glutamate from the second peptide (Fig. 3E). These results suggested that the second NAAGS-II product may be the tripeptide NAAG2. This peptide was therefore synthesized and TLC analysis showed that it comigrates with the second NAAGS-II product (Fig. 3F).
Additional products were detected in both, NAAGS-II and NAAGS-I expressing CHO-K1 cells, in the absence of Nat8l or NaDC3, after metabolic labeling with [14C]glutamate (Fig. 3G) or [14C]protein hydrolysate (data not shown). The major product found in NAAGS-I expressing cells, which was only weakly labeled in NAAGS-II expressing cells (a in Fig. 3G) might be β-citryl-glutamate (BCG), which was recently identified as the second major product of NAAGS-I (and minor product of NAAGS-II) (28). The structure of the second product (b in Fig. 3G) is currently unknown. A weak band migrating close to this product was also detectable in cells coexpressing Nat8l and NAAGS-I (Fig. 3G, lane 2). Because this band migrates very close to NAAG2 (Fig. 3G, lane 1), the presence of very low amounts of NAAG2 in NAAGS-I expressing cells could not be excluded from these experiments. Mass spectrometry, however, failed to detect NAAG2 in NAAGS-I and Nat8l coexpressing cells (data not shown).
ESI-MS Detection of NAAG2 in NAAGS-II Expressing Cells
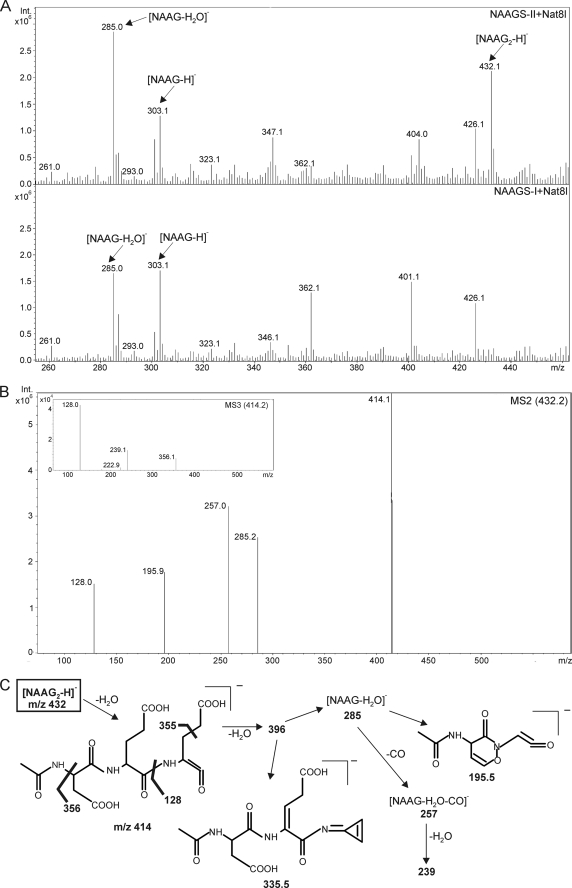
To confirm the identity of the second NAAGS-II reaction product, NAAG2, we subjected peptide extracts from NAAGS-II- or NAAGS-I-transfected HEK-293T cells, coexpressing Nat8l, to HPLC/MS analysis, as described previously (28). These experiments were also done with CHO-K1 cells, which, however, because of a lower transfection efficiency, resulted in significantly lower signal intensities (data not shown). These experiments confirmed NAAG synthesis by NAAGS-II, as mass peaks at m/z = 303 (Fig. 4A) that by tandem MS generated the expected fragment ions (see supplemental Fig. S1), could be detected. In addition, a mass peak at m/z = 432 ([M-H]−, mass of NAAG2) was present in cells expressing NAAGS-II together with Nat8l (Fig. 4A) or NaDC3 (in the latter, 10 mm NAA was added to the culture medium) (supplemental Fig. S4), but not in cells expressing NAAGS-II in the absence of NAA synthesis or uptake (data not shown). Moreover, the m/z = 432 mass peak was undetectable in cells coexpressing NAAGS-I together with Nat8l (Fig. 4A). Fragmentation of the m/z = 432 mass peak generated fragment ions (Fig. 4B) that were in line with the NAAG2 structure (Fig. 4C) and comparable with the fragmentation pattern of synthetic NAAG2 (see supplemental Fig. S2). Thus, NAAGS-II is a peptide synthetase capable of adding one or two glutamate residues to NAA. We did not find evidence for longer oligoglutamylated peptides in NAAGS-II expressing cells.
FIGURE 4.
ESI-MS detection of NAAG and NAAG2 in transfected cells. A, representative ESI-MS spectrum (negative ion mode) of peptide extracts from HEK-293T cotransfected with NAAGS-II and Nat8l (top) or NAAGS-I and Nat8l (bottom). B, fragmentation of the m/z = 432.1 mass peak obtained from peptide extracts of HEK-293T cells coexpressing NAAGS-II and Nat8l. The fragmentation pattern was in line with the NAAG2 structure, as shown in C, and comparable with the fragmentation pattern of synthetic NAAG2 (see supplemental Fig. S2).
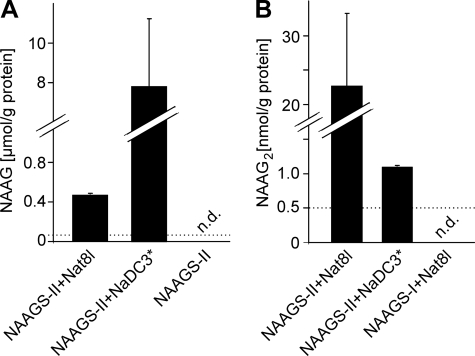
The concentration of NAAG and NAAG2 in HEK-293T cells expressing either NAAGS-II alone or in combination with Nat8l or NaDC3 was determined by HPLC (NAAG) and ESI-MS (NAAG2; using synthetic NAAG2 as external standard), respectively (Fig. 5, A and B). When cells coexpressing the NaDC3 transporter were treated with 10 mm NAA, intracellular NAA concentrations were much higher compared with cells coexpressing NAAGS-II and Nat8l (data not shown; see Ref. 28). The higher intracellular NAA concentration strongly inhibited NAAG2 synthesis, suggesting substrate competition (Fig. 5B).
FIGURE 5.
Quantification of NAAG and NAAG2 synthesis in HEK-293T cells. HEK-293 cells were transfected with plasmids encoding NAAGS-II and Nat8l or NaDC3 (in NaDC3 expressing cells, 10 mm NAA was added to the culture medium). Methanol extracts were prepared and subjected to HPLC/ESI-MS analysis. A, NAAG was quantified by HPLC (detection at 214 nm). The detection limit for NAAG was 0.006 μmol/g of protein. B, NAAG2 was quantified by ESI-MS (mass peak of m/z = 432.1; see Fig. 4) using synthetic NAAG2 as external standard. The detection limit for NAAG2 was 0.5 nmol/g of protein. Data shown are the mean ± S.D. (n = 3) of three independent experiments. N.D., not determined.
The Tripeptide NAAG2 Is Present in the Mammalian CNS and PNS
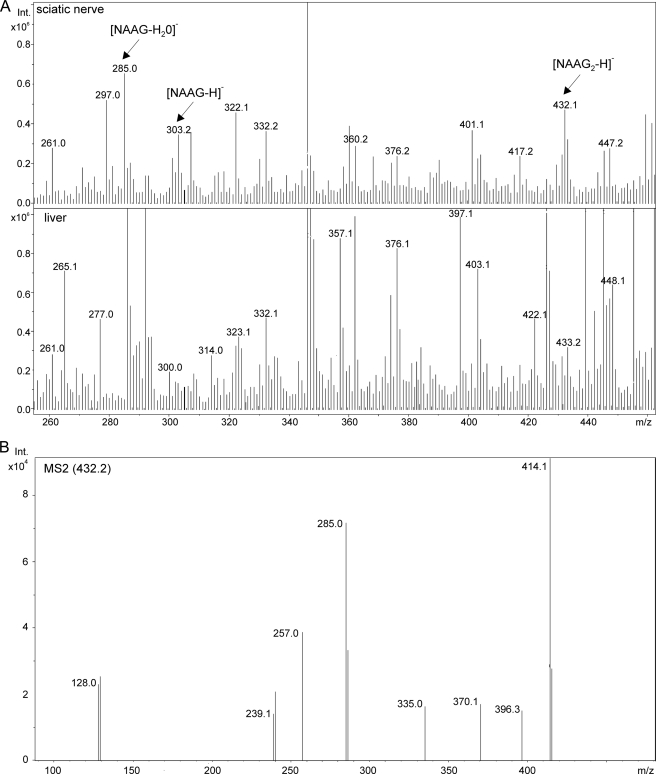
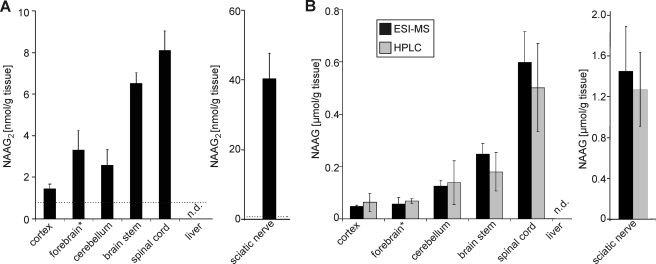
To our knowledge, NAAG2 has not been described in any biological material. Methanol extracts of mouse tissues (different brain regions, sciatic nerves, and liver) were therefore examined by ESI-MS. NAAG levels were determined by HPLC and ESI-MS, and the identity of NAAG was confirmed by tandem MS (MS2), as described (28). Because of the low NAAG2 concentration in tissue samples and the inefficient chromatographic separation of NAAG and NAAG2, quantification of NAAG2 by HPLC was not possible (data not shown). Mass peaks at m/z = 432 were observed in brain tissues and sciatic nerves, but not in liver (Fig. 6A). Tandem MS fragmentation (Fig. 6B) gave very similar fragmentation patterns as found for the NAAGS-II reaction product from transfected cells (Fig. 4) or synthetic NAAG2 standard (supplemental Fig. S2). We used synthetic NAAG2 as an external standard to estimate the concentration of NAAG2 in nervous system tissues (see supplemental Fig. S3 for an example of a NAAG2 standard curve). The highest NAAG2 concentrations were found in sciatic nerves (40 nmol/g of tissue, wet weight) and the spinal cord (about 8 nmol/g), whereas in the cortex, NAAG2 concentrations (<2 nmol/g) were close to the detection limit (Fig. 7A). A similar rostral-caudal increase was evident for NAAG (Fig. 7B), in line with previous studies (6), although NAAG concentrations were usually 30–50-fold higher, compared with NAAG2 (Fig. 7B). Comparable NAAG concentrations were measured using both methods, HPLC and ESI-MS, thus the latter is a reliable method for quantification in tissue extracts. In agreement with data from Koller et al. (18), neither NAAG nor NAAG2 were detectable in the liver, which is in line with the absence of NAAGS-II and Nat8l expression in this tissue (see below).
FIGURE 6.
ESI-MS detection of NAAG and NAAG2 in sciatic nerves. A, ESI-MS spectrum of peptide extracts of sciatic nerves and liver from wild-type mice. Mass peaks of m/z = 302.2 and 432.1, corresponding to NAAG and NAAG2, respectively, were detectable in sciatic nerves but not in the liver. B, the fragmentation pattern of the m/z = 432.1 mass peak obtained from sciatic nerve peptide extracts was in line with the NAAG2 structure (see fragmentation scheme in Fig. 4C), and comparable with the fragmentation pattern of synthetic NAAG2 (see supplemental Fig. S2).
FIGURE 7.
Quantification of NAAG and NAAG2 in mouse tissues. Methanol extracts were prepared form the indicated brain regions/tissues. Note that the forebrain samples lacked part of the cortex of one hemisphere, as cortex samples were analyzed separately. NAAG2 (A) and NAAG (B) concentrations were determined by ESI-MS (black bars) (see Fig. 6). In addition, NAAG concentrations were determined by HPLC in the same extracts (gray bars). Both methods gave similar results. Neither NAAG nor NAAG2 were detectable in liver. The detection limit (indicated by a dotted line) for NAAG2 was 0.8 nmol/g of tissue (wet weight). The detection limit for NAAG was 9.4 (HPLC method) and 0.9 (ESI-MS method) nmol/g of tissue (wet weight). Shown are the mean ± S.D. (n = 4) of four independent experiments. N.D., not determined.
Expression of NAAGS-II in the Murine Nervous System
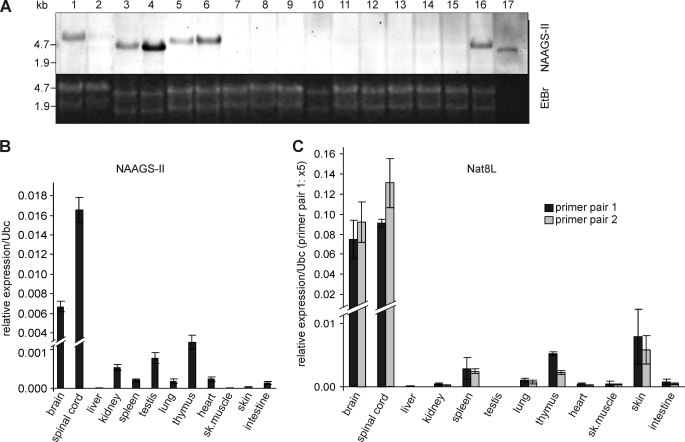
Northern blot analysis revealed strong expression of NAAGS-II in the murine nervous system with the highest expression levels in the brain stem and spinal cord (Fig. 8A). As very weak signals were apparent in Northern blot analysis (they are, however, not visible in the scanned film shown here), we used quantitative real time RT-PCR to examine expression levels of NAAGS-II in other tissues (Fig. 8B). In addition, we examined expression of the NAA synthase Nat8l (Fig. 8C). These experiments confirmed the Northern blot data and also showed high expression of Nat8l in the murine nervous system, but only low expression in other tissues. Nat8l was absent in liver and testis. Thus, the absence of NAA with the simultaneous presence of the strong NAAGS-I expression in testis (28) is explained by the absence of NAA synthesis. However, low amounts of both, Nat8l and NAAGS-II and NAAGS-I (28), suggests NAA and NAAG synthesis also in different non-neuronal tissues. For example, relatively high expression levels of Nat8l, NAAGS-II, and NAAGS-I (28) were found in thymus, suggesting that this organ may also synthesize significant amounts of NAA, NAAG, and possibly NAAG2. To our knowledge, however, the presence of NAAG has not been examined in this tissue.
FIGURE 8.
Expression of NAAGS-II in different mouse tissues. A, Northern blot analysis of NAAGS-II in different tissues of 10-week-old C57BL/6 mice using digoxigenin-labeled antisense cRNA probe, followed by chemiluminescence detection. RNA (20 μg/lane, except spinal cord, where only 5 μg was loaded) of the following tissues was analyzed: head of an embryo at E12.5 (1), body of embryo E12.5 without head (2), cerebellum (3), brain stem (4), forebrain (5), total brain (6), liver (7), spleen (8), kidney (9), adrenal gland (10), testis (11), lung (12), thymus (13), heart (14), skeletal muscle (15), eyes (16), and spinal cord (17). B, quantitative RT-PCR of NAAGS-II expression in various tissues of 10-week-old mice. Shown are the relative expressions after normalization to ubiquitin C (Ubc) as housekeeping control. C, quantitative RT-PCR of Nat8l expression in various tissues of 10-week-old mice. Two different primer pairs were used (see “Experimental Procedures”). Real time PCR data shown are the mean ± S.D. (n = 3) of three independent experiments (using RNA preparations from three different mice).
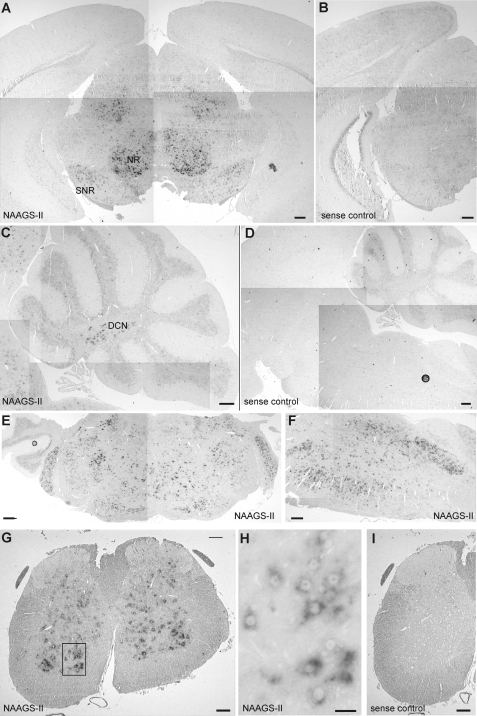
In contrast to NAAGS-I, which was found to be expressed in most brain regions (28), distribution of NAAGS-II expression was more restricted in the CNS (Fig. 9). In situ hybridization of brain paraffin-embedded sections with digoxigenin-labeled NAAGS-II antisense cRNA probes showed high expression levels of NAAGS-II in the spinal cord, brain stem, deep nuclei of the cerebellum, and different nuclei in the medulla, pons, and midbrain. NAAGS-II expression, however, was almost undetectable in the neocortex (Fig. 9A), which is in line with its low NAAG2 content (see Fig. 7A). In the cerebellum, strong NAAGS-II expression was restricted to deep cerebellar nuclei (Fig. 9C), in contrast to NAAGS-I, which was found highly expressed in the Purkinje cell layer (28). Strong NAAGS-II expression was also found in the brain stem, and midbrain, i.e. in the nucleus ruber and substantia nigra (Fig. 9, E and F). This expression pattern is in accordance with the immunohistochemical distribution of NAAG in these areas using NAAG-specific antibodies (21).
FIGURE 9.
In situ hybridization of mouse brain sections. Paraffin-embedded sections of 10-week-old brains and spinal cord were hybridized to digoxigenin-labeled cRNA NAAGS-II antisense (NAAGS-II) or sense probes (sense control), as indicated. A and B, NAAGS-II expression was low in neocortex (Cx) and hippocampus (Hc), but prominent in different nuclei of the midbrain, e.g. red nucleus (NR) and substantia nigra (SNR). C and D, NAAGS-II expression was present in the deep nuclei of the cerebellum (DCN) but was hardly detectable in the cerebellar cortex. E and F, various nuclei in the pons and medulla showed high level expression of NAAGS-II. G–I, in the spinal cord, NAAGS-II expression was found in laminae III to X, with an apparently higher expression level in the ventral laminae. Only low to undetectable expression was observed in laminae I and II. H, a higher magnification of the ventral horn (boxed area in G) showed strong hybridization signals in large diameter cells, suggesting NAAGS-II expression in motor neurons. Scale bars, 200 (A–F), 100 (G and I), and 25 μm (H).
In the spinal cord, NAAGS-II expression was found in the ventral and dorsal horns of gray matter in laminae III to X, but NAAGS-II was low or absent in laminae I and II (Fig. 9G). This distribution is in accordance with the distribution of NAAG in the spinal cord (1, 8). NAAGS-II expression appeared to be higher in the ventral part of the spinal cord, which is in accordance with the higher NAAG concentration in ventral compared with dorsal spinal cord (19). NAAGS-II expression was mainly found in large diameter cells, suggesting its presence in motor neurons (Fig. 9H). Taken together, the NAAGS-II expression level in different brain regions and peripheral nerves are also in accordance with the different concentrations of NAAG2 detected by ESI-MS (see Fig. 7).
NAAG2 Is a Substrate for GCP-II and Is Transported by PEPT2
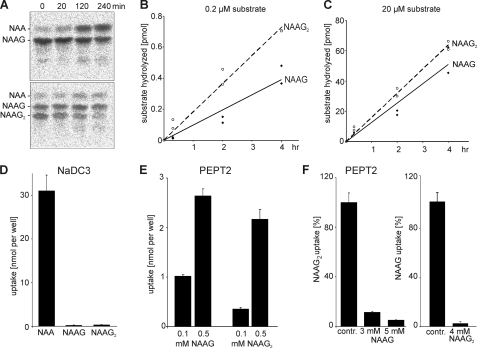
To examine whether NAAG2 is active in the same metabolic system as NAAG, we tested the hypothesis that NAAG2 is a substrate for GCP-II. Using 14C-labeled NAAG and NAAG2, isolated from metabolically labeled HEK-293T cells, hydrolysis of the two substrates by GCP-II was measured. As shown in Fig. 10, A–C, the rate of NAAG2 degradation by GCP-II was comparable with NAAG hydrolysis.
FIGURE 10.
Hydrolysis of NAAG2 by GCP-II and PEPT2-dependent NAAG2 uptake. A, 14C-labeled NAAG and NAAG2 were isolated by preparative TLC from metabolically labeled HEK-293T cells and 0.2 μm 14C-labeled NAAG and NAAG2 were incubated with GCP-II for 0, 20, 120, and 240 min. Reaction products were separated by TLC. Note that [14C]NAAG2 used in these experiments was not completely separated from contaminating NAAG. B and C, quantification of the time dependence of NAAG and NAAG2 hydrolysis at two different concentrations (data from two independent experiments were combined). D, HEK-293T cells were transiently transfected with plasmids encoding NaDC3 and incubated with 0.5 mm 14C-labeled NAA, NAAG, or NAAG2 for 30 min at 37 °C in Locke's buffer (pH 7.4). After washing, radioactivity in cells was determined by liquid scintillation counting. E, HEK-293T cells were transiently transfected with plasmids encoding PEPT2 and incubated with 0.1 or 0.5 mm 14C-labeled NAAG or NAAG2 for 30 min at 37 °C in MES/Tris buffer (pH 6.0). F, NAAG inhibits NAAG2 uptake by PEPT2. PEPT2 expressing cells were incubated with 14C-labeled NAAG2 for 30 min at 37 °C in MES/Tris buffer (pH 6.0) in the absence (contr.) or presence of 3 or 5 mm unlabeled NAAG. Furthermore, NAAG2 inhibits NAAG uptake by PEPT2. PEPT2 expressing cells were incubated with 14C-labeled NAAG for 30 min at 37 °C in MES/Tris buffer (pH 6.0) in the absence (contr.) or presence of 4 mm unlabeled NAAG2. Note that the degree of purity of [14C]NAAG2 used for the NaDC3 and PEPT2 transport assays were much higher than that of [14C]NAAG2 used for the GCP-II assay shown in A. Examples of TLC analyses of peptide extracts from PEPT2 expressing HEK-293T cells after incubation with 14C-labeled NAAG2 are shown under supplemental Fig. S5.
The transport of NAAG2 by the PEPT2 peptide transporter was examined using HEK-293T cells transiently expressing PEPT2. As a control, HEK-293T cells expressing the NaDC3 transporter were used. These cells showed uptake of NAA, but did not transport significant amounts of NAAG2 or NAAG (Fig. 10D), as expected. Cells expressing PEPT2, however, showed an uptake of both, NAAG and NAAG2 (Fig. 10E and supplemental Fig. S5), although NAAG transport was more efficient. Furthermore, uptake of [14C]NAAG2 was efficiently inhibited by NAAG and vice versa (Fig. 10F). Taken together these results provide evidence that NAAG2 and NAAG are metabolized in the same system.
DISCUSSION
Recently, we and others have identified the Rimklb (encoding NAAGS-I) and Rimkla (encoding NAAGS-II) genes as NAAG synthetases (28, 29). Collard et al. (29) showed that both enzymes in addition synthesize BCG, although BCG synthetase activity of NAAGS-II was much lower compared with NAAGS-I. We show here that NAAG and BCG are not the only reaction products of NAAG synthetases. Beside BCG, at least one other product lacking NAA is synthesized by both enzymes in transiently transfected cells, as demonstrated by metabolic labeling of NAAGS-I and NAAGS-II expressing cells. This product could not be identified yet.
Furthermore, NAAGS-II synthesized an additional peptide, using NAA as substrate, which we could identify as NAAG2. This tripeptide was undetectable in HEK-293T or CHO-K1 cells coexpressing NAAGS-I and Nat8l. Using tandem mass spectrometry, we confirmed the presence of this tripeptide in the murine nervous system. The concentration of NAAG2 was 1–2 orders of magnitude below that of NAAG, and can be estimated to be in the lower micromolar range in the CNS (and up to about 40 μm in peripheral nerves). To our knowledge, the presence of NAAG2 has not been described in the vertebrate nervous system before, which might be due to the lower concentration, compared with NAAG and other small peptides. Whether NAAG2 is present in other tissues has not yet been examined.
The condensation of more than one glutamate residue is not a unique feature of NAAGS-II, but has been described for related prokaryotic members of the ATP-grasp protein family. For example, the E. coli RimK protein catalyzes the condensation of up to four glutamate residues to the carboxyl terminus of the ribosomal protein S6 (36).
The physiological role of NAAG2 is unknown at present. Our data suggest that NAAG2 is a metabolite in the same systems as NAAG, as it is transported by the peptide transporter PEPT2, and is also a substrate for GCP-II. Because of the known substrate specificity of GCP-II and the broad substrate specificity of PEPT2, this was not unexpected. However, it remains to be determined whether NAAG2, like NAAG, is present in and released from synaptic vesicles, or acts as an agonist at metabotropic glutamate receptors.
Our experiments using cells coexpressing the NAA transporter NaDC3 and NAAGS-II indicate that in the presence of high concentrations of NAA (as expected for many neurons), the NAAG2 synthesis rate may be several orders of magnitude below the NAAG synthesis rate. Although we did not determine the intracellular NAA concentrations in the transfected cells coexpressing NaDC3, NAA levels in neurons may be comparable or even higher (NAA concentration in the culture medium was 10 mm; 4 mm NAA in total brain suggests even higher intracellular NAA concentrations in neurons synthesizing NAA). Thus, in neurons expressing high levels of Nat8l, very low NAAG2 synthesis rates are expected. In those cells, NAAG2 may not be a physiological important product but may an “unintended” by-product of the NAAGS-II enzyme.
Although the concentration of NAAG2 in different brain regions was in general 30–50-fold lower compared with NAAG, the synthesis rate and local concentrations clearly will depend on various parameters, like expression of NAAGS-II, Nat8l, NAAGS-I, and others. In cells with high NAA synthase activity, NAAG2 synthesis is expected to be low, because of the substrate competition. However, cells expressing high levels of NAAGS-II but only low amounts of NAA synthase Nat8l, or cells that coexpress NAAGS-II and the NAAG transporter PEPT2, may synthesize much larger amounts of NAAG2. Also the re-uptake and turnover of NAAG2 compared with NAAG are not known. Thus, a locally restricted or cell type-specific higher intra- and/or extracellular NAAG2 concentration is possibly.
The expression pattern observed for NAAGS-I and NAAGS-II differ considerably. NAAGS-I expression shows a more widely distribution pattern throughout the brain (28). In contrast, NAAGS-II expression appears to be more restricted. It was almost undetectable in the neocortex and the cerebellar cortex, but reached high expression levels in different nuclei of the midbrain and brain stem, as well as deep cerebellar nuclei and the spinal cord. Thus, NAAGS-II is expressed in those areas with high NAAG concentrations (1, 18, 20, 35). NAAGS-I may be responsible for the overall basal NAAG synthesis, whereas NAAGS-II evolved to ensure high NAAG levels in the caudal brain regions and spinal cord. In addition, the more widespread distribution of NAAGS-I (28) compared with NAAGS-II may reflect its role as a BCG synthetase (29). BCG is an iron chelator and may thus inhibit iron-dependent generation of reactive oxygen species (37). This suggest a more general role of NAAGS-I in protection against oxidative stress, e.g. in hypoxic ischemia. BCG concentrations in the rat brain are highest during embryonic and early postnatal development, thereafter it decreases significantly (38). In contrast, NAA and NAAG exhibit a continuous increase during postnatal development (38). This suggests the highest expression of NAAGS-I during embryonic and early postnatal development, which has, however, not yet been examined. Whether the NAAG increase is due to Nat8l or NAAGS-II up-regulation also remains to be examined. NAAGS-II may have been evolved to ensure sufficient NAAG synthesis in certain brain areas and the spinal cord, without concomitant increase in BCG synthesis, which could potentially affect various metabolic pathways (Krebs cycle, fatty acid synthesis, and others).
Elevated NAAG concentrations have been found in the cerebrospinal fluid of Pelizaeus-Merzbacher disease patients (39, 40), and the Pelizaeus-Merzbacher disease-like disease caused by mutations in the connexin 47 gene (41), sialic acid storage diseases (35), and a leukodystrophy with an unknown genetic cause (22). Slightly elevated NAAG levels in cerebrospinal fluid also occur in Canavan disease (39, 40), which is caused by deficiency in the NAA degrading enzyme aspartoacylase (25). However, a number of unrelated leukodystrophies do not show changes in NAAG concentrations (35, 39). The metabolic changes responsible for these disease-specific elevated NAAG concentrations are currently not known, but mutations in the GCP-II gene appear not to be responsible (22). The possibility of elevated NAAG2 levels in the cerebrospinal fluid of the aforementioned diseases should be examined, as this may also give further insight into the metabolic changes responsible for elevated NAAG levels.
Supplementary Material

The on-line version of this article (available at http://www.jbc.org) contains supplemental Figs. S1–S5.
- NAAG
- N-acetylaspartylglutamate
- BCG
- β-citryl-l-glutamate
- ESI-MS
- electrospray ionization-mass spectrometry
- GCP-II/-III
- glutamate carboxypeptidase-II/III
- NAA
- N-acetylaspartate
- NAAG2
- N-acetylaspartylglutamylglutamate
- NAAGS-I/-II
- NAAG synthetase I/II
- NaDC3
- sodium-dependent dicarboxylate transporter 3
- Nat8l
- N-acetyltransferase 8-like (NAA synthase)
- PEPT2
- proton-dependent high affinity oligopeptide transporter 2
- RimK
- ribosomal protein S6 modification protein
- Rimkla
- ribosomal modification protein rimK-like family member A
- Rimklb
- ribosomal modification protein rimK-like family member B
- EGFP
- enhanced green fluorescent protein
- CPY
- carboxypeptidase Y.
REFERENCES
- 1. Curatolo A., D'Arcangelo P., Lino A., Brancati A. (1965) J. Neurochem. 12, 339–342 [DOI] [PubMed] [Google Scholar]
- 2. Coyle J. T. (1997) Neurobiol. Dis. 4, 231–238 [DOI] [PubMed] [Google Scholar]
- 3. Neale J. H., Bzdega T., Wroblewska B. (2000) J. Neurochem. 75, 443–452 [DOI] [PubMed] [Google Scholar]
- 4. Zaczek R., Koller K., Cotter R., Heller D., Coyle J. T. (1983) Proc. Natl. Acad. Sci. U.S.A. 80, 1116–1119 [DOI] [PMC free article] [PubMed] [Google Scholar]
- 5. Wroblewska B., Wroblewski J. T., Pshenichkin S., Surin A., Sullivan S. E., Neale J. H. (1997) J. Neurochem. 69, 174–181 [DOI] [PubMed] [Google Scholar]
- 6. Bischofberger J., Schild D. (1996) J. Neurophysiol. 76, 2089–2092 [DOI] [PubMed] [Google Scholar]
- 7. Sekiguchi M., Wada K., Wenthold R. J. (1992) FEBS Lett. 311, 285–289 [DOI] [PubMed] [Google Scholar]
- 8. Burlina A. P., Skaper S. D., Mazza M. R., Ferrari V., Leon A., Burlina A. B. (1994) J. Neurochem. 63, 1174–1177 [DOI] [PubMed] [Google Scholar]
- 9. Losi G., Vicini S., Neale J. (2004) Neuropharmacology 46, 490–496 [DOI] [PubMed] [Google Scholar]
- 10. Slusher B. S., Vornov J. J., Thomas A. G., Hurn P. D., Harukuni I., Bhardwaj A., Traystman R. J., Robinson M. B., Britton P., Lu X. C., Tortella F. C., Wozniak K. M., Yudkoff M., Potter B. M., Jackson P. F. (1999) Nat. Med. 5, 1396–1402 [DOI] [PubMed] [Google Scholar]
- 11. Bacich D. J., Wozniak K. M., Lu X. C., O'Keefe D. S., Callizot N., Heston W. D., Slusher B. S. (2005) J. Neurochem. 95, 314–323 [DOI] [PubMed] [Google Scholar]
- 12. Bruno V., Wroblewska B., Wroblewski J. T., Fiore L., Nicoletti F. (1998) Neuroscience 85, 751–757 [DOI] [PubMed] [Google Scholar]
- 13. Neale J. H., Olszewski R. T., Gehl L. M., Wroblewska B., Bzdega T. (2005) Trends Pharmacol. 26, 477–484; discussion 361–3 [DOI] [PubMed] [Google Scholar]
- 14. Baslow M. H. (2000) J. Neurochem. 75, 453–459 [DOI] [PubMed] [Google Scholar]
- 15. Baslow M. H. (2010) Amino Acids 38, 51–55 [DOI] [PubMed] [Google Scholar]
- 16. Baslow M. H. (2010) Amino Acids 39, 1139–1145 [DOI] [PubMed] [Google Scholar]
- 17. Passani L., Elkabes S., Coyle J. T. (1998) Brain Res. 794, 143–145 [DOI] [PubMed] [Google Scholar]
- 18. Koller K. J., Zaczek R., Coyle J. T. (1984) J. Neurochem. 43, 1136–1142 [DOI] [PubMed] [Google Scholar]
- 19. Ory-Lavollée L., Blakely R. D., Coyle J. T. (1987) J. Neurochem. 48, 895–899 [DOI] [PubMed] [Google Scholar]
- 20. Moffett J. R., Palkovits M., Namboodiri A., Neale J. H. (1994) J. Comp. Neurol. 347, 598–618 [DOI] [PubMed] [Google Scholar]
- 21. Moffett J. R., Namboodiri A. M. (2006) Adv. Exp. Med. Biol. 576, 7–26 [DOI] [PubMed] [Google Scholar]
- 22. Wolf N. I., Willemsen M. A., Engelke U. F., van der Knaap M. S., Pouwels P. J., Harting I., Zschocke J., Sistermans E. A., Rating D., Wevers R. A. (2004) Neurology 62, 1503–1508 [DOI] [PubMed] [Google Scholar]
- 23. Moffett J. R., Ross B., Arun P., Madhavarao C. N., Namboodiri A. M. (2007) Prog. Neurobiol. 81, 89–131 [DOI] [PMC free article] [PubMed] [Google Scholar]
- 24. Burri R., Steffen C., Herschkowitz N. (1991) Dev. Neurosci. 13, 403–411 [DOI] [PubMed] [Google Scholar]
- 25. Namboodiri A. M., Peethambaran A., Mathew R., Sambhu P. A., Hershfield J., Moffett J. R., Madhavarao C. N. (2006) Mol. Cell. Endocrinol. 252, 216–223 [DOI] [PubMed] [Google Scholar]
- 26. Cassidy M., Neale J. H. (1993) J. Neurochem. 60, 1631–1638 [DOI] [PubMed] [Google Scholar]
- 27. Ganapathy V., Fujita T. (2006) Adv. Exp. Med. Biol. 576, 67–76 [DOI] [PubMed] [Google Scholar]
- 28. Becker I., Lodder J., Gieselmann V., Eckhardt M. (2010) J. Biol. Chem. 285, 29156–29164 [DOI] [PMC free article] [PubMed] [Google Scholar]
- 29. Collard F., Stroobant V., Lamosa P., Kapanda C. N., Lambert D. M., Muccioli G. G., Poupaert J. H., Opperdoes F., Van Schaftingen E. (2010) J. Biol. Chem. 285, 29826–29833 [DOI] [PMC free article] [PubMed] [Google Scholar]
- 30. Gehl L. M., Saab O. H., Bzdega T., Wroblewska B., Neale J. H. (2004) J. Neurochem. 90, 989–997 [DOI] [PubMed] [Google Scholar]
- 31. Eckhardt M., Barth H., Blöcker D., Aktories K. (2000) J. Biol. Chem. 275, 2328–2334 [DOI] [PubMed] [Google Scholar]
- 32. Chen C., Okayama H. (1987) Mol. Cell. Biol. 7, 2745–2752 [DOI] [PMC free article] [PubMed] [Google Scholar]
- 33. Becker I., Wang-Eckhardt L., Yaghootfam A., Gieselmann V., Eckhardt M. (2008) Histochem. Cell Biol. 129, 233–241 [DOI] [PubMed] [Google Scholar]
- 34. Sambrook J., Fritsch E. F., Maniatis T. (1989) Molecular Cloning: A Laboratory Manual, 2nd Ed., Cold Spring Harbor Laboratory, Cold Spring Harbor, NY [Google Scholar]
- 35. Mochel F., Engelke U. F., Barritault J., Yang B., McNeill N. H., Thompson J. N., Vanderver A., Wolf N. I., Willemsen M. A., Verheijen F. W., Seguin F., Wevers R. A., Schiffmann R. (2010) Neurology 74, 302–305 [DOI] [PMC free article] [PubMed] [Google Scholar]
- 36. Kang W. K., Icho T., Isono S., Kitakawa M., Isono K. (1989) Mol. Gen. Genet. 217, 281–288 [DOI] [PubMed] [Google Scholar]
- 37. Hamada-Kanazawa M., Kouda M., Odani A., Matsuyama K., Kanazawa K., Hasegawa T., Narahara M., Miyake M. (2010) Biol. Pharm. Bull. 33, 729–737 [DOI] [PubMed] [Google Scholar]
- 38. Miyake M., Kakimoto Y. (1981) J. Neurochem. 37, 1064–1067 [DOI] [PubMed] [Google Scholar]
- 39. Burlina A. P., Ferrari V., Burlina A. B., Ermani M., Boespflug-Tanguy O., Bertini E. (2006) Adv. Exp. Med. Biol. 576, 353–359 [DOI] [PubMed] [Google Scholar]
- 40. Mochel F., Boildieu N., Barritault J., Sarret C., Eymard-Pierre E., Seguin F., Schiffmann R., Boespflug-Tanguy O. (2010) Biochim. Biophys. Acta 1802, 1112–1117 [DOI] [PMC free article] [PubMed] [Google Scholar]
- 41. Sartori S., Burlina A. B., Salviati L., Trevisson E., Toldo I., Laverda A. M., Burlina A. P. (2008) Eur. J. Paediatr. Neurol. 12, 348–350 [DOI] [PubMed] [Google Scholar]
Associated Data
This section collects any data citations, data availability statements, or supplementary materials included in this article.


