Abstract
The proportions of body fat and fat-free mass are determining factors of adiposity-associated diseases. Work in Caenorhabditis elegans has revealed evolutionarily conserved pathways of fat metabolism. Nevertheless, analysis of body composition and fat distribution in the nematodes has only been partially unraveled because of methodological difficulties. We characterized metabolic C. elegans mutants by using novel and feasible BODIPY 493/503-based fat staining and flow cytometry approaches. Fixative as well as vital BODIPY staining procedures visualize major fat stores, preserve native lipid droplet morphology, and allow quantification of fat content per body volume of individual worms. Colocalization studies using coherent anti-Stokes Raman scattering microscopy, Raman microspectroscopy, and imaging of lysosome-related organelles as well as biochemical measurement confirm our approaches. We found that the fat-to-volume ratio of dietary restriction, TGF-β, and germline mutants are specific for each strain. In contrast, the proportion of fat-free mass is constant between the mutants, although their volumes differ by a factor of 3. Our approaches enable sensitive, accurate, and high-throughput assessment of adiposity in large C. elegans populations at a single-worm level.
Keywords: C. elegans, CARS microscopy, fatty acid, fatty acid metabolism, fluorescence microscopy, obesity, triglycerides
Body composition with respect to white adipose tissue and lean body mass is of central importance and a determining factor of adiposity-associated perturbations, such as diabetes type 2, cardiovascular disease, and cancer. Therefore, modulation of body composition and especially the reduction of body fat are the main foci of dietary and lifestyle interventions. In the last few years, Caenorhabditis elegans became a model organism for investigating fat storage and metabolism, as reviewed by different authors (1–3). Based on forward genetics (4–6), functional genomics, and candidate gene approaches (7, 8), more than 400 genes possibly involved in fat storage were described in C. elegans. Most of these genes are evolutionarily conserved and allocated in common pathways and are of relevance for the study of human adiposity.
Although C. elegans was extensively used as a model organism to study the genetic and functional basis of fat storage, robust lipid droplet markers such as perilipin are not available at the moment (2). Appropriate methods concerning the distribution behavior of dyes in the worm or the reproducibility of staining procedures are still under discussion (3). The classical fixative Sudan black dye (9) is shown to be very error prone in C. elegans because of the last ethanol-based washing steps. Recently O'Rourke et al. (10) demonstrated that the vital dyes Nile red and C1-C12-BODIPY-labeled fatty acid, which were used in more than 75 reports, stain lysosome-like granules rather than lipid droplets within the C. elegans intestine. These dyes were shown not to localize with the fixative neutral fat fluorophore LipidTox (10) and with the label-free lipid droplet visualizing coherent anti-Stokes Raman scattering (CARS) (11) or stimulated Raman scattering (SRS) signals (12) but with the lysosome-related organelle (LRO)-specific markers, LysoTracker and glo-1 (10, 13, 14). So far, fixative-based Oil Red O and Nile red staining have been characterized as appropriate methods to stain and quantify the main fat stores in C. elegans (10, 15).
In order to characterize metabolic C. elegans mutants regarding body composition in this study, we employed the fluorescent neutral lipid dye BODIPY 493/503. As shown by flow cytometry with MA-10 Leydig tumor cells, BODIPY 493/503 is more specific than Nile red for staining lipid droplets (16). In addition to cell culture, the dye has been used in a wide range of organisms and tissues including yeast (17, 18), Drosophila (19, 20), and rat soleus muscle fibers (21) and as vital dye in staining of LRO markers in C. elegans (13). Here, we have developed a protocol for staining and quantification of fixed worms, using BODIPY 493/503. Furthermore, body composition analysis and a novel quantitative BODIPY 493/503-based flow cytometry method allowing parallel measurement of fat content and body volume revealed specific fat proportions of dietary restriction, TGF-β, and germline mutants at single-worm level. Additionally, we show that vital staining of worms with BODIPY 493/503 using a short incubation time leads to a very efficient staining of lipid droplets. This method may be suitable for screening assays.
MATERIALS AND METHODS
Strains and C. elegans maintenance
Bristol N2 was used as the wild-type strain. The glp-1 (e2141), eat-2 (ad465), and daf-7 (e1372) mutant strains were used. The Glp-1 mutant was a gift from Ralf Schnabel (Technical University of Braunschweig, Germany). Other strains were obtained from the Caenorhabditis Genetic Center. Nematodes were cultured on Escherichia coli OP50 lawns on NGM agar plates, as described previously (22), at 15°C, 20°C, or 25°C. For all experiments, strains were synchronized by hypochlorite treatment of gravid adults.
BODIPY 493/503 staining and quantification
The BODIPY 493/503 stock solution (1 mg/ml) was prepared in DMSO. A fresh solution of BODIPY 493/503 diluted in M9 buffer at the indicated concentrations was used for staining. For fixative staining, freshly harvested nematodes were washed in M9 buffer, incubated in 4% paraformaldehyde solution for 15 min, which was followed by three freeze/thaw cycles in liquid nitrogen. After paraformaldehyde solution was removed by three washing steps with M9, worms were incubated in a volume of 500 µl of 1 µg/ml BODIPY 493/503 (Invitrogen) in M9 for 1 h at room temperature. Nematodes were washed three times with M9 buffer and were used for microscopy or flow cytometry analysis. For vital staining, freshly harvested nematodes were incubated in M9/BODIPY 493/503 (6.7 µg/ml) solution for 20 min. An incubation of 20 min generated a sufficient BODIPY 493/503 signal and prevented starvation of the worms and staining of LROs. Afterward, worms were washed three times with M9 and used immediately for further experiments. BODIPY 493/503 fluorescence was visualized using an Axio Observer D1 inverted microscope (Zeiss) using filter 38HE (excitation, bandpass [BP] 470/40; beam splitter FT 495; emission BP 525/50). Images were captured with an Axiocam MRm camera. Quantification of fixative BODIPY 493/503 staining of 20–30 whole worms/experiment was performed using Axio-Vision software version 4.8 (Zeiss).
Additionally, fluorescence was quantified using the cytometry-based object parametric analysis and sorting system (COPAS), Biosort (Union Biometrica), which measures time of flight (TOF; nematode length), decrease in laser light when a worm passes through the laser beam (extinction), and green fluorescence (BODIPY fluorescence) for each animal. The system is equipped with a 488 nm multiline argon laser. Green and red fluorescence emissions were measured using a filter of 510 nm, with a bandwidth of 23 nm. Worms were washed from plates, placed in the COPAS sample cup, and analyzed. COPAS settings were as follows: gains: extinction (EXT), 1; green, 1; yellow, 1 and red, 1; thresholds: signal, 50 and TOF minimum, 100. Voltages of photomultiplier tubes for the green, yellow, and red channels were set to 600 V. Only objects with TOF values of adult nematodes and signals detected in the green channel were included in quantification data. The background fluorescence of unstained worms was subtracted in microscopy and COPAS analyses. Nematodes (250 to 2,000) in each of two to three independent experiments were analyzed using COPAS. Microscopy and COPAS settings were kept identical to allow a direct comparison between groups.
For colocalization studies, nematodes were stained with 1 µg/ml BODIPY 493/503 and LipidTOX deep red (1:200 dilution; Invitrogen) or Nile red (1 µg/ml; Sigma), for 1 h. Confocal images were taken using a Leica TCS SP1 confocal system (Leica) equipped with an HCX PL APO CS 63.0 × 1.32 oil-immersion objective. BODIPY 493/503 and LipidTox deep red were excited at 488 and 633 nm, respectively. Signals were collected with a TD488/543/633 beam splitter at 500–565 nm and 640–720 nm, respectively. BODIPY 493/503 and Nile red were excited at 488 nm. Signals were collected with a TD488/543/633 beam splitter at 500–520 nm and 600–650 nm, respectively. Autofluorescence and LysoTracker red in vital worms were detected using filter sets 49 (excitation, G 665; beam splitter, G 395; emission, BP 445/50) (23) and 43 HE (excitation BP 550/25; beam splitter, FT 570; emission, BP 605/70), respectively. At all fluorophore combinations, an optimal separation of channels was ensured. The quantitative colocalization analysis was performed using ImageJ plugin JACoP (Just Another Colocalization Plugin) (24).
Oil Red O staining
After 15 min of 4% paraformaldehyde fixation followed by three freeze/thaw cycles in liquid nitrogen, worms were washed with PBS and dehydrated in 60% isopropanol. Afterward, worms were stained in filtered Oil Red O staining solution (60% Oil Red O stock solution [5 mg/ml isopropanol]/40% water). Worms were washed with PBS and observed with an Axio Observer D1 inverted microscope (Zeiss). Images were captured with an AxioCamICc1 camera.
Flow cytometry and biochemical assays
Synchronized worms were cultivated until they reached adulthood. Synchronized adult nematodes (300–600) were counted for each biological replicate by using the COPAS Biosort system. The worms were resuspended in 70 µl of lysis buffer (50 mM Tris, pH 7.5; 150 mM NaCl; 1 mM EDTA, pH 8.0; 0.5% NP-40; protease inhibitors) and sonicated using a Sonopuls HD 2070 (Bandelin) with an MS72 sonotrode at 30% power for 2 × 8 s. Insoluble material was removed by centrifugation at 21,000 g for 20 min. We assayed triacylglycerol (TAG) content spectrophotometrically, using an enzymatic assay kit (Analyticon) with a TAG standard (Biovision) according to the manufacturer's instructions. As shown in supplementary Fig. III, the TAG assay kit is suitable for determination of TAG in C. elegans. The protein content was determined using a bicinchoninic acid reagent kit (Pierce) with BSA as standard. We performed two to three independent experiments for each genotype and condition with two replicates, respectively. We measured total TAG and protein contents for each homogenate in duplicate in two independent measurements, respectively. To account for differences in total TAG content per worm, we used protein and body volumes as covariates in the analysis of the data.
CARS microscopy
Worms were washed in M9 buffer, resuspended in 2% NaN3 and placed on glass slide. A cover glass was then gently applied to the sample. CARS images shown in Fig. 3 were recorded using a CARS microscope that was custom built by A. Zumbusch and M. Winterhalder at the University of Konstanz, based on a Leica TCS SP5 multiphoton microscope. As excitation source for the pump beam, the output of an optical parametric amplifier (APE, Berlin, Germany) was used, whereas the output of a Ti:sapphire laser (Coherent Mira, Santa Clara, CA) served as the Stokes beam. Both sources were electronically synchronized (coherent SynchroLock, Santa Clara, CA). Images were recorded at a laser frequency difference of 2,845 cm−1, corresponding to an aliphatic CH vibrational resonance.
The setup used for CARS microscopy shown in Fig. 4, 5, and 10 was described previously (25). For the experiments, narrowband (bandwidth, 0.5–1 nm) ps pulses were used to match the C-H stretching region at about 2,900 cm−1. The Stokes pulses were provided by a Ti:sapphire laser centered at 831.7 nm. In addition, this laser served as a pump source for an optical parametric oscillator (OPO), which was tuned to 670 nm for resonant and 678 nm for vibrationally nonresonant excitation. These last settings were used as controls to ensure that image contrast stemmed from a CARS process. After the pump and Stokes pulses were overlapped both temporally and spatially by a delay stage and a longpass filter, the two laser beams were directed into a commercial laser scanning microscope (510 Meta; Zeiss). The two beams were focused onto the object plane by a 63×/NA 1.40 oil immersion objective, which was used for CARS and fluorescence measurements as well. The power of the Stokes pulse was about 12 mW, and the power of the pump pulse was about 16 mW at the sample. The anti-Stokes signal at 561 nm was detected in forward direction and spectrally filtered from the incoming beams by the combination of shortpass and bandpass filters and detected by a photomultiplier. For every sample position, a depth profile (z-stack) was measured, recording 30 focal plane images separated by 1 µm each. The image size was 512 × 512 pixels, and the image acquisition time per image plane was about 6.3 s
Two-photon fluorescence
The two-photon fluorescent signal was recorded simultaneously with the CARS images. The signal, which was generated by the excitation from the OPO wavelength at 670 nm, was recorded in reflection mode by using an internal BP 435–485 filter.
One-photon fluorescence
For one-photon excitation, an argon-ion laser from the laser scanning microscope was used, which provided 488 nm (10 µW at the sample) for exciting the fluorescence of the BODIPY 493/503 dye. The fluorescence signal was filtered by a band-path filter and detected in reflection. The z-stacks with the same experimental settings were recorded.
Raman data acquisition and data analysis
Raman spectra were acquired using a WITec, GmbH (Ulm, Germany) CRM 2000 model confocal Raman microscope. Excitation (approximately 5 mW at 488 nm at the sample) is provided by an air-cooled argon-ion laser (series 77; Lasos, Jena, Germany). The exciting laser radiation is coupled to a Zeiss microscope through a wavelength-specific single-mode optical fiber. The incident laser beam is collimated via an achromatic lens and passes through a holographic BP filter before it is focused onto the sample through the microscope objective. A Nikon Fluor (60×/1.00 NA, WD = 2.0 mm) water immersion objective was used in the studies reported here. The sample is located on a piezo-electrically driven microscope scanning stage with an x-y resolution of approximately 3 nm and a repeatability of ±5 nm, and a z resolution of approximately 0.3 nm and ±2 nm repeatability. The sample is scanned through the laser focus in a raster pattern at a constant stage speed of fractions of a micrometer per second. The continuous motion prevents sample degradation at the focal point of the laser beam. Spectra are collected at a 0.5 μm grid, with a dwell time of 0.25 s. Preceding fluorescent images were recorded at approximately 0.1 mW and an illumination time of 0.1 s. Raman images were reconstructed using a spectral decomposition algorithm based on vertex component analysis (26). Fluorescence images are based on fluorescence intensities.
RESULTS
A BODIPY 493/503-based protocol stains major fat stores in C. elegans and preserves native lipid droplet morphology
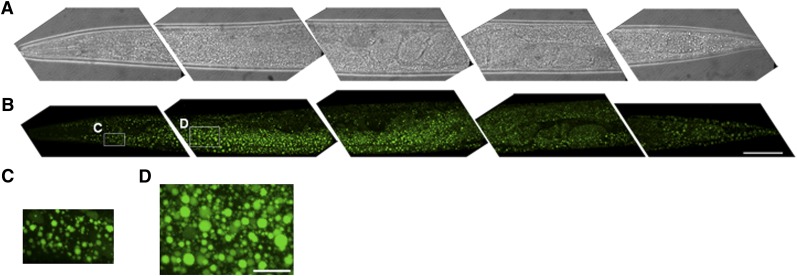
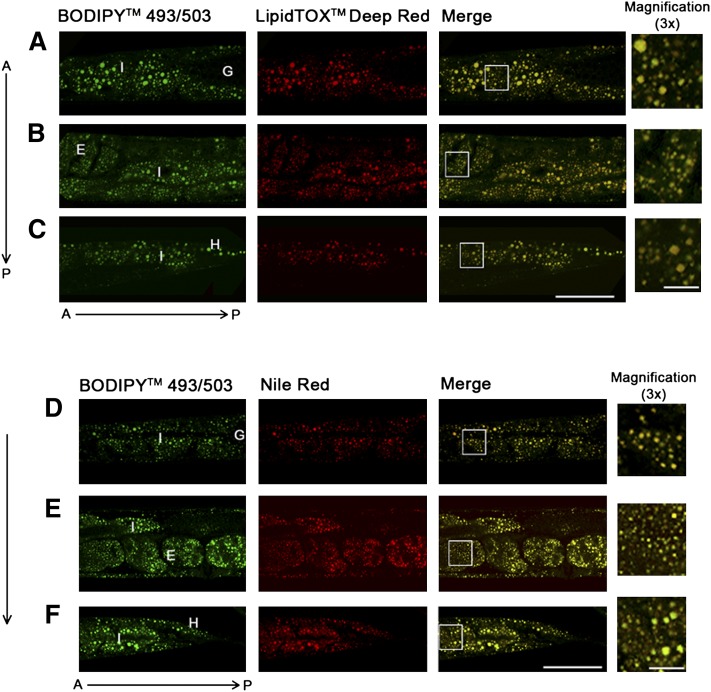
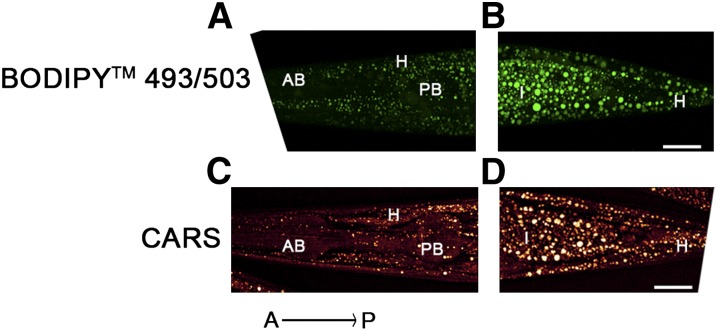
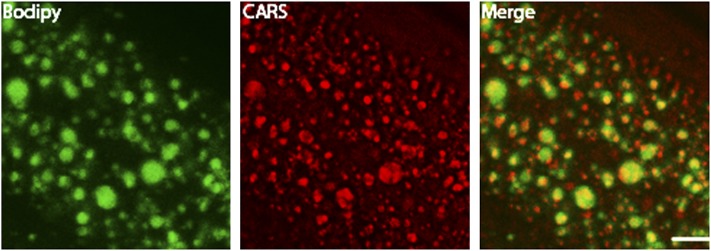
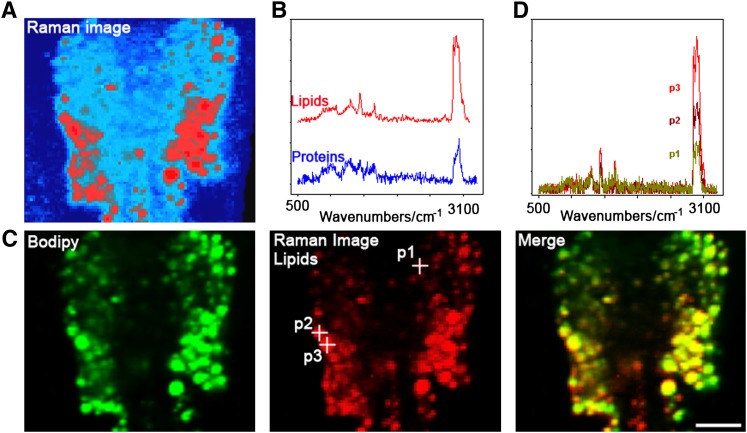
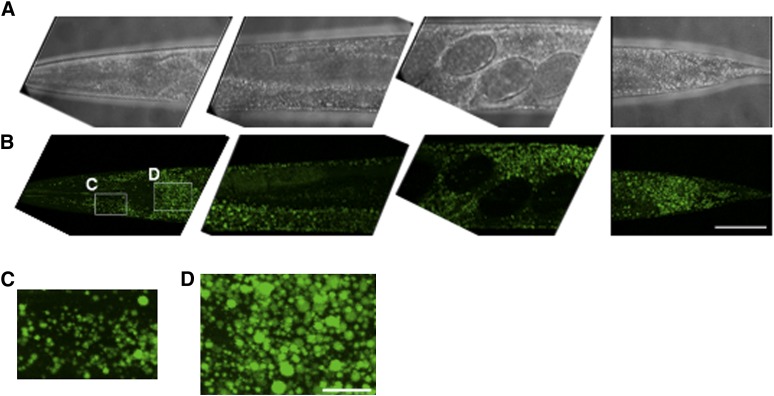
In order to characterize fat stores in C. elegans, we developed a gentle staining procedure with short fixation times and without dehydration steps, using the lipid droplet-specific fluorophore BODIPY 493/503. As shown in Fig. 1A and B, the BODIPY 493/503-based protocol preserves worm anatomy and stains spherical structures in the intestine and hypodermis. These compartments are described as the major fat stores of C. elegans wild-type N2 (2). Droplets in oocytes and embryos are also stained by BODIPY 493/503. The BODIPY 493/503-labeled intracellular vesicles are fine and distinctly distributed (Fig. 1C, D). Most of the droplets are <3 µm in diameter. To provide evidence that the BODIPY 493/503-labeled vesicles are lipid droplets, we tested our protocol with LipidTox deep red and Nile red and performed colocalization studies. As shown in Fig. 2, BODIPY 493/503 stains the same compartments and droplets that the two other neutral lipid dyes do. To measure the extent of overlap between the BODIPY 493/503 stain and that of the two other dyes, we calculated the Pearson correlation coefficient (r). The value of this coefficient ranges from −1 to 1; the higher the value of r, the stronger the correlation between the red and green images. The mean Pearson correlation coefficients ± standard deviations (SD) for BODIPY 493/503 with LipidTox, r = 0.927 ± 0.0056, and Nile red, r = 0.934 ± 0.027 (3–5 stacks), reported a high degree of colocalization of BODIPY 493/503 with LipidTox deep red and Nile red. We further proved our BODIPY 493/503 staining procedure with CARS microscopy, a nonlabeling method for visualizing lipid droplets in C. elegans in vivo without fixation steps (11, 27) or after fixation with paraformaldehyde (28). As shown in Fig. 3, CARS microscopy of vital worms shows intestinal and hypodermal lipid droplets similar in size, morphology, and distribution to droplets in images obtained by fixative BODIPY 493/503 staining. Furthermore, colocalization experiments revealed that BODIPY 493/503 stains the same vesicles that are detected with CARS microscopy (Fig. 4) . As a second method that allows a label-free visualization of lipids, proteins, and other metabolites, we applied Raman microspectroscopy of fixed BODIPY 493/503-stained animals. As shown in Fig. 5, the BODIPY 493/503-labeled structures overlap with lipid signals of Raman spectra, and similar signal intensities are observed. Thus, our data demonstrate that the BODIPY 493/503-stained organelles in fixed animals are lipid droplets with a well-preserved morphology.
Fig. 1.
BODIPY 493/503 staining protocol preserves worm anatomy and stains neutral lipids in the major storage compartments, intestine and hypodermis, and in oocytes and embryos. Brightfield (A) and BODIPY 493/503 confocal images (B) of 1-day-old adult wild-type worms are shown in 3D projection of ∼35 images from a z-stack at 1 µm intervals. Five segments from a wild-type worm were imaged with a 63× oil immersion objective. The anterior part is on the left. Bar, 50 µm. (C) Magnified view of hypodermal lipid droplets in head. (D) Magnified view of lipid droplets in proximal intestine. Bar, 10 µm.
Fig. 2.
BODIPY 493/503 signals colocalize with the dyes Nile red and LipidTox deep red. Fixed worms were stained with BODIPY 493/503 and LipidTox deep red (A–C) or with BODIPY 493/503 and Nile red (D–F). Images were taken of proximal intestine (A, D), middle intestine with uterus (B, E), and distal intestine with tail hypodermis (C, F). A, anterior; P, posterior; I, intestine; G, gonad; E, embryo, H, hypodermis. Bar, 50 µm; 10 µm in magnified views.
Fig. 3.
Comparison of images obtained by BODIPY 493/503 staining (A, B) and noninvasive CARS microscopy (C, D). BODIPY 493/503-stained lipid droplet sizes concur well with the native droplet morphology distribution in a living worm, detected with CARS microscopy. BODIPY 493/503 and CARS confocal images of 1-day-old adult wild-type worms are shown in maximum projection of ∼35 images from a z-stack at 1 µm interval (A, B) and ∼20 images at 1.5 µm interval (C, D). Fine granules in hypodermal cells of the head (A, C) and a higher content of large droplets in the distal part of intestine (B, D) are visualized with both methods. A, anterior; P, posterior; H, hypodermis; AB, anterior bulb; PB, posterior bulb; I, intestine. Bar, 20 µm.
Fig. 4.
Colocalization between BODIPY 493/503 signals and lipids visualized by CARS microscopy reveals that the stained organelles are lipid droplets in C. elegans. (A) BODIPY 493/503 staining; (B) CARS signals of lipid droplets. (C) Overlap of BODIPY 493/503 and CARS signals. Single focal planes are shown. Bar, 10 μm.
Fig. 5.
Colocalization between BODIPY 493/503 signals and lipids visualized by Raman spectroscopy in intestinal cells. (A) The Raman image visualizes lipids (red) and proteins (blue) by molecule-specific spectra (B). (C) BODIPY 493/503 fluorescence and Raman lipid signals show a strong overlap with similar signal intensities. Average lipid spectra of indicated positions in panel C are shown in panel D. Bar, 10 μm.
Quantification of BODIPY 493/503-based microscopy data agreed with biochemical analysis and revealed low fat content of eat-2 mutants and high fat levels of daf-7 and glp-1 mutants
The fat content of many C. elegans mutants is still under discussion because the well-established vital dyes Nile red and C1-C12-BODIPY-labeled fatty acids are not accurate proxies of fat stores in the worm (10). Here we selected the eat-2 (ad465), daf-7 (e1372), and glp-1(e2141) strains as principal fat storage mutants in order to quantify their fat content with BODIPY 493/503. The eat-2 (ad465) mutant, a genetic model of dietary restriction, lacks a functional pharyngeal nicotinic acetylcholine receptor subunit (29), resulting in low pumping rate (30). The TGF-β daf-7(e1372) mutant has ∼3-fold higher de novo fat synthesis rate than the wild type (31). The glp-1(e2141) mutant is a germline defective mutant with an early interruption of mitosis of germ cells at restrictive temperatures (32, 33). It was previously described as a low-fat mutant based on vital Nile red staining (34). A more recent work using fixative-based Oil Red O stain showed that the glp-1 mutant accumulates more fat than the wild type (10).
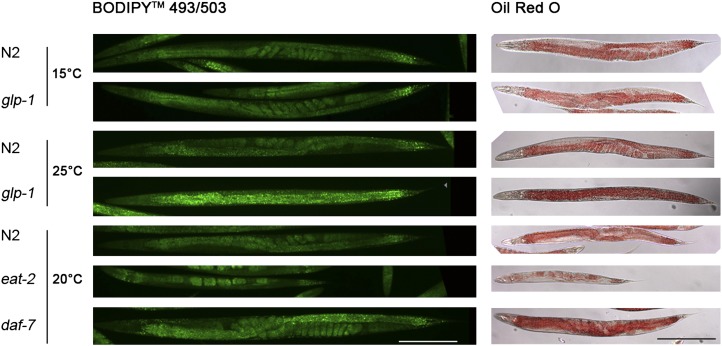
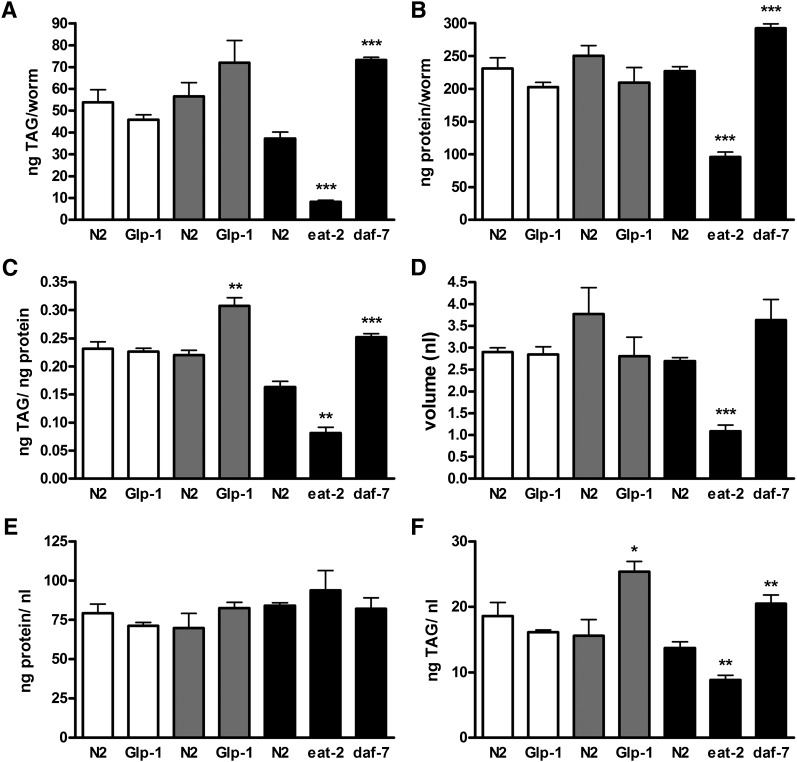
We stained fixed N2, eat-2, daf-7, and glp-1 nematodes with BODIPY 493/503 and quantified the resulting fluorescence signals of worm images. Figure 6 shows representative images obtained from BODIPY 493/503 staining, and Table 1 shows quantitative data. For comparison, Oil Red O staining was also performed (Fig. 6). The eat-2 mutant shows 57% of BODIPY 493/503 signal per worm in comparison to that of N2. The daf-7 mutants accumulated twice as much BODIPY 493/503 as the wild type. The N2 and glp-1 strains did not differ in staining intensity when grown at the permissive temperature (15°C). However, at restrictive temperature (25°C), when germ cell development is inhibited, the glp-1 mutant showed a 1.5-fold higher BODIPY 493/503 intensity per worm than the wild type. Our BODIPY 493/503 data are in accordance with those of Oil Red O staining, although this procedure caused remarkably high (about one-third) shrinkage of worms (Fig. 6). To further verify BODIPY 493/503-based quantifications, TAG contents of the eat-2, daf-7, and glp-1 mutants were determined using an enzymatic assay from a distinct number of worms, which were obtained using a flow cytometry-based object parametric analysis and sorting system (COPAS) (Table 1). As shown in Table 1 and Fig. 7A, the mean TAG level ± standard error of the mean (SEM) of the eat-2 mutant (8.3 ± 0.7 ng/worm) is about 4-fold lower than that of N2 (37.2 ± 3.0 ng/worm), whereas the daf-7 mutant accumulated 2-fold more TAG (73.3 ± 10.1 ng/worm). TAG levels of the glp-1 (45.9 ± 2.3 ng/worm) and N2 (53.8 ± 5.9 ng/worm) strains were similar at permissive temperature (15°C). At restrictive temperature (25°C), the glp-1 mutant showed a 27.5% increase in TAG (72.0 ± 10.2 ng) compared with that of N2 (56.5 ± 6.4 ng). Thus, biochemical measurement of TAG content per worm correlates well with the BODIPY 493/503 microscopy quantification data of metabolic C. elegans mutants.
Fig. 6.
BODIPY 493/503 and Oil Red O relative staining intensity of the glp-1 (e2141), eat-2 (ad465), and daf-7 (e1372) mutants in comparison to that of the wild-type N2 are in good agreement. Quantifications for representative BODIPY 493/503 phenotypes shown here are summarized in Table 1.
TABLE 1.
TGA measurements and quantification of BODIPY 493/503 signals based on microscopy and COPAS flow cytometry of the eat-2, daf-7 and glp-1mutants
| TAG measurementa | BODIPY microscopyb | BODIPY-COPASc | |
|---|---|---|---|
| C. elegans strain (growth temp) | Mean ng of TAG/worm ± SEM,% of wild-type | Mean FU/worm ± SEM,% of wild-type | Mean FU/worm ± SEM,% of wild-type |
| eat-2 (ad465) | 22.34 ± 1.80 | 57.28 ± 3,28 | 72.16 ± 10,39 |
| daf-7 (e1372) | 197.30 ± 2.94 | 193.15 ± 1.45 | 196.50 ± 9.50 |
| glp-1 (e2141) (15°C) | 85.36 ± 4.33 | 100.30 ± 4.94 | 107.10 ± 5.99 |
| glp-1 (e2141) (25°C) | 127.50 ± 17.99 | 154.75 ± 30.15 | 150.85 ± 3.85 |
Biochemical, TAG, measurement was made for each homogenate in duplicates in two independent measurements, respectively. We performed two to three independent experiments for each genotype and condition with two replicates, respectively.
BODIPY 493/503 mean intensity (FU, fluorescence units) obtained by microscopy was measured for 20–30 worms from two to three independent experiments. Representative BODIPY 493/503 phenotypes are shown in Fig. 4.
BODIPY 493/503 mean intensity (FU, fluorescence units) obtained by COPAS flow cytometry was measured for 250–2,000 nematodes in each of two to three independent experiments. Data shown are means ± SEM of two to three independent experiments.
Fig. 7.
Body compositions of fat and protein content of the glp-1 (e2141), eat-2 (ad465), and daf-7 (e1372) mutants and wild-type N2 were assessed with different reference values. Worms were grown at different temperatures until adulthood at 15°C (open bars), 25°C (gray bars), and 20°C (black bars). (A) ng TAG/worm, (B) ng protein/worm, (C) TAG/protein, (D) nl worm volume, (E) ng protein/ nl volume, (F) ng TAG/ nl volume. Data are presented as means ± SEM from two to three independent experiments. Significant differences were analyzed using ANOVA followed by unpaired t-test of mutants with the wild-type under identical temperature conditions; and wild-type worms under different conditions; *, P < 0.05; **, P < 0.005; ***, P < 0.001. Bars indicate SEM.
Body composition analysis and BODIPY 493/503-based flow cytometry revealed specific fat proportions of the eat-2, daf-7, and glp-1 metabolic mutants at the single-worm level
Rather than the absolute fat content of an organism, the fat-to-fat-free ratio is one of the most relevant physiological parameters used to evaluate body composition and adiposity (35). To calculate this ratio in the eat-2, daf-7, and glp-1 mutants, we also determined the protein fraction. A part of the protein fraction contributes to the metabolic active body compartment of the nematodes. As shown in Fig. 7B, the protein content per worm of the eat-2 (96.2 ± 7.4 ng/worm) mutant is 2.4-fold lower and that of the daf-7 (292.7 ± 6.6 ng/ worm) mutant is 30% higher than in the wild type (227 ± 7.1 ng/worm). The glp-1 and N2 strains differ slightly in protein content at permissive as well as at restrictive temperatures. The TAG and protein values were used in order to calculate fat-to-fat-free ratios. Based on these values, the eat-2 mutant could be described as a lean mutant, whereas the daf-7 and glp-1 mutants are obese (Fig. 7C). Another central parameter for evaluating leanness or adiposity is the proportion of protein or fat in relationship to the body volume. Volumes (V) of the eat-2, daf-7, and glp-1 mutants were determined using a worm-adapted zylinder volume formula that includes worm area (A) and perimeter (P) (36, 37).
The body volumes of the different strains vary by a factor of 3 (Fig. 7D). The eat-2 mutant shows a markedly lower body volume (1.08 ± 0.14 nl/worm) than the N2 (2.7 ± 0.08 nl/worm). The volume of the daf-7 mutant is 1.3-fold higher than the wild type. The body volume of the glp-1 and N2 strains are almost identical at permissive temperature (15°C). At restrictive temperature, the glp-1 mutant shows a 20% reduction in body volume in comparison to that of N2. Interestingly, the TAG content per volume (Fig. 7F) is specific for each strain and represents leanness of the eat-2 mutant (64% of N2) and fatness of the daf-7 (150%) and glp-1 (163%) mutants. In contrast, the protein-to-volume ratios representing the proportions of fat-free mass in the worm are constant among strains (Fig. 7E). Taken together, the fat-to-fat-free mass and the fat-to-volume ratio are the most reliable parameters for comparing the levels of adiposity in different C. elegans strains.
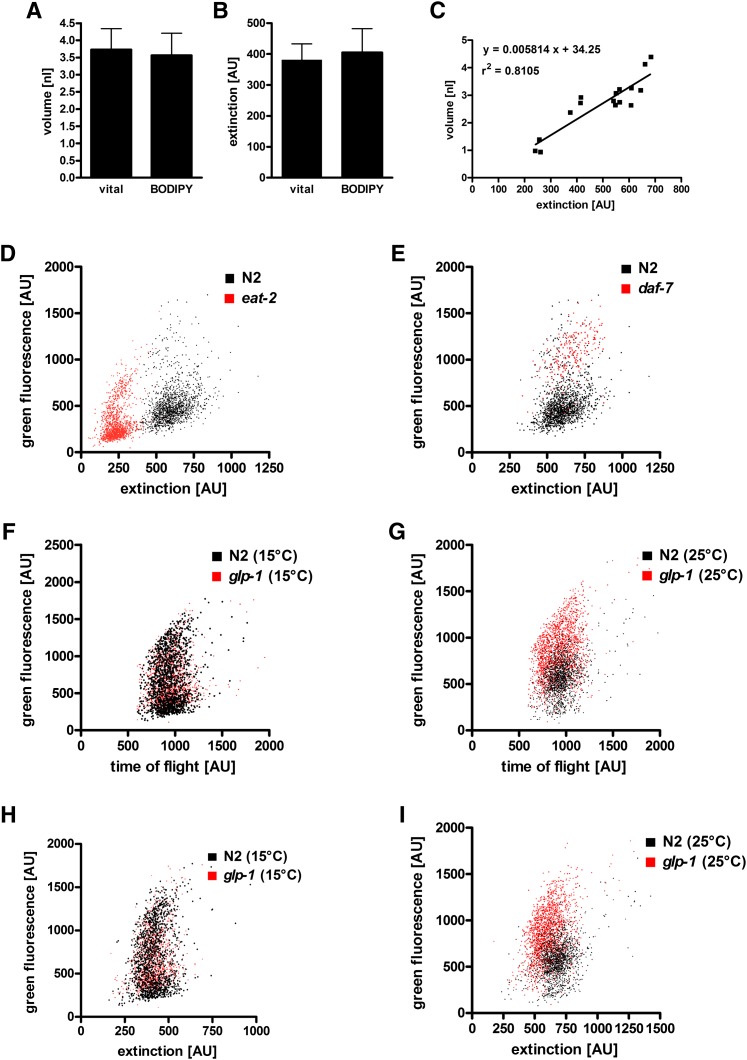
To measure the fat content per volume at the single-worm level in large C. elegans populations, we developed a high-throughput method based on BODIPY 493/503 and the flow cytometry sorting system, COPAS. In principal, the method simultaneously quantifies the integrated fluorescence intensity of BODIPY 493/503 (green fluorescence), the length of the worms (TOF), and the body volume-dependent decrease in laser light (extinction, 488 nm) of single worms. Because fixative BODIPY 493/503 protocol may influence the volume of the worms, we checked this putative confounder. There was no significant change in worm volume when vital and fixed animals were compared (Fig. 8A). The extinction signals of worms obtained by COPAS correlated well (r2 = 0.81) with their volumes (Fig. 8C) and were not influenced by fixation (Fig. 8B). Thus, the COPAS-derived extinction signals of BODIPY 493/503-fixed worms can be used as an accurate proxy for the volume of the worms. Next, we measured BODIPY 493/503 fluorescence emission of fat storage mutants by using COPAS. The resulting averaged BODIPY 493/503 signals per worm of the eat-2, daf-7, and glp-2 mutants are in agreement with fat contents obtained by BODIPY 493/503 microscopy and biochemical measurement (Table 1). Finally, BODIPY 493/503 fluorescence and extinction values of single worms were plotted. As shown in Fig. 8D, E, populations of the eat-2, daf-7, and N2 strains show distinct distributions and differences in fat contents and body volumes. To illustrate this for the glp-1 mutant in more detail, N2 worms and glp-1 mutants showed almost identical BODIPY 493/503 signals, body lengths (Fig. 8F), and body volume-dependent extinction signals (Fig. 8H), indicating similar body compositions for both strains at permissive temperature. At restrictive temperature (25°C), the glp-1 mutants showed higher fat content but similar body lengths compared to those of N2 (Fig. 8G). The body volume-dependent extinction signals of the glp-1 strain were slightly lower than those of N2 (Fig. 8I) and are in agreement with direct body volume measurements using image analysis (Fig. 7D). As a final result, the glp-1 mutant showed a 1.6-fold higher fat-to-volume ratio than the N2 strain at restrictive temperature, indicating fatness of the glp-1 mutant. Thus, data for BODIPY 493/503-based flow cytometry represents the proportion of fat at the single-worm level in large C. elegans populations.
Fig. 8.
Flow cytometry reveals fat content per volume in the glp-1 (e2141), eat-2 (ad465), and daf-7 (e1372) mutants relative to that of wild-type N2. (A) Volume (30–40 worms) and (B) extinction (n = 400) of N2 worms were compared before fixation and after BODIPY 493/503 staining. Data are presented as means ± SD. (C) Correlation between volume and extinction is shown. (D–I) Representative data from two to three independent experiments are shown. (D, E, H, I) BODIPY 493/503 fluorescence as a function of extinction is a proxy for fat content per volume of the eat-2, daf-7, and glp-1 mutants (at 15°C and 25°C) relative to that of the wild type. (F, G) BODIPY 493/503 fluorescence is as a function of TOF of the glp-1 mutant (at 15°C and 25°C) relative to that of the wild type is shown.
Furthermore, we stained the eat-2, daf-7, and glp-2 mutants with Nile Red after fixation and measured the red fluorescence and extinction by flow cytometry. As shown in supplementary Fig. I, where red fluorescence signal and extinction are plotted, the relative fluorescence data provide quantitative information about fat content of the mutants in relation to that of the wild type N2. For example, the glp-1 mutant shows a 1.8-fold higher fat-to-volume ratio than the N2. Therefore, fixative Nile red is, as also reported by Brooks et al. (15), a useful quantitative marker for worm TAG content, demonstrated here with flow cytometry using the COPAS Biosort instrument.
A novel vital staining protocol with BODIPY 493/503 enables the labeling of lipid droplets in vital worms
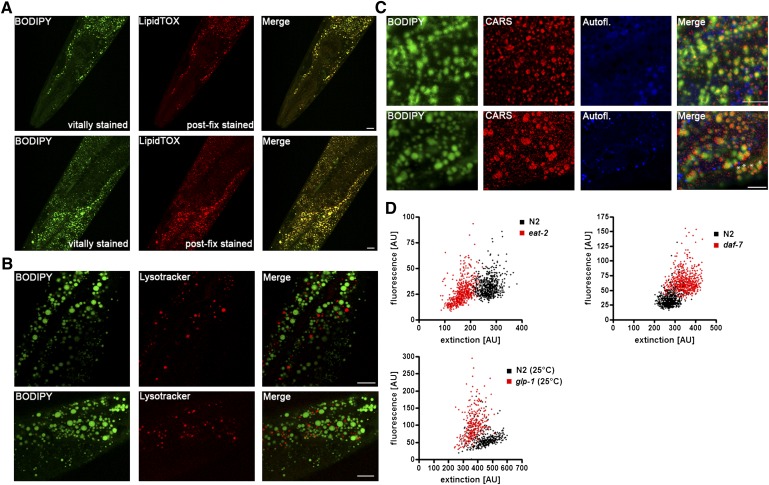
In addition to fixative staining of worms with BODIPY 493/503, we developed a new vital staining protocol. In contrast to feeding of worms at NGM plates with fluorescent dyes over a long time period, worms were stained in M9/BODIPY 493/503 solution for 20 min. For visualization of BODIPY 493/503 fluorescence in vitally stained worms, microscopy settings were used that did not allow the detection of autofluorescence signals in the green emission spectrum in unstained worms. Confocal three-dimensional (3D) projection images (Fig. 9) demonstrate that vesicles in intestine and hypodermal cells in the head region, the main body hypodermal syncytium hyp7, and the tail region, as well as in gonads and oocytes but not in embryos are stained. To verify that the stained compartments are lipid droplets and not LROs, we performed colocalization studies. First, we determined whether the vital BODIPY 493/503 staining before fixation is in accordance with LipidTox deep red staining after fixation. As shown in Fig. 10A, the vitally BODIPY 493/503-stained structures in head and proximal intestine colocalize with the postfixation LipidTox-stained lipid droplets. Second, we show that the vitally stained organelles do not overlap with LysoTracker red, a marker for acidic autofluorescent LROs (13, 38) (Fig. 10B). Third, the BODIPY 493/503 signals are in agreement with the CARS signals and do not colocalize with the autofluorescent signals of the LROs (Fig. 10C, and supplementary Fig. IIA). Of note, BODIPY 493/503-feeding worms on NGM plates for 18 h causes dye accumulation in the autofluorescent LROs (supplementary Fig. IIB). Thus, our data indicate convincingly that BODIPY 493/503 labels lipid droplets in vital worms when applied to the worm for a short time period. In Fig. 10D the flow-cytometric analysis of BODIPY 493/503 fluorescence and extinction of vitally stained wild-type N2 and eat-2, daf-7 and glp-1 (25°C) mutant worms is shown. The resulting fluorescence distribution patterns of the strains are very similar to those obtained by our fixative BODIPY 493/503 procedure (Fig. 8).
Fig. 9.
BODIPY 493/503 staining protocol stains neutral lipids in the major storage compartments, intestine and hypodermis, and in oocytes. Brightfield (A) and BODIPY 493/503 confocal images (B) of 1-day-old adult wild-type worms are shown in 3D projection of ∼25 images from a z-stack at 1 µm interval. Four segments from a wild-type worm were imaged with a 63× oil immersion objective. The anterior part is on the left. Bar, 50 µm; (C) magnified view of hypodermal lipid droplets in the head. (D) Magnified view of lipid droplets is shown in the first intestinal cells. Bar, 10 µm.
Fig. 10.
Colocalization between vitally stained BODIPY 493/503 compartments with LipidTox Deep red after fixation and CARS signals reveals that the stained organelles are lipid droplets and not autofluorescent LROs in C. elegans. (A) BODIPY 403/503 staining of vital worms and LipidTox staining after fixation; (B) BODIPY 493/503 staining and LysoTracker red; (C) BODIPY 493/503 staining, autofluorescence, and CARS signals of lipid droplets in vital worms. Single focal planes are shown. Bar, 10 μm. (D) Flow cytometry of vitally stained worms may reveal fat content per volume in the glp-1 (e2141), eat-2 (ad465), and daf-7 (e1372) mutants relative to that of wild-type N2.
DISCUSSION
We characterized the body composition of C. elegans fat storage mutants by using novel BODIPY 493/503-based microscopy and flow cytometry protocols. Comparison of images obtained with our protocol and label-free imaging in vivo using CARS microscopy revealed similar intestinal and hypodermal fat distributions and lipid droplet morphology of the N2 worms. The size of the lipid vesicles (<3 µm in diameter) stained with BODIPY 493/503 fits well with that recently reported (39). Colocalization of BODIPY 493/503-stained structures with the label-free CARS and Raman lipid signals also proves that BODIPY 493/503 exclusively stains lipid droplets. This finding is in agreement with the observation of Zhang et al. (14), who found that fixative Nile red shows only the lipid droplet-specific emission spectrum, in contrast to that of the vital staining method with Nile red (14). Fixative Oil Red O and Nile red staining were established as a suitable and quantitative method to stain the main fat stores in C. elegans (10, 15). In comparison to the Oil Red O procedure, our BODIPY 493/503 protocol easily detects small lipid droplets because of high sensitivity and resolution of the fluorophore. Particularly in regions with high lipid droplet density, visualization of single droplets is feasible with BODIPY 493/503 stain. Furthermore, the BODIPY 493/503 staining procedure preserves the morphology of lipid droplets because the protocol omits any dehydration steps using isopropanol or other alcohols. It has been reported that isopropanol leads to fusion of small adjacent lipid droplets (40). Thus, the BODIPY 493/503 staining procedure seems to be a reliable method to explore lipid droplet morphology in C. elegans and may be useful for colocalization studies using immunofluorescence or mCherry reporter.
We developed an easy protocol for vital staining with BODIPY 493/503 that enables the labeling of lipid droplets in vital worms. Common vital fat staining procedures in C. elegans showed that the dyes do not colocalize with fixative LipidTox (10) but do with LRO markers (10, 11, 13). In contrast, our BODIPY 493/503 signals in vital worms colocalized with fixative LipidTox signals as well as with CARS signals and do not colocalize with the autofluorescent signals of the LRO markers. The feeding of dyes over a longer period, as used in common vital staining protocols, may lead to metabolism of lipid dyes like xenobiotics that need to be degraded or stored in lysosome-like organelles. This is not the case in our vital staining procedure because we used short-term incubation of worms with BODIPY 493/503. Our method is in agreement with staining methods of fat in cell culture, where the staining occurs also within minutes (41). For future studies, our vital staining protocol in combination with the flow cytometry approach could provide an important advantage in screening C. elegans mutants with perturbed fat stores.
Different methods are employed to study lipid content and composition of C. elegans (1). Our quantification results of fat content per worm, using an enzymatic assay and BODIPY 493/503-based microscopy and flow cytometry, revealed a good agreement among these approaches. The fat contents of fat storage obtained from the eat-2, daf-7, and glp-1 mutants are also in accordance to other lipid biochemistry methods and reports that employed Nile red (15) or Oil Red O (10) as fixative dyes. In contrast to vital staining protocols, postmortem analysis of C. elegans fat content provides accurate results with different dyes and biochemical methods. A detailed analysis of reported fat contents in C. elegans revealed different reference values such as per worm phospholipid content or protein content. This is of importance with respect to data comparison as well as body composition analysis and assessment. The C. elegans wild type displays a TAG fraction of 40%–55% of total lipids (7, 13, 15). Thus, TAGs can be represented as TAG per phospholipid (31, 42). The resulting TAG data are referred to cell membranes that are proxy for the volume of an organism. Here, we used the volume of the worm as a direct reference value to describe the proportion of body fat in fat storage mutants. We found that the eat-2 and daf-7 mutants contain 64% and 150% TAG per volume (w/v) of the N2, respectively. These data correlate well with those found by Brooks et al. (15). We transformed the data from Brooks et al. to TAG per phospholipids to make them comparable with our data. After this transformation, we found that the eat-2 mutant contains 60% and the daf-7 mutant contains 169% TAG/phospholipid of the wild-type strain, which are consistent with our own data. The glp-1 mutant (25°C) contains 163% TAG/volume of N2. This is lower than the TAG data (297%) reported by O'Rourke et al. (10) but correlates very well with their Oil Red O staining results (147%) and our own BODIPY 493/503 quantification data (155%) for the glp-1 mutant. Because the data obtained by BODIPY 493/503 flow cytometry represent fat content per volume at a single-worm level, this high-throughput fat assessment method will allow an efficient and accurate screening of C. elegans fat storage mutants. Such a screening may be confounded by the number of eggs and embryos stored in the uterus of the hermaphrodites. For example, the eat-2 and glp-1 mutants (restricted temperature) have fewer or no eggs in comparison to that of N2 worms, whereas the daf-7 mutants retain more eggs and early-stage embryos. These differences influence triglyceride as well body volume measurement. Thus, we assumed that the resulting fat content per volume is not substantially influenced by different numbers of eggs. To address our hypothesis, the fat and protein content of the eggs and embryos should be determined in future studies.
In contrast to the TAG to volume ratio that seems to be specific for each mutant, protein-to-volume ratios reflecting the proportion of fat-free mass are very similar when comparing different conditions and strains. In support of this, Jonassen et al. (43) showed that wet weight-to-protein ratio (11.8) is constant between larvae and adults . This ratio is in good agreement with our protein-to-volume ratio (12.5), assuming a worm density of ∼1 g/cm−3. Furthermore, Houthoofd et al. (44) found similar protein-to-volume ratios for the N2 wild type and the eat-2 (ad1113) mutant. Protein is also commonly used as a reference value for TAG. Our data for N2 worms (0.16–0.23 µg of TAG/µg of protein) are supported by other enzymatically determined TAG levels: 0.2 µg of TAG/µg of protein (45) and 0.12 µg of TAG/µg of protein (46). TLC/GC measurements revealed a ratio of 0.15 (7). Brooks et al. reported lower ratios (∼0.06-0.07), and Srinivasan et al. reported 10-fold higher values (47). Differences in ratios may be due to different extraction and analysis methods and may be dependent on the developmental stage of nematodes or composition of E. coli food source.
Based on the literature and our own data, we estimated the average body composition of adult wild-type N2 worms. The C. elegans wild type consists of ∼16 ng of TAG/nl, which is about 1.6 w/v % of TAG (w/v %). Assuming a phospholipid fraction of 45%–60% of total lipid, the worm contains 3–4 w/v % lipids. The proportion of protein (∼78 ng/ nl) is about 7.8 w/v %. Assuming a water content of about 80%–85% (43), there is a difference of 5 to 10 w/v % that may be carbohydrates and insoluble matter, such as components of cuticula. Taken together, the C. elegans wild type contains about 5-fold less TAG (1.6 w/v %) than protein (7.8 w/v %), resulting in a TAG-to-protein ratio of 0.2. This is in contrast to that of other species. For example, rats have a TAG-to-protein ratio of 0.8 (48). However, the low fat content and high protein level of C. elegans reflects the low fat-to-protein ratio of E. coli, the food source of the worms (15). Fatty acid absorption from diet contributes essentially to saturated fatty acids palmitic (C16:0) and sterinic acid (C18:0) content in the nematode, because de novo synthesis is very low (5% and 7%, respectively), whereas the de novo synthesis of MUFAs and PUFAs is up to 20% (42). Brooks et al. (42) showed that there is an inverse correlation of C17iso fatty acid and TAG. C17iso fatty acid is de novo synthesized from the branched chain amino acid leucine. A selective protein deprivation as it is given in pep-2 mutants that lack intestinal peptide transporter activity (49) results in a decrease in C17iso fatty acid and increased TAG storage, whereas an overall dietary restriction (e.g., in the eat-2 worm) does not change the C17iso fatty acid concentration but reduces the content of TAGs in total lipid (1) or volume (our data). Also, in mammals, high-protein diets result in a shift to a higher ratio between lean and fat mass (50) and a reduction in food energy intake (51). Hereby, particularly leucine stimulates protein synthesis in muscle (52) and mediates hormonal hypothalamic responses by activating mTOR signaling (53, 54). In Drosophila, the fat-to-fat free ratio is highly variable depending on macronutrient intake (55). An intriguing question is whether the body composition in C. elegans is variable under different dietary protocols such as reduction of protein content in combination with high carbohydrate or high fat diets.
In conclusion, we developed BODIPY 493/503-based approaches in order to characterize fat storage and body composition of C. elegans mutants. The procedures have a number of advantages. First, the worm anatomy and the native morphology of lipid droplets are preserved. Second, the fluorescent dye allows an accurate and very sensitive quantification of body fat. Third, flow cytometry using BODIPY 493/503-stained worms displays fat quantity per volume at a single-worm level, allowing an accurate screening of fat storage mutants. Using these methods, we characterized the body composition of C. elegans and found that the fat content per volume is specific for dietary restriction, TGF-β, and germline mutants. In contrast, the proportion of fat-free mass is constant among these strains. Together, BODIPY 493/503-based and flow cytometry approaches allow sensitive and accurate assessment of adiposity in large C. elegans populations at a single-worm level.
Supplementary Material
Acknowledgments
The authors thank Ralf Schnabel (Technical University of Braunschweig, Germany) for fundamental theoretical and practical inputs; Andreas Zumbusch and Martin Winterhalder for initial CARS microscopy (University of Konstanz, Germany); Katharina Stiebeling for assistance in experimental set ups with high complexity; Astrid Reinke for manual high-throughput plate processing; and the Caenorhabditis Genome Center for providing C. elegans strains. F.D. and M.K. designed the study, conceived of the method, analyzed the data, and wrote the manuscript. M.K., M.E., D.P., and M.B. carried out worm experiments. M.K., C.M., G.B., B.D., and J.P. carried out colocalization studies using CARS microscopy and Raman microspectroscopy.
Footnotes
Abbreviations:
- BP
- bandpass
- CARS
- coherent anti-Stokes Raman scattering
- COPAS
- cytometry-based object parametric analysis and sorting system
- LRO
- lysosome-related organelle
- OPO
- optical parametric oscillator
- TOF
- time of flight
- TAG
- triacylglycerol
This work was supported by a structural grant from the Deutsche Forschungsgemeinschaft in the context of the Cluster of Excellence Inflammation at Interfaces at the University of Kiel and by a grant from the German Ministry of Education and Science (BMBF 0315681).
The online version of this article (available at http://www.jlr.org) contains supplementary data in the form of three figures.
REFERENCES
- 1.Watts J. L. 2009. Fat synthesis and adiposity regulation in Caenorhabditis elegans. Trends Endocrinol. Metab. 20: 58–65. [DOI] [PMC free article] [PubMed] [Google Scholar]
- 2.Mullaney B. C., Ashrafi K. 2009. C. elegans fat storage and metabolic regulation. Biochim. Biophys. Acta. 1791: 474–478. [DOI] [PMC free article] [PubMed] [Google Scholar]
- 3.Elle I. C., Olsen L. C., Pultz D., Rodkaer S. V., Faergeman N. J. 2010. Something worth dyeing for: molecular tools for the dissection of lipid metabolism in Caenorhabditis elegans. FEBS Lett. 584: 2183–2193. [DOI] [PubMed] [Google Scholar]
- 4.Jones K. T., Greer E. R., Pearce D., Ashrafi K. 2009. Rictor/TORC2 regulates Caenorhabditis elegans fat storage, body size, and development through sgk-1. PLoS Biol. 7: e60. [DOI] [PMC free article] [PubMed] [Google Scholar]
- 5.Mak H. Y., Nelson L. S., Basson M., Johnson C. D., Ruvkun G. 2006. Polygenic control of Caenorhabditis elegans fat storage. Nat. Genet. 38: 363–368. [DOI] [PubMed] [Google Scholar]
- 6.Soukas A. A., Kane E. A., Carr C. E., Melo J. A., Ruvkun G. 2009. Rictor/TORC2 regulates fat metabolism, feeding, growth, and life span in Caenorhabditis elegans. Genes Dev. 23: 496–511. [DOI] [PMC free article] [PubMed] [Google Scholar]
- 7.Ashrafi K., Chang F. Y., Watts J. L., Fraser A. G., Kamath R. S., Ahringer J., Ruvkun G. 2003. Genome-wide RNAi analysis of Caenorhabditis elegans fat regulatory genes. Nature. 421: 268–272. [DOI] [PubMed] [Google Scholar]
- 8.McKay R. M., McKay J. P., Suh J. M., Avery L., Graff J. M. 2007. Tripeptidyl peptidase II promotes fat formation in a conserved fashion. EMBO Rep. 8: 1183–1189. [DOI] [PMC free article] [PubMed] [Google Scholar]
- 9.Kimura K. D., Tissenbaum H. A., Liu Y., Ruvkun G. 1997. daf-2, an insulin receptor-like gene that regulates longevity and diapause in Caenorhabditis elegans. Science. 277: 942–946. [DOI] [PubMed] [Google Scholar]
- 10.O'Rourke E. J., Soukas A. A., Carr C. E., Ruvkun G. 2009. C. elegans major fats are stored in vesicles distinct from lysosome-related organelles. Cell Metab. 10: 430–435. [DOI] [PMC free article] [PubMed] [Google Scholar]
- 11.Yen K., Le TT, Bansal A, Narasimhan SD, Cheng JX, Tissenbaum HA. 2010. A comparative study of fat storage quantitation in nematode Caenorhabditis elegans using label and label-free methods. PLoS One . 5: e12810. [DOI] [PMC free article] [PubMed] [Google Scholar]
- 12.Wang M. C., Min W., Freudiger C. W., Ruvkun G., Xie X. S. 2011. RNAi screening for fat regulatory genes with SRS microscopy. Nat. Methods. 8: 135–138. [DOI] [PMC free article] [PubMed] [Google Scholar]
- 13.Schroeder L. K., Kremer S., Kramer M. J., Currie E., Kwan E., Watts J. L., Lawrenson A. L., Hermann G. J. 2007. Function of the Caenorhabditis elegans ABC transporter PGP-2 in the biogenesis of a lysosome-related fat storage organelle. Mol. Biol. Cell. 18: 995–1008. [DOI] [PMC free article] [PubMed] [Google Scholar]
- 14.Zhang S. O., Trimble R., Guo F., Mak H. Y. 2010. Lipid droplets as ubiquitous fat storage organelles in C. elegans. BMC Cell Biol. 11: 96. [DOI] [PMC free article] [PubMed] [Google Scholar]
- 15.Brooks K. K., Liang B., Watts J. L. 2009. The influence of bacterial diet on fat storage in C. elegans. PLoS ONE. 4: e7545. [DOI] [PMC free article] [PubMed] [Google Scholar]
- 16.Gocze P. M., Freeman D. A. 1994. Factors underlying the variability of lipid droplet fluorescence in MA-10 Leydig tumor cells. Cytometry. 17: 151–158. [DOI] [PubMed] [Google Scholar]
- 17.Szymanski K. M., Binns D., Bartz R., Grishin N. V., Li W. P., Agarwal A. K., Garg A., Anderson R. G., Goodman J. M. 2007. The lipodystrophy protein seipin is found at endoplasmic reticulum lipid droplet junctions and is important for droplet morphology. Proc. Natl. Acad. Sci. U S A. 104: 20890–20895. [DOI] [PMC free article] [PubMed] [Google Scholar]
- 18.Kurat C. F., Wolinski H., Petschnigg J., Kaluarachchi S., Andrews B., Natter K., Kohlwein S. D. 2009. Cdk1/Cdc28-dependent activation of the major triacylglycerol lipase Tgl4 in yeast links lipolysis to cell-cycle progression. Mol. Cell. 33: 53–63. [DOI] [PubMed] [Google Scholar]
- 19.Beller M., Sztalryd C., Southall N., Bell M, Jäckle H., Auld D. S., Oliver B. 2008. COPI complex is a regulator of lipid homeostasis. PLoS Biol. 6: e292. [DOI] [PMC free article] [PubMed] [Google Scholar]
- 20.Kohyama-Koganeya A., Kim Y. J., Miura M., Hirabayashi Y. 2008. A Drosophila orphan G protein-coupled receptor BOSS functions as a glucose-responding receptor: loss of boss causes abnormal energy metabolism. Proc. Natl. Acad. Sci. U S A. 105: 15328–15333. [DOI] [PMC free article] [PubMed] [Google Scholar]
- 21.Prats C., Donsmark M., Qvortrup K., Londos C, Sztalryd C, Holm C., Galbo H., Ploug T. 2006. Decrease in intramuscular lipid droplets and translocation of HSL in response to muscle contraction and epinephrine. J. Lipid Res. 47: 2392–2399. [DOI] [PubMed] [Google Scholar]
- 22.Brenner S. 1974. The genetics of Caenorhabditis elegans. Genetics. 77: 71–94. [DOI] [PMC free article] [PubMed] [Google Scholar]
- 23.Clokey G. V., Jacobson L. A. 1986. The autofluorescent “lipofuscin granules” in the intestinal cells of Caenorhabditis elegans are secondary lysosomes. Mech. Ageing Dev. 35: 79–94. [DOI] [PubMed] [Google Scholar]
- 24.Rasband W. S. 1997–2010. ImageJ. US National Institutes of Health, Bethesda, MD: (Accessed 2010, at http://rsb.info.nih.gov/ij/). [Google Scholar]
- 25.Vogler N., Bocklitz T., Mariani M., Deckert V., Markova A., Schelkens P., Rösch P., Akimov D., Dietzek B., Popp J. 2010. Separation of CARS image contributions with a Gaussian mixture model. J. Opt. Soc. Am. A Opt. Image Sci. Vis. 27: 1361–1371. [DOI] [PubMed] [Google Scholar]
- 26.Miljkovic M., Chernenko T., Romeo M. J., Bird B., Matthaus C., Diem M. 2010. Label-free imaging of human cells: algorithms for image reconstruction of Raman hyperspectral datasets. Analyst (Lond.). 135: 2002–2013. [DOI] [PubMed] [Google Scholar]
- 27.Hellerer T., Axang C., Brackmann C., Hillertz P., Pilon M., Enejder A. 2007. Monitoring of lipid storage in Caenorhabditis elegans using coherent anti-Stokes Raman scattering (CARS) microscopy. Proc. Natl. Acad. Sci. U S A. 104: 14658–14663. [DOI] [PMC free article] [PubMed] [Google Scholar]
- 28.Nan X., Cheng J. X., Xie X. S. 2003. Vibrational imaging of lipid droplets in live fibroblast cells with coherent anti-Stokes Raman scattering microscopy. J. Lipid Res. 44: 2202–2208. [DOI] [PubMed] [Google Scholar]
- 29.McKay J. P., Raizen D. M., Gottschalk A., Schafer W. R., Avery L. 2004. eat-2 and eat-18 are required for nicotinic neurotransmission in the Caenorhabditis elegans pharynx. Genetics. 166: 161–169. [DOI] [PMC free article] [PubMed] [Google Scholar]
- 30.Avery L. 1993. The genetics of feeding in Caenorhabditis elegans. Genetics. 133: 897–917. [DOI] [PMC free article] [PubMed] [Google Scholar]
- 31.Greer E. R., Perez C. L., Van Gilst M. R., Lee B. H., Ashrafi K. 2008. Neural and molecular dissection of a C. elegans sensory circuit that regulates fat and feeding. Cell Metab. 8: 118–131. [DOI] [PMC free article] [PubMed] [Google Scholar]
- 32.Austin J., Kimble J. 1987. glp-1 is required in the germ line for regulation of the decision between mitosis and meiosis in C. elegans. Cell. 51: 589–599. [DOI] [PubMed] [Google Scholar]
- 33.Priess J. R., Schnabel H., Schnabel R. 1987. The glp-1 locus and cellular interactions in early C. elegans embryos. Cell. 51: 601–611. [DOI] [PubMed] [Google Scholar]
- 34.Wang M. C., O'Rourke E. J., Ruvkun G. 2008. Fat metabolism links germline stem cells and longevity in C. elegans. Science. 322: 957–960. [DOI] [PMC free article] [PubMed] [Google Scholar]
- 35.Chaston T. B., Dixon J. B., O'Brien P. E. 2007. Changes in fat-free mass during significant weight loss: a systematic review. Int. J. Obes. ( Lond. ). 31: 743–750. [DOI] [PubMed] [Google Scholar]
- 36.Azevedo R. B., Keightley P. D., Lauren-Maatta C., Vassilieva L. L., Lynch M., Leroi A. M. 2002. Spontaneous mutational variation for body size in Caenorhabditis elegans. Genetics. 162: 755–765. [DOI] [PMC free article] [PubMed] [Google Scholar]
- 37.Ostrow D., Phillips N., Avalos A., Blanton D, Boggs A, Keller T, Levy L., Rosenbloom J., Baer C. F. 2007. Mutational bias for body size in rhabditid nematodes. Genetics. 176: 1653–1661. [DOI] [PMC free article] [PubMed] [Google Scholar]
- 38.Hermann G. J., Schroeder L. K., Hieb C. A., Kershner A. M., Rabbitts B. M, Fonarev P., Grant B. D., Priess J. R. 2005. Genetic analysis of lysosomal trafficking in Caenorhabditis elegans. Mol. Biol. Cell. 16: 3273–3288. [DOI] [PMC free article] [PubMed] [Google Scholar]
- 39.Zhang S. O., Box A. C., Xu N., Le Men J., Yu J, Guo F, Trimble R., Mak H. Y. 2010. Genetic and dietary regulation of lipid droplet expansion in Caenorhabditis elegans. Proc. Natl. Acad. Sci. U S A. 107: 4640–4645. [DOI] [PMC free article] [PubMed] [Google Scholar]
- 40.Fukumoto S., Fujimoto T. 2002. Deformation of lipid droplets in fixed samples. Histochem. Cell Biol. 118: 423–428. [DOI] [PubMed] [Google Scholar]
- 41.Greenspan P., Mayer E. P., Fowler S. D. 1985. Nile red: a selective fluorescent stain for intracellular lipid droplets. J. Cell Biol. 100: 965–973. [DOI] [PMC free article] [PubMed] [Google Scholar]
- 42.Perez C. L., Van Gilst M. R. 2008. A 13C isotope labeling strategy reveals the influence of insulin signaling on lipogenesis in C. elegans. Cell Metab. 8: 266–274. [DOI] [PubMed] [Google Scholar]
- 43.Jonassen T., Marbois B. N., Faull K. F., Clarke C. F., Larsen P. L. 2002. Development and fertility in Caenorhabditis elegans clk-1 mutants depend upon transport of dietary coenzyme Q8 to mitochondria. J. Biol. Chem. 277: 45020–45027. [DOI] [PubMed] [Google Scholar]
- 44.Houthoofd K., Braeckman B. P., Lenaerts I., Brys K., De Vreese A., Van Eygen S., Vanfleteren J. R. 2002. No reduction of metabolic rate in food restricted Caenorhabditis elegans. Exp. Gerontol. 37: 1359–1369. [DOI] [PubMed] [Google Scholar]
- 45.Zarse K., Ristow M. 2008. Antidepressants of the serotonin-antagonist type increase body fat and decrease lifespan of adult Caenorhabditis elegans. PLoS ONE. 3: e4062. [DOI] [PMC free article] [PubMed] [Google Scholar]
- 46.Takahashi K., Yoshina S., Masashi M. 2009. Nematode homologue of PQBP1, a mental retardation causative gene, is involved in lipid metabolism. PLoS ONE. 4: e4104. [DOI] [PMC free article] [PubMed] [Google Scholar]
- 47.Srinivasan S., Sadegh L., Elle I. C., Christensen A. G., Faergeman N. J., Ashrafi K. 2008. Serotonin regulates C. elegans fat and feeding through independent molecular mechanisms. Cell Metab. 7: 533–544. [DOI] [PMC free article] [PubMed] [Google Scholar]
- 48.Comizio R., Pietrobelli A., Tan Y. X., Wang Z, Withers R. T., Heymsfield S. B., Boozert C. N. 1998. Total body lipid and triglyceride response to energy deficit: relevance to body composition models. Am. J. Physiol. 274: E860–E866. [DOI] [PubMed] [Google Scholar]
- 49.Meissner B., Boll M., Daniel H., Baumeister R. 2004. Deletion of the intestinal peptide transporter affects insulin and TOR signaling in Caenorhabditis elegans. J. Biol. Chem. 279: 36739–36745. [DOI] [PubMed] [Google Scholar]
- 50.Jean C., Rome S., Mathe V., Huneau J. F., Aattouri N., Fromentin G., Achagiotis C. L., Tomé D. 2001. Metabolic evidence for adaptation to a high protein diet in rats. J. Nutr. 131: 91–98. [DOI] [PubMed] [Google Scholar]
- 51.Potier M., Darcel N., Tome D. 2009. Protein, amino acids and the control of food intake. Curr. Opin. Clin. Nutr. Metab. Care. 12: 54–58. [DOI] [PubMed] [Google Scholar]
- 52.Drummond M. J., Dreyer H. C., Fry C. S., Glynn E. L., Rasmussen B. B. 2009. Nutritional and contractile regulation of human skeletal muscle protein synthesis and mTORC1 signaling. J. Appl. Physiol. 106: 1374–1384. [DOI] [PMC free article] [PubMed] [Google Scholar]
- 53.Cota D., Proulx K., Smith K. A., Kozma S. C., Thomas G., Woods S. C., Seeley R. J. 2006. Hypothalamic mTOR signaling regulates food intake. Science. 312: 927–930. [DOI] [PubMed] [Google Scholar]
- 54.Morrison C. D., Xi X., White C. L., Ye J., Martin R. J. 2007. Amino acids inhibit Agrp gene expression via an mTOR-dependent mechanism. Am. J. Physiol. Endocrinol. Metab. 293: E165–E171. [DOI] [PMC free article] [PubMed] [Google Scholar]
- 55.Skorupa D. A., Dervisefendic A., Zwiener J., Pletcher S. D. 2008. Dietary composition specifies consumption, obesity, and lifespan in Drosophila melanogaster. Aging Cell. 7: 478–490. [DOI] [PMC free article] [PubMed] [Google Scholar]
Associated Data
This section collects any data citations, data availability statements, or supplementary materials included in this article.


