Abstract
Ceramides play a crucial role in divergent signaling events, including differentiation, senescence, proliferation, and apoptosis. Ceramides are a minor lipid component in terms of content; thus, highly sensitive detection is required for accurate quantification. The recently developed isobaric tags for relative and absolute quantitation (iTRAQ) method enables a precise comparison of both protein and aminophospholipids. However, iTRAQ tagging had not been applied to the determination of sphingolipids. Here we report a method for the simultaneous measurement of multiple ceramide and monohexosylceramide samples using iTRAQ tags. Samples were hydrolyzed with sphingolipid ceramide N-deacylase (SCDase) to expose the free amino group of the sphingolipids, to which the N-hydroxysuccinimide group of iTRAQ reagent was conjugated. The reaction was performed in the presence of a cleavable detergent, 3-[3-(1,1-bisalkyloxyethyl)pyridine-1-yl]propane-1-sulfonate (PPS) to both improve the hydrolysis and ensure the accuracy of the mass spectrometry analysis performed after iTRAQ labeling. This method was successfully applied to the profiling of ceramides and monohexosylceramides in sphingomyelinase-treated Madin Darby canine kidney (MDCK) cells and apoptotic Jurkat cells.
Keywords: ceramide, monohexosylceramide, sphingomyelinase, apoptosis, sphingolipid ceramide N-deacylase, cleavable detergent, mass spectrometry, multiple reaction monitoring, isobaric tags for relative and absolute quantitation
Ceramides are central intermediates of sphingolipid biosynthesis and degradation (1, 2). In addition to their metabolic importance, ceramides play a crucial role in a variety of signaling events, including differentiation (3), senescence (4), proliferation (5), and apoptosis (6, 7). Due to their physiological importance, analysis of their generation as well as their quantification has received considerable attention. Ceramides are quantitatively relatively minor cellular lipid components; thus, highly sensitive detection is required for quantification. Several methods of quantifying ceramide have been reported, including gas chromatography (GC) (8), high-performance liquid chromatography (HPLC) (9–11), diacylglycerol kinase assay (12), and mass spectrometry (MS) (13–18). Recent advances in MS have made this method a promising approach to the quantitative measurement of ceramides and other lipids. Considering the low cellular concentration of ceramides, it is important to concurrently determine the concentration ratios of ceramides from different samples, such as before and after stimulation of cells. However, simultaneous analysis of ceramide levels across multiple samples has not been reported to date.
Isobaric tags for relative and absolute quantitation (iTRAQ) have been developed to compare the protein expression levels in multiple samples (19, 20). These reagents have identical overall mass but vary in terms of the distribution of heavy carbon, nitrogen, and oxygen isotopes within their structure. One big advantage of iTRAQ is enhanced sensitivity because the intensity of the peaks determined is the sum of the intensity from multiple samples. In the course of MS, iTRAQ tags fragment to release tag-specific reporter ions. The ratios of these reporter ions are representative of the proportions of each peptide in the individual samples. The reactive group on the iTRAQ tags is an N-hydroxysuccinimide moiety, which interacts with primary amine groups. iTRAQ is widely employed for the quantification and profiling of proteins (21, 22). Recently, iTRAQ has been applied successfully to the labeling of aminophospholipids (23).
In the present study, we employed iTRAQ to quantify ceramides and monohexosylceramides. Ceramides and monohexosylceramides were hydrolyzed with sphingolipid ceramide N-deacylase (SCDase) to release fatty acids (24), and the resulting compounds with their free amino groups were labeled with iTRAQ reagents. Simultaneous measurement of multiple samples after sphingomyelinase treatment revealed the formation of ceramides characterized by their sphingoid base structure. We also applied this method to measure the increase of ceramide during apoptosis.
MATERIALS AND METHODS
Materials
Sphingolipid ceramide N-deacylase (SCDase) from Pseudomonas sp. was purchased from Takara Bio Inc. (Shiga, Japan). 3-[3-(1,1-bisalkyloxyethyl)pyridine-1-yl]propane-1-sulfonate (PPS) was from Protein Discovery, Inc. (Knoxville, TN). iTRAQ reagent kit was obtained from AB SCIEX (Foster City, CA). Porcine brain ceramide, porcine brain galactosylceramide, and porcine brain sphingomyelin were purchased from Avanti Polar Lipids (Alabaster, AL). Bovine buttermilk glucosylceramide was obtained from Matreya LLC (Pleasant Gap, PA). Ceramide/Sphingoid Internal Standard Mixture I, consisting of sphingosine d17:1, sphinganine d17:0, sphingosine-1-phosphate d17:1, sphinganine-1-phosphate d17:0, ceramide C12:0, ceramide C25:0, glucosylceramide C12:0, lactosylceramide C12:0, ceramide-1-phosphate C12:0, and sphingomyelin C12:0, was purchased from Avanti Polar Lipids. Bacillus cereus sphingomyelinase (SMase) was from Sigma-Aldrich (St. Louis, MO). Alexa Fluor 488-conjugated Annexin V was from Molecular Probes (Eugene, OR). Hoechst 33342 was from Nacalai Tesque Inc. (Kyoto, Japan). Mouse anti-human Fas (clone CH-11) monoclonal IgM was from MBL (Nagoya, Japan).
Hydrolysis of N-acyl linkage of sphingolipids by SCDase
SCDase hydrolysis was performed by the aqueous-organic biphasic method described previously (25) with modification. An amount of 10 µl of 50 mM sodium acetate, pH 6.0, containing 1% PPS and 5 mU of SCDase were added to dried lipids. After mixing, 100 µl or 500 µl of n-decane were added, and the biphasic mixture was incubated for appropriate intervals at 37°C. To facilitate hydrolysis, the upper organic solution was exchanged several times during incubation. The reaction was monitored by analyzing the lipids in aqueous phase by TLC with chloroform-methanol-25% NH4 aqua (90:20:0.5, v/v/v) (for ceramide, glucosylceramide, and galactosylceramide analysis) or with chloroform-methanol-25% NH4 aqua (5:4:1, v/v/v) (for sphingomyelin analysis). The lipids were visualized using copper sulfate spray, and then scanned using a LAS 4000 Mini Biomolecular Imager (GE Healthcare, Waukesha, WI).
Amine-reactive tagging of sphingoid base
Dried samples were resuspended in a mixture of 20 µl of 0.5 M triethylammonium bicarbonate buffer and 30 µl of ethanol. In case of samples hydrolyzed with SCDase, 10 µl of 0.5 M triethylammonium bicarbonate buffer and 30 µl of ethanol were added to lysosphingolipids in aqueous phase. iTRAQ reagents were resuspended in 70 µl of ethanol, and 30 µl of the reagents were added to the samples. The tagging reaction was carried out by incubation at room temperature for 1 h, followed by 30 min incubation after the addition of 0.1% trifluoroacetic acid aqua to hydrolyze excess iTRAQ reagent and PPS. The labeled sphingolipids were combined and injected onto a solid-phase extraction column (NOBIAS RP-OD1D, Hitachi High-Technologies Corp., Tokyo, Japan) to remove salt and excess reagents. After washing with 40% methanol aqua, the labeled sphingolipids were eluted with chloroform-methanol (9:1, v/v). To remove residual PPS, the eluted solution was injected onto a Si column (InertSep Si, 50 mg / 1 ml, GL Sciences, Tokyo, Japan), washed with chloroform-methanol (9:1, v/v), and eluted with methanol. The eluted sphingolipids were dried and stored at −20°C until use.
Mass spectrometry
An Agilent 1100 series LC (Agilent Technologies, Santa Clara, CA) coupled to a 4000 QTRAP hybrid triple quadrupole/linear ion trap mass spectrometer (AB SCIEX) was used to analyze the lipid samples. The samples were injected onto a reversed-phase C18 column (CAPCELL PAK C18 MG III, 2.0 × 50 mm, Shiseido Co., Ltd., Tokyo, Japan) at 0.3 ml/min. Solvent A [methanol-water-formic acid (58:41:1, v/v/v) with 5 mM ammonium formate] and solvent B [methanol-formic acid (99:1, v/v) with 5 mM ammonium formate] were used as eluent. The samples were eluted through the following gradient condition: Solvent A/B (6:4) 0.5 min, followed by a linear gradient until A/B (0:10) over the next 2.5 min. After 5 min at 100% solvent B, the gradient was brought back to A/B (6:4) over 0.5 min and the column was then equilibrated for 3.5 min. The mass spectrometer was run in the positive ion mode with the following instrument parameters: curtain gas of 30, ion spray voltage of 3,500, temperature of 450, nebulizer gas of 50, auxiliary gas of 50, and interface heater on. Multiple reaction monitoring (MRM) of sphingolipids was performed under optimal conditions as described previously (26). The acquisition parameters in MRM and chromatographic retention times of the iTRAQ-labeled sphingoid bases are listed in Table 1. Data acquisition and analysis were performed using Analyst Software version 1.4.1 (AB SCIEX). Lipid identifications were determined by MS/MS in enhanced product ion mode. Relative quantification was performed with peak areas observed in MRM using m/z 114.1, 115.1, 116.1, and 117.1 as Q3 parameters each. The peak area ratios were corrected with Cramer's rule described previously for overlapping isotopic contribution (27).
TABLE 1.
MRM parameters and retention times for iTRAQ-labeled sphingoid bases in this study
| Sphingoid Base | Q1 (m/z) | CE (V) | CXP (V) | RT (min) |
|---|---|---|---|---|
| iSo d16:1 | 416.4 | 35 | 9 | 2.0 |
| iSo d17:1 | 430.4 | 35 | 9 | 2.8 |
| iSo d18:1 | 444.4 | 40 | 10 | 3.6 |
| iSo d20:1 | 472.4 | 40 | 10 | 4.3 |
| iSa d16:0 | 418.4 | 40 | 9 | 2.9 |
| iSa d17:0 | 432.4 | 40 | 9 | 3.4 |
| iSa d18:0 | 446.4 | 45 | 10 | 3.9 |
| iSa d20:0 | 474.4 | 45 | 10 | 4.5 |
| ipS t16:0 | 434.4 | 40 | 9 | 1.9 |
| ipS t18:0 | 462.4 | 45 | 10 | 3.5 |
| ipS t20:0 | 490.4 | 45 | 10 | 4.2 |
| iS1P d17:1 | 510.4 | 40 | 9 | 3.4 |
| iSa1P d17:0 | 512.4 | 50 | 9 | 3.9 |
| iHexSo d16:1 | 578.4 | 35 | 9 | 1.6 |
| iHexSo d18:1 | 606.5 | 40 | 10 | 3.2 |
| iHexSo d20:1 | 636.5 | 40 | 10 | 4.1 |
| iHexSa d18:0 | 608.5 | 45 | 10 | 3.7 |
| iHexpS t18:0 | 624.5 | 45 | 10 | 3.2 |
CE, collision energies; CXP, collision cell exit potential; Hex, hexosyl; i, iTRAQ-labeled; pS, phytosphingosine; Q, quadrupole; RT, retention time; S1P, sphingosine 1-phosphate; Sa, sphinganine; Sa1P, sphinganine 1-phosphate; So, sphingosine; V, voltage.
Sphingomyelinase treatment of MDCK cells
Madin Darby canine kidney (MDCK) cells were maintained in medium A (DMEM low glucose (1 g/l) supplemented with 10% FCS and penicillin/streptomycin) (28). Cells were seeded at 1.2 × 10⁶ cells in 60 mm dishes. After two days, cells were washed twice with HBSS, and then treated with 1 U/ml SMase for 0, 15, 30, and 90 min at 37°C. After SMase treatment, cells were washed twice with PBS, and then scraped into 1 ml of 2 mM EDTA aqua. Lipid extraction was performed from 800 µl of the cell suspension by the Bligh and Dyer method (29), and protein concentrations were determined from remaining suspension by a Protein Assay Kit (BioRad, Hercules, CA). The lipid solutions were evaporated under N2 gas and stored at −20°C until use. To remove endogenous sphingoid bases, the lipid mixture was fractionated with a Si column (InertSep Si, 50 mg / 1 ml, GL Sciences). The lipids in chloroform-methanol (9:1, v/v) were injected onto the Si column, and the flow-through fraction was used for analysis of ceramide and monohexosylceramide.
Anti-Fas induced apoptosis of Jurkat cells
Jurkat cells were maintained in medium B [RPMI 1640 medium (Sigma-Aldrich) supplemented with 10% FCS and penicillin/streptomycin] (30). Apoptosis was induced by the addition of 500 ng anti-Fas antibody to 1 × 10⁶ cells in 5 ml of medium B. At appropriate intervals, cells were washed twice with PBS by centrifugation. The pellet was resuspended in 1 ml PBS. The lipids were analyzed as described above.
Fluorescence microscopy
An amount of 100 μl of 500 ng/ml anti-Fas antibody in medium B was added to 5 × 10⁴ Jurkat cells in 100 μl medium B. At appropriate intervals, 4 μg/ml Hoechst 33342 (final concentration) and Alexa Fluor 488-conjugated Annexin V were added. Specimens were observed under an LSM 510 confocal microscope equipped with a C-Apochromat 63XW Korr (1.2 NA) objective (Carl Zeiss, Oberkochen, Germany).
RESULTS AND DISCUSSION
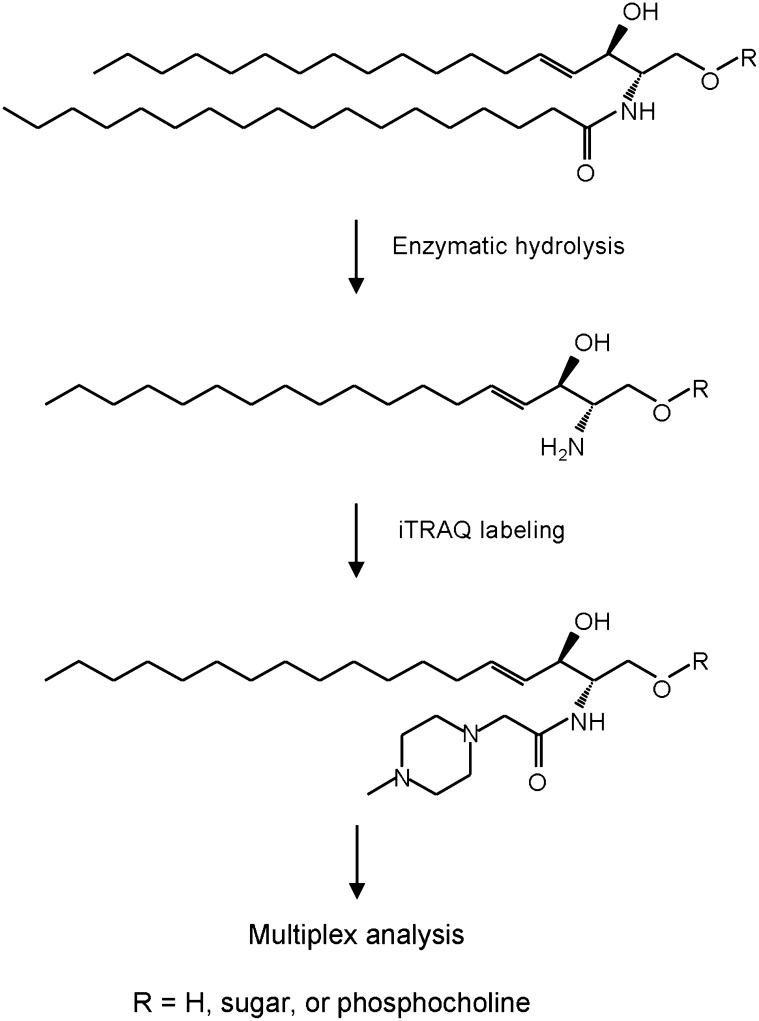
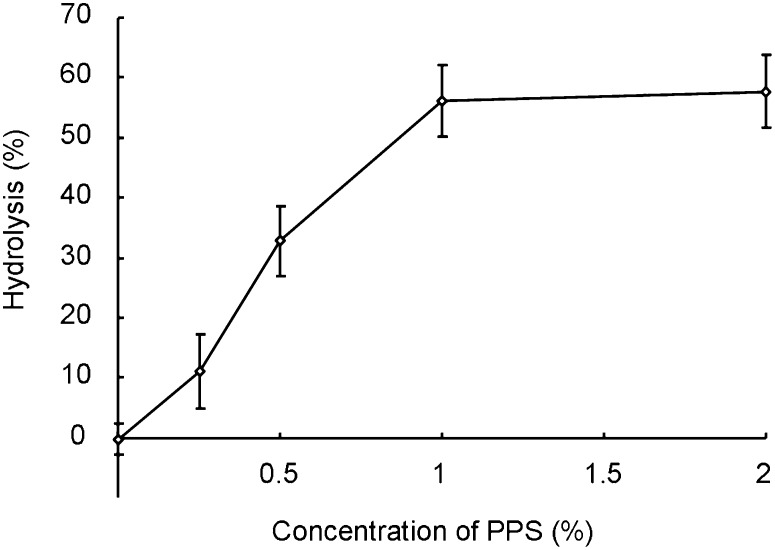
Fig. 1 shows the scheme of the quantitative analysis of sphingolipids using iTRAQ. To expose the primary amine group, lipids were hydrolyzed with SCDase (24, 25). SCDase has an advantage over alkaline hydrolysis (31–33) in removing fatty acid from sphingolipids because the sugar moiety of glycosphingolipids remains intact. The activity of SCDase is enhanced by the addition of detergents, such as sodium taurodeoxycholate or sodium cholate (25). However, common detergents are difficult to remove from the sample solution and hamper MS. We employed PPS, a cleavable detergent that is chromatographically removable after acidic cleavage. Fig. 2 shows the effective concentration of PPS for the hydrolysis of glucosylceramide using SCDase. Hydrolysis was maximum in the presence of 1% PPS.
Fig. 1.
Scheme of quantitative analysis of sphingolipids using iTRAQ after enzymatic hydrolysis.
Fig. 2.
Effective concentration of PPS on glucosylceramide hydrolysis by SCDase. Bovine buttermilk glucosylceramide (2 nmol) was hydrolyzed with 5 mU of SCDase using 0-2% PPS as described in Materials and Methods. The reaction mixture was incubated at 37°C for 16 h. Data represent the means ± SD (n = 3).
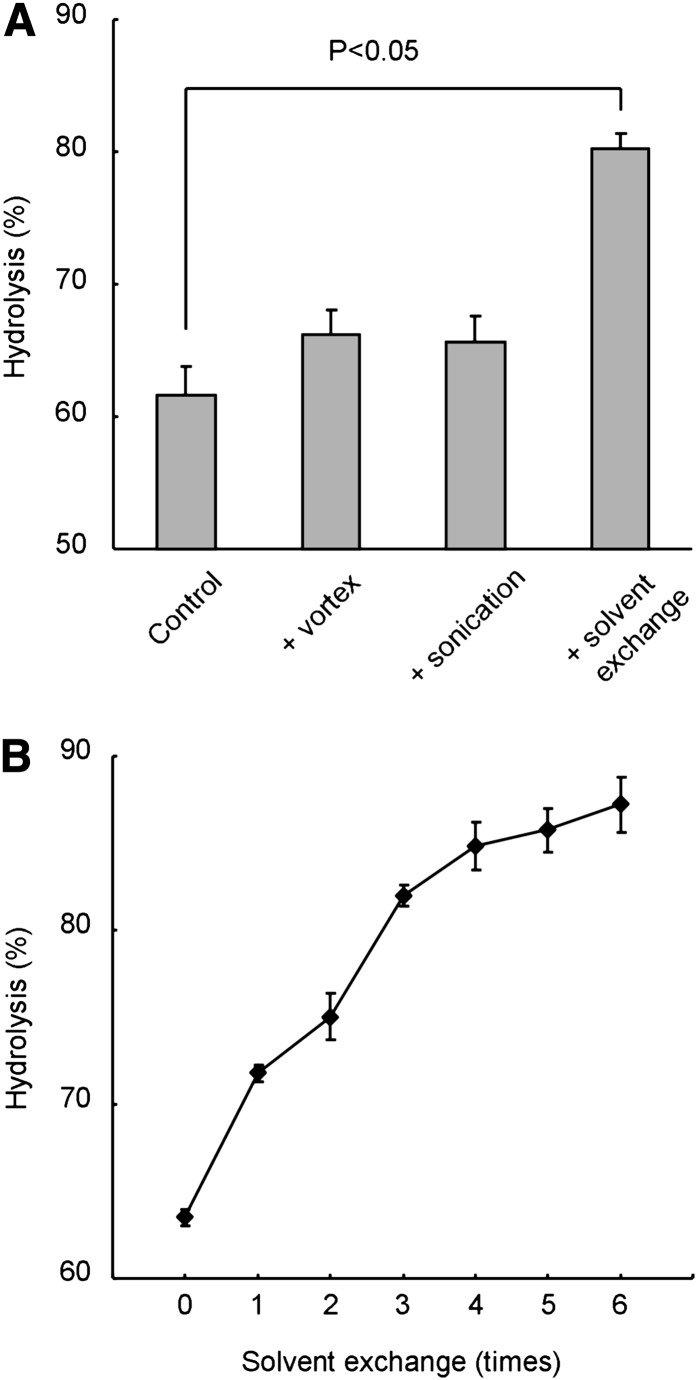
SCDase catalyzes the hydrolysis of the N-acyl linkage in the ceramide moiety as well as the condensation reaction between fatty acids and sphingoid bases (24, 34, 35). An aqueous-organic biphasic system has been used to improve the enzymatic hydrolysis because the condensation reaction is inhibited by the diffusion of fatty acids in the organic phase (25, 36). However, the degree of hydrolysis did not exceed 70% under our experimental conditions (Fig. 2). Thus, we tried to improve the efficiency of the reaction. Fig. 3A shows the effects on hydrolysis of vortex mixing, sonication, and the exchange of the upper organic solvent. Although vortex mixing and sonication did not significantly improve the reaction, exchange of the upper organic solvent greatly increased hydrolysis. As shown in Fig. 3B, multiple-exchange of the upper phase further accelerated hydrolysis. These results indicated that the elimination of free fatty acids facilitates the activity of SCDase.
Fig. 3.
Solvent exchange enhances the SCDase activity. A: Effects of vortex mixing, sonication, and solvent exchange on the glucosylceramide hydrolysis by SCDase. Glucosylceramide (2 nmol) was hydrolyzed with 5 mU of SCDase and 1% PPS. The reaction mixture was incubated at 37°C for 16 h. The solution was subjected twice to vortex mixing or sonication or organic solvent exchange in the middle of incubation. Data represent the mean ± SD (n = 3). B: Hydrolysis of glucosylceramide by SCDase with multiple solvent exchanges. Glucosylceramide (2 nmol) was hydrolyzed with 5 mU of SCDase and 1% PPS. The reaction mixture was incubated at 37°C for 7 h. Upper organic solvent was exchanged at the indicated times every 1 h. Data represent the mean ± average deviation (n = 2).
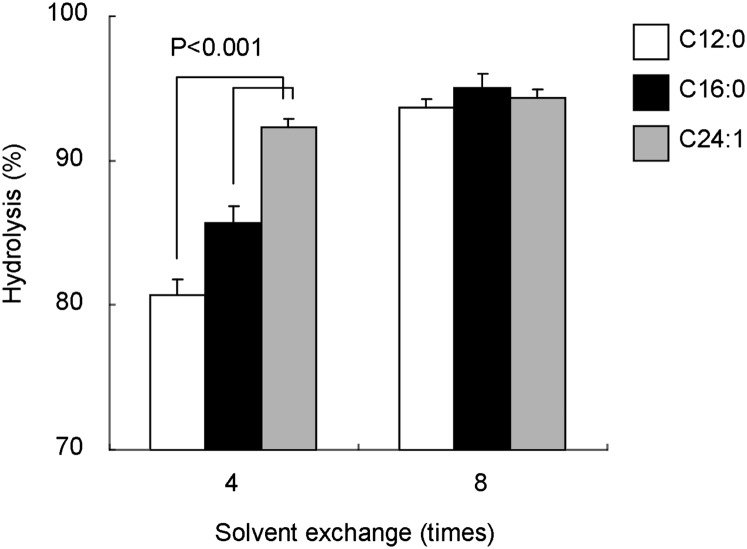
Fig. 4 shows the effect of the fatty acid chain length of glucosylceramide on the hydrolysis efficiency achieved using SCDase. After four times solvent exchange, approximately 80% of the C12:0 glucosylceramide was hydrolyzed, whereas more than 90% of C24:1 glucosylceramide was degraded. However, all of the glucosylceramides tested were hydrolyzed more than 94% after eight times exchange of organic solvent. Thus, the multiple solvent exchanges resulted in almost complete hydrolysis of glucosylceramide irrespective of the fatty acid composition. We then examined the hydrolysis of different sphingolipids using SCDase. Ceramide, glucosylceramide, galactosylceramide, and sphingomyelin were hydrolyzed with SCDase at 37°C for 16 h (Table 2). The solvent was exchanged every 2 h during incubation. Under these conditions, more than 90% of ceramide, glucosylceramide, and galactosyceramide were hydrolyzed, whereas 60% of sphingomyelin became lyso-sphingomyelin. The hydrolysis of glucosylceramide, galactosylceramide and sphingomyelin under our conditions was much more efficient than that of previous results (24). Note that ceramide was very efficiently hydrolyzed in our study whereas SCDase was previously reported to hardly hydrolyze ceramide (24). The efficient hydrolysis which occurred in our study may be due to differences in the detergent and/or the repeated exchange of the organic phase.
Fig. 4.
Effect of fatty acid composition of glucosylceramide on the hydrolysis by SCDase. Two nmol of C12:0 glucosylceramide, C16:0 glucosylceramide, and C24:1 glucosylceramide were hydrolyzed with 5 mU of SCDase and 1% PPS. The reaction mixtures were incubated at 37°C for 16 h. During incubation, organic solvent was exchanged either four times (left) or eight times (right). The hydrolysis was quantitated by TLC as described in Materials and Methods. Data represent the means ± SD (n = 3).
TABLE 2.
Hydrolysis of various sphingolipids by SCDase
| Sphingolipid | Hydrolysis (%) |
|---|---|
| Cer (porcine brain) | 97 ± 4 |
| GlcCer (bovine buttermilk) | 95 ± 2 |
| GalCer (porcine brain) | 94 ± 4 |
| SM (porcine brain) | 60 ± 3 |
Data represent the means ± average deviation (n = 2).
Cer, ceramide; GalCer, galactosylceramide; GlcCer, glucosylceramide; SM, sphingomyelin.
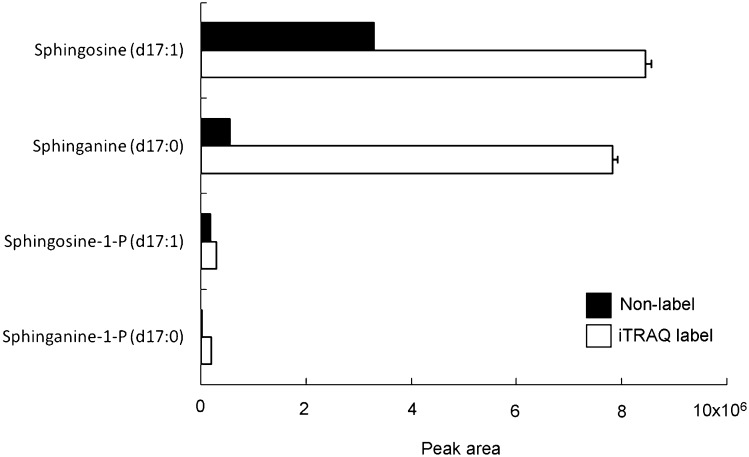
Labeling with iTRAQ changes molecular properties such as mass, polarity, and ionization efficiency. Thus we examined the effect in the labeling of typical sphingoid bases. Cer/Sphingoid Internal Standard Mixture I, containing Sphingosine d17:1, sphinganine d17:0, sphingosine-1-phosphate d17:1, and sphinganine-1-phosphate d17:0, was labeled with an iTRAQ reagent and analyzed in MRM mode. The changes of parameters before and after labeling are summarized in Table 3 and Fig. 5. There were little changes in retention time on the reversed-phase chromatography, while the labeling provided considerable enhancement of sensitivity. Especially, the ratio of peak area of sphinganine dramatically increased. Because of the lack of double bond, ionization efficiency of sphinganine is lower than that of sphingosine. As a result, the sensitivity of MS to sphinganine in the positive ion mode is low. It is speculated that the introduction of two nitrogen atoms of iTRAQ reagent to sphinganine significantly enhanced the sensitivity by increasing the affinity of the molecule to proton.
TABLE 3.
Effect of iTRAQ labeling of sphingoid bases on parameters of mass spectrometry
| Retention Time (min) |
Ratio of Peak Area | |||
|---|---|---|---|---|
| Nonlabel | iTRAQ label | Δ | (iTRAQ/Non) | |
| So (d17:1) | 3.01 | 2.83 | −0.18 | 2.6 ± 0.1 |
| Sa (d17:0) | 3.43 | 3.42 | −0.01 | 14.4 ± 0.4 |
| S1P (d17:1) | 3.60 | 3.39 | −0.21 | 1.6 ± 0.1 |
| Sa1P (d17:0) | 3.89 | 3.87 | −0.03 | 7.6 ± 0.3 |
Data represent the means ± SD (n = 3).
S1P, sphingosine 1-phosphate; Sa, sphinganine; Sa1P, sphinganine 1-phosphate; So, sphingosine.
Fig. 5.
The peak areas of nonlabeled and iTRAQ-labeled sphingolipid bases. Lipids are analyzed as described in Materials and Methods. Data represent the means ± SD (n = 3).
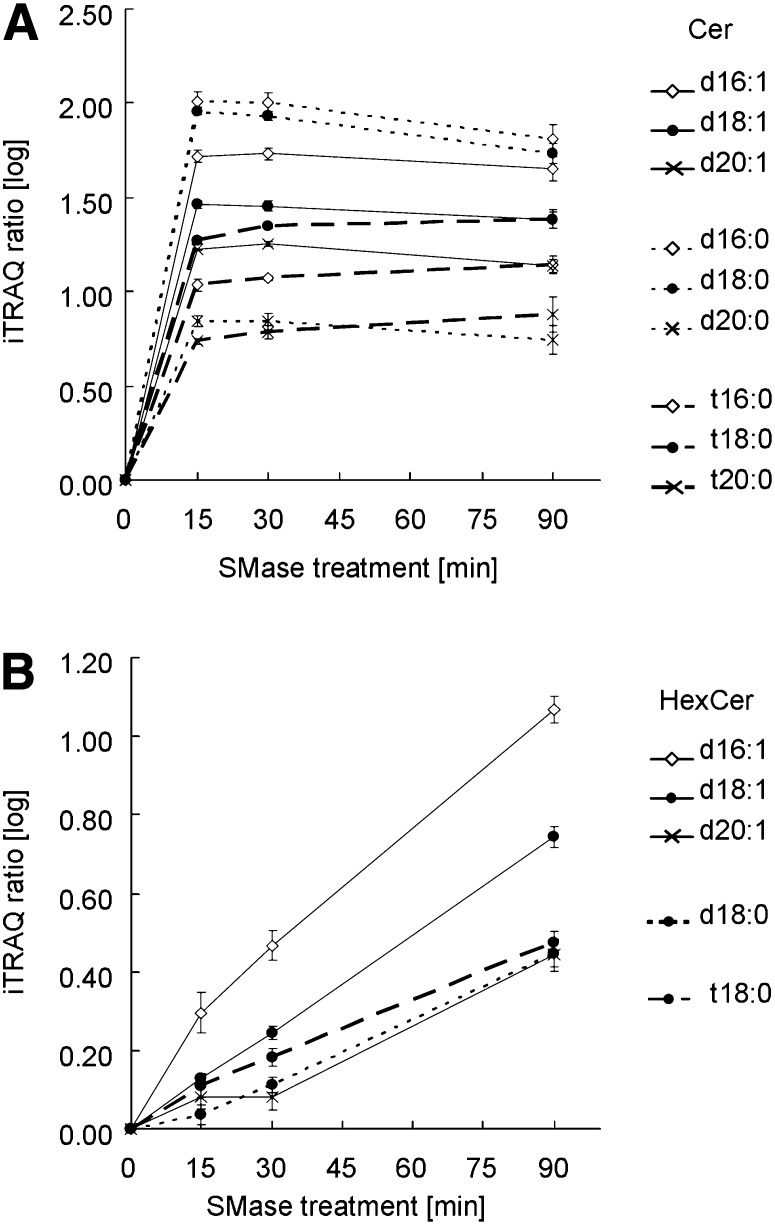
Sphingomyelin is enriched in the outer leaflet of the plasma membrane (30) and is cleaved to ceramide by adding SMase to the medium. We applied the established method to the profiling of ceramides and monohexosylcermides in SMase-treated MDCK cells (Fig. 6) . Lipids were extracted from cells and separated from free sphingoid base by means of a Si column. The samples (0, 15, 30, and 90 min) were hydrolyzed with SCDase and labeled with four different iTRAQ reagents. The labeled lipids were combined and applied to MS. We identified nine ceramides and five monohexosylceramides, containing dihydroceramide and phytoceramide, with three different chain-length sphingoid bases. The relative peak areas of these ceramides are summarized in Table 4. This method could detect minor sphingoid species, such as d20:0 dihydroceramide and t16:0 and t20:0 phytoceramides. The temporal profiles based on ratiometric quantification of iTRAQ revealed a rapid increase in ceramides (Fig. 6A) followed by an increase in monohexosylceramides (Fig. 6B). The peak areas of the monohexosylceramides are summarized in Table 5. Fig. 6 suggests that the increase in hexosylceramides is secondarily derived from the rapid change in ceramides, as previously described (37–39). The ceramide profile indicates that the kinetics of ceramide formation depend on the structure of the sphingoid base; i.e., ceramides and dihydroceramides rapidly increased within 15 min, followed by a gradual decrease. In contrast, phytoceramides continued to slowly increase after 15 min incubation.
Fig. 6.
The profiles of ceramides and hexocylceramides during SMase treatment of MDCK cells. Temporal profiles of ceramides and hexocylceramides were detected by iTRAQ analysis after SCDase hydrolysis of samples prepared at time points 0, 15, 30, and 90 min after SMase treatment of MDCK cells. (A) and (B) show the profiles of ceramides and hexocylceramides, respectively. The continuous, dotted, and dashed lines stand for ceramide, dihydroceramide, and phytoceramide, respectively. The ◇, •, and × stand for different sphingoid base chain lengths. Data represent the mean ± SD (n = 4).
TABLE 4.
Relative peak areas of different ceramides during SMase treatment
| SMase Treatment (min) |
||||
|---|---|---|---|---|
| 0 | 15 | 30 | 90 | |
| % | % | % | % | |
| Ceramide | ||||
| d16:1 | 4.8 | 6.3 | 6.6 | 6.5 |
| d18:1 | 81.4 | 78.4 | 77.9 | 79.4 |
| d20:1 | 3.0 | 2.0 | 2.1 | 1.9 |
| Dihydroceramide | ||||
| d16:0 | 0.5 | 0.8 | 0.8 | 0.6 |
| d18:0 | 5.7 | 9.5 | 9.1 | 7.0 |
| d20:0 | 0.3 | 0.1 | 0.1 | 0.1 |
| Phytoceramide | ||||
| t16:0 | 0.2 | 0.1 | 0.1 | 0.1 |
| t18:0 | 3.8 | 2.8 | 3.3 | 4.2 |
| t20:0 | 0.4 | 0.1 | 0.1 | 0.2 |
TABLE 5.
Relative peak areas of different monohexosylceramides during SMase treatment
| SMase Treatment (min) |
||||
|---|---|---|---|---|
| 0 | 15 | 30 | 90 | |
| % | % | % | % | |
| Monohexosylceramide | ||||
| d16:1 | 0.6 | 0.9 | 1.1 | 1.3 |
| d18:1 | 90.4 | 91.0 | 92.1 | 93.9 |
| d20:1 | 1.7 | 1.4 | 1.2 | 0.9 |
| Monohexosyldihydroceramide | ||||
| d18:0 | 4.0 | 3.4 | 3.4 | 2.2 |
| Monohexosylphytoceramide | ||||
| t18:0 | 3.2 | 2.2 | 2.2 | 1.7 |
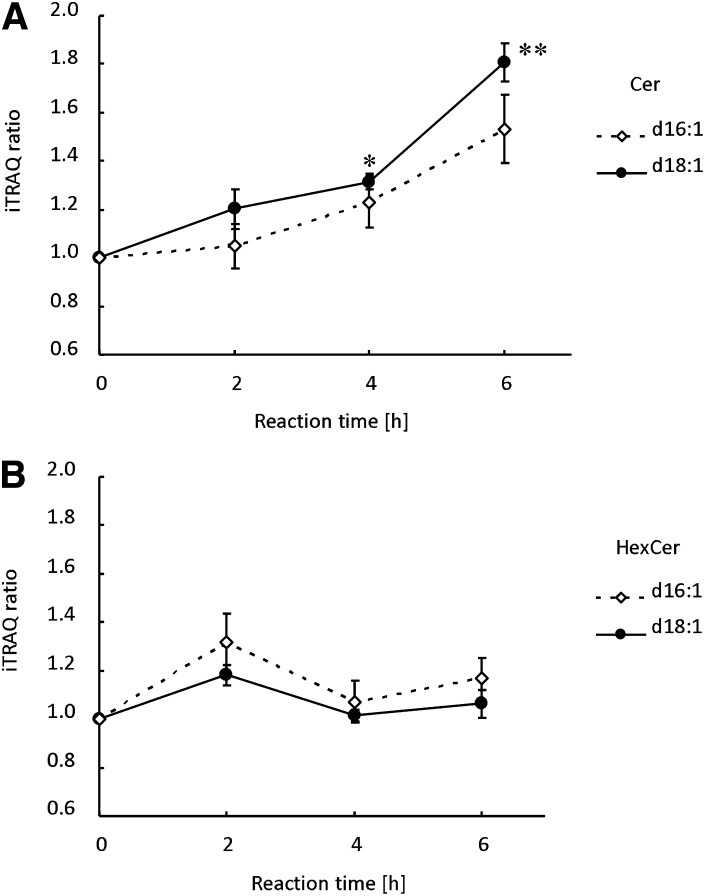
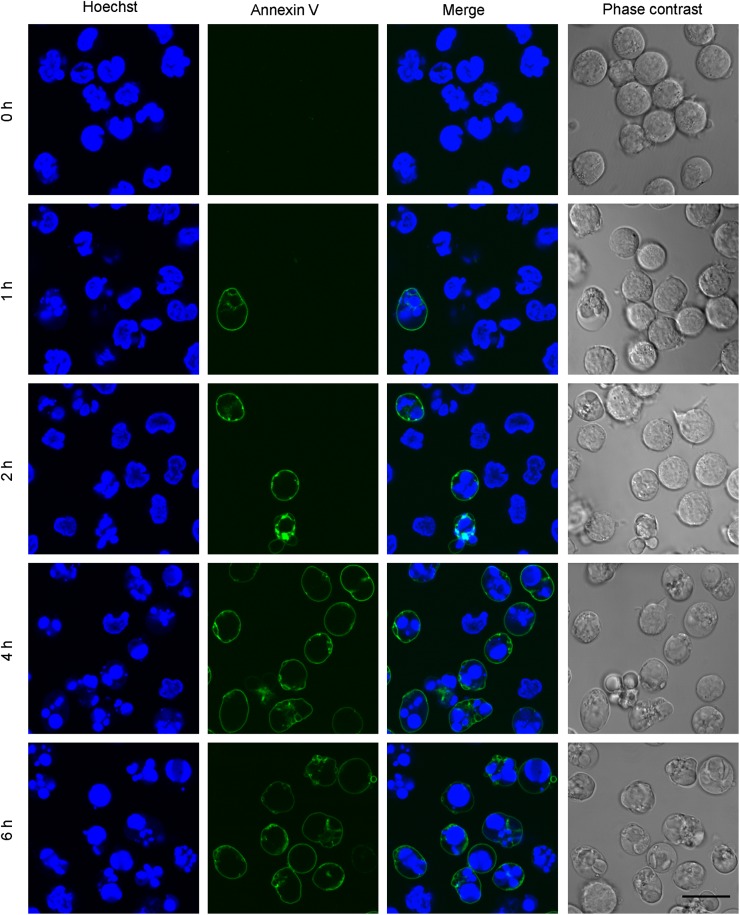
Fas (CD95) engagement by Fas ligand has a crucial function in the apoptotic elimination of T cells undergoing environmental trauma (40). The increase of ceramides during Fas-induced apoptosis is a matter of debate (41–44). Fig. 7 shows the increase of ceramides and hexosylceramides during anti-Fas antibody-induced apoptosis of Jurkat T cells. Apoptosis was monitored by measuring the fragmentation of the nucleus and the exposure of phosphatidylserine to the cell surface, as monitored by the binding of Alexa Fluor 488-conjugated Annexin V (45) (Fig. 8). Fragmentation of the nucleus and the exposure of phosphatidylserine were observed 1 h after the addition of the anti-Fas antibody, and most of the cells became annexin V-positive after 4 h incubation. Fig. 7A indicates the time-dependent increase in ceramides. This result is consistent with previous results using HPLC (42) and a diacylglycerol kinase method (43) (44). In contrast to ceramides, the content of hexosylceramides was not significantly altered during apoptosis, as previously observed (44) (Fig. 7B).
Fig. 7.
The profiles of ceramides (A) and hexosylceramides (B) during anti-Fas antibody-induced apoptosis of Jurkat cells. Temporal profiles of ceramides and hexocylceramides were detected as described in Fig. 6. Data represent the mean ± SD (n = 4). **P < 0.01, *P < 0.02.
Fig. 8.
Hoechst 33342 and Annexin V labeling of Jurkat cells during anti-Fas antibody-induced apoptosis of Jurkat cells. Labeling with Hoechst 33342 and Alexa Fluor 488-conjugated Annexin V was performed as described in Materials and Methods. Fluorescence images were acquired at indicated time points. Bar, 20 μm.
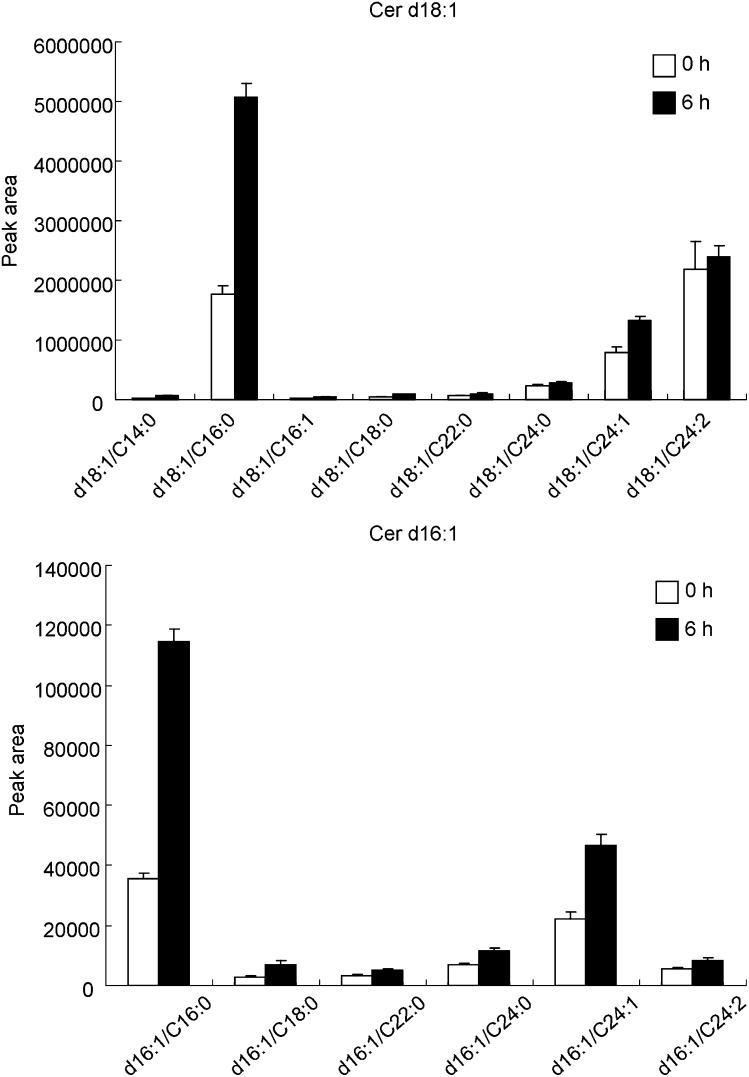
One of the drawbacks of using iTRAQ to analyze sphingolipids is that fatty acid profiles cannot be obtained. Recent results suggest that ceramides with different fatty acid chain lengths might have distinct functions (46, 47). Fig. 9 shows the relative amount of the various ceramide molecular species at time 0 and 6 h after anti-Fas treatment. Fig. 9 depicts a significant increase in the d18:1/C16:0, d16:1/C16:0 and d16:1/C24:1 ceramides, but not the d18:1/C24:2 ceramides, during anti-Fas-induced apoptosis in Jurkat cells. These results indicate that the combination of iTRAQ and molecular species analysis is able to provide a quantitative and detailed profile of ceramide metabolism that is crucial for understanding the complex physiological roles of ceramides.
Fig. 9.
The profiles of ceramide molecular species during anti-Fas antibody-induced apoptosis of Jurkat cells. MRM data were obtained as described in Materials and Methods. Data represent the mean ± SD (n = 4).
In this study, we report a new application of the iTRAQ technique to the quantitative analysis of ceramides and monohexosylceramides after hydrolysis with SCDase. iTRAQ allows simultaneous measurement of up to eight samples, and it dramatically reduces measurement time. Moreover, iTRAQ enables the accurate profiling of lipids, even if abundance is low. This study represents the first application of iTRAQ to analyze sphingolipid metabolism.
In addition to the heterogeneity of fatty acids, ceramides contain various sphingoid bases. The physiological significance of different sphingoid bases in ceramides and other sphingolipids has been reported. The major sphingoid bases of mammalian cells are sphingosine and dihydrosphingosine. In contrast to sphingosine-conjugated ceramides, dihydroceramides (which contain dihydrosphingosine) do not induce apoptosis (6, 48–50). Phytosphingosine-based sphingolipids are also observed in skin, intestine, and kidney (51–53). Although the importance of phyto-type sphingolipids in these cells is recognized (54, 55) (e.g., synthetic phytoceramides are more cytotoxic than ceramides (56)), the precise role of the lipids remains unsolved. The function of the different chain lengths of sphingoid bases is also not clear. Recent study indicates that serine palmitoyltransferase containing subunit SPTLC3 generates short chain sphingoid bases (57). However, the role of short chain sphingolipids is not known. Our method is applicable to study the detailed profiles of ceramides and monohexosylceramides with minor sphingoid bases.
Furthermore, iTRAQ can be used to directly analyze endogenous sphingoid bases, such as sphingosine, S1P, and other atypical sphingoid bases, without needing previous enzymatic reaction. Although the enzymatic procedure requires additional steps, each step is simple, and multiplex analysis of labeled samples provides minimal experimental error. Such analysis will help to carry out a detailed kinetic analysis of endogenous sphingolipids under physiological conditions. In addition, iTRAQ can be used as a precise tool for analyzing the kinetics of lysoglycosphingolipid formation in lysosomal storage disorders (58, 59).
Acknowledgments
The authors appreciate the RIKEN molecular characterization team for its support on mass spectrometry. We thank Reiko Ishitsuka, Takuma Kishimoto, and Motohide Murate for critical reading of the manuscript, and Peter Greimel for data analysis. The authors are grateful to Yoko Ohashi for her advice and encouragement throughout this work.
Footnotes
Abbreviations:
- MDCK
- Madin Darby canine kidney
- MRM
- multiple reaction monitoring
- PPS
- 3-[3-(1,1-bisalkyloxyethyl)pyridine-1-yl]propane-1-sulfonate
- SCDase
- sphingolipid ceramide N-deacylase
- SMase
- sphingomyelinase
- iTRAQ
- isobaric tags for relative and absolute quantitation
This work was supported by the Lipid Dynamics Program of RIKEN and the Grants-in Aid for Scientific Research 21113530 and 22390018 (T.K.) from the Ministry of Education, Culture, Sports, Science and Technology of Japan.
REFERENCES
- 1.Futerman A. H., Hannun Y. A. 2004. The complex life of simple sphingolipids. EMBO Rep. 5: 777–782. [DOI] [PMC free article] [PubMed] [Google Scholar]
- 2.Hanada K., Kumagai K., Yasuda S., Miura Y., Kawano M., Fukasawa M., Nishijima M. 2003. Molecular machinery for non-vesicular trafficking of ceramide. Nature. 426: 803–809. [DOI] [PubMed] [Google Scholar]
- 3.Okazaki T., Bell R. M., Hannun Y. A. 1989. Sphingomyelin turnover induced by vitamin D3 in HL-60 cells. Role in cell differentiation. J. Biol. Chem. 264: 19076–19080. [PubMed] [Google Scholar]
- 4.Venable M. E., Lee J. Y., Smyth M. J., Bielawska A., Obeid L. M. 1995. Role of ceramide in cellular senescence. J. Biol. Chem. 270: 30701–30708. [DOI] [PubMed] [Google Scholar]
- 5.Adam D., Heinrich M., Kabelitz D., Schutze S. 2002. Ceramide: does it matter for T cells? Trends Immunol. 23: 1–4. [DOI] [PubMed] [Google Scholar]
- 6.Obeid L. M., Linardic C. M., Karolak L. A., Hannun Y. A. 1993. Programmed cell death induced by ceramide. Science. 259: 1769–1771. [DOI] [PubMed] [Google Scholar]
- 7.Stancevic B., Kolesnick R. 2010. Ceramide-rich platforms in transmembrane signaling. FEBS Lett. 584: 1728–1740. [DOI] [PMC free article] [PubMed] [Google Scholar]
- 8.Vieu C., Terce F., Chevy F., Rolland C., Barbaras R., Chap H., Wolf C., Perret B., Collet X. 2002. Coupled assay of sphingomyelin and ceramide molecular species by gas liquid chromatography. J. Lipid Res. 43: 510–522. [PubMed] [Google Scholar]
- 9.Snada S., Uchida Y., Anraku Y., Izawa A., Iwamori M., Nagai Y. 1987. Analysis of ceramide and monohexaosyl glycolipid derivatives by high-performance liquid chromatography and its application to the determination of the molecular species in tissues. J. Chromatogr. A. 400: 223–231. [DOI] [PubMed] [Google Scholar]
- 10.Previati M., Bertolaso L., Tramarin M., Bertagnolo V., Capitani S. 1996. Low nanogram range quantitation of diglycerides and ceramide by high-performance liquid chromatography. Anal. Biochem. 233: 108–114. [DOI] [PubMed] [Google Scholar]
- 11.Yano M., Kishida E., Muneyuki Y., Masuzawa Y. 1998. Quantitative analysis of ceramide molecular species by high performance liquid chromatography. J. Lipid Res. 39: 2091–2098. [PubMed] [Google Scholar]
- 12.Bielawska A., Perry D. K., Hannun Y. A. 2001. Determination of ceramides and diglycerides by the diglyceride kinase assay. Anal. Biochem. 298: 141–150. [DOI] [PubMed] [Google Scholar]
- 13.Han X. 2002. Characterization and direct quantitation of ceramide molecular species from lipid extracts of biological samples by electrospray ionization tandem mass spectrometry. Anal. Biochem. 302: 199–212. [DOI] [PubMed] [Google Scholar]
- 14.Yamane M. 2003. Simultaneous quantitative determination method for ceramide species from crude cellular extracts by high-performance liquid chromatography-thermospray mass spectrometry. J. Chromatogr. B Analyt. Technol. Biomed. Life Sci. 783: 181–190. [DOI] [PubMed] [Google Scholar]
- 15.Pettus B. J., Kroesen B. J., Szulc Z. M., Bielawska A., Bielawski J., Hannun Y. A., Busman M. 2004. Quantitative measurement of different ceramide species from crude cellular extracts by normal-phase high-performance liquid chromatography coupled to atmospheric pressure ionization mass spectrometry. Rapid Commun. Mass Spectrom. 18: 577–583. [DOI] [PubMed] [Google Scholar]
- 16.Masukawa Y., Tsujimura H., Narita H. 2006. Liquid chromatography-mass spectrometry for comprehensive profiling of ceramide molecules in human hair. J. Lipid Res. 47: 1559–1571. [DOI] [PubMed] [Google Scholar]
- 17.Kasumov T., Huang H., Chung Y. M., Zhang R., McCullough A. J., Kirwan J. P. 2010. Quantification of ceramide species in biological samples by liquid chromatography electrospray ionization tandem mass spectrometry. Anal. Biochem. 401: 154–161. [DOI] [PMC free article] [PubMed] [Google Scholar]
- 18.Scherer M., Leuthauser-Jaschinski K., Ecker J., Schmitz G., Liebisch G. 2010. A rapid and quantitative LC-MS/MS method to profile sphingolipids. J. Lipid Res. 51: 2001–2011. [DOI] [PMC free article] [PubMed] [Google Scholar]
- 19.Ross P. L., Huang Y. N., Marchese J. N., Williamson B., Parker K., Hattan S., Khainovski N., Pillai S., Dey S., Daniels S., et al. 2004. Multiplexed protein quantitation in Saccharomyces cerevisiae using amine-reactive isobaric tagging reagents. Mol. Cell. Proteomics. 3: 1154–1169. [DOI] [PubMed] [Google Scholar]
- 20.Unwin R. D., Griffiths J. R., Whetton A. D. 2010. Simultaneous analysis of relative protein expression levels across multiple samples using iTRAQ isobaric tags with 2D nano LC-MS/MS. Nat. Protoc. 5: 1574–1582. [DOI] [PubMed] [Google Scholar]
- 21.Zieske L. R. 2006. A perspective on the use of iTRAQ reagent technology for protein complex and profiling studies. J. Exp. Bot. 57: 1501–1508. [DOI] [PubMed] [Google Scholar]
- 22.Wiese S., Reidegeld K. A., Meyer H. E., Warscheid B. 2007. Protein labeling by iTRAQ: a new tool for quantitative mass spectrometry in proteome research. Proteomics. 7: 340–350. [DOI] [PubMed] [Google Scholar]
- 23.Berry K. A., Murphy R. C. 2005. Analysis of cell membrane aminophospholipids as isotope-tagged derivatives. J. Lipid Res. 46: 1038–1046. [DOI] [PubMed] [Google Scholar]
- 24.Ito M., Kurita T., Kita K. 1995. A novel enzyme that cleaves the N-acyl linkage of ceramides in various glycosphingolipids as well as sphingomyelin to produce their lyso forms. J. Biol. Chem. 270: 24370–24374. [DOI] [PubMed] [Google Scholar]
- 25.Kurita T., Izu H., Sano M., Ito M., Kato I. 2000. Enhancement of hydrolytic activity of sphingolipid ceramide N-deacylase in the aqueous-organic biphasic system. J. Lipid Res. 41: 846–851. [PubMed] [Google Scholar]
- 26.Shaner R. L., Allegood J. C., Park H., Wang E., Kelly S., Haynes C. A., Sullards M. C., Merrill A. H., Jr 2009. Quantitative analysis of sphingolipids for lipidomics using triple quadrupole and quadrupole linear ion trap mass spectrometers. J. Lipid Res. 50: 1692–1707. [DOI] [PMC free article] [PubMed] [Google Scholar]
- 27.Shadforth I. P., Dunkley T. P., Lilley K. S., Bessant C. 2005. i-Tracker: for quantitative proteomics using iTRAQ. BMC Genomics. 6: 145. [DOI] [PMC free article] [PubMed] [Google Scholar]
- 28.Fiedler K., Kobayashi T., Kurzchalia T. V., Simons K. 1993. Glycosphingolipid-enriched, detergent-insoluble complexes in protein sorting in epithelial cells. Biochemistry. 32: 6365–6373. [DOI] [PubMed] [Google Scholar]
- 29.Bligh E. G., Dyer W. J. 1959. A rapid method of total lipid extraction and purification. Can. J. Biochem. Physiol. 37: 911–917. [DOI] [PubMed] [Google Scholar]
- 30.Kiyokawa E., Baba T., Otsuka N., Makino A., Ohno S., Kobayashi T. 2005. Spatial and functional heterogeneity of sphingolipid-rich membrane domains. J. Biol. Chem. 280: 24072–24084. [DOI] [PubMed] [Google Scholar]
- 31.Neuenhofer S., Schwarzmann G., Egge H., Sandhoff K. 1985. Synthesis of lysogangliosides. Biochemistry. 24: 525–532. [DOI] [PubMed] [Google Scholar]
- 32.Nores G. A., Hanai N., Levery S. B., Eaton H. L., Salyan E. K., Hakomori S. 1988. Synthesis and characterization of lyso-GM3 (II3Neu5Ac Lactosyl sphingosine), de-N-acetyl-GM3 (II3NeuNH2 lactosyl Cer), and related compounds. Carbohydr. Res. 179: 393–410. [DOI] [PubMed] [Google Scholar]
- 33.Taketomi T., Hara A., Uemura K., Sugiyama E. 1996. Rapid method of preparation of lysoglycosphingolipids and their confirmation by delayed extraction matrix-assisted laser desorption ionization time-of-flight mass spectrometry. J. Biochem. 120: 573–579. [DOI] [PubMed] [Google Scholar]
- 34.Mitsutake S., Kita K., Nakagawa T., Ito M. 1998. Enzymatic synthesis of 14C-glycosphingolipids by reverse hydrolysis reaction of sphingolipid ceramide N-deacylase: detection of endoglycoceramidase activity in a seaflower. J. Biochem. 123: 859–863. [DOI] [PubMed] [Google Scholar]
- 35.Mitsutake S., Kita K., Okino N., Ito M. 1997. [14C]ceramide synthesis by sphingolipid ceramide N-deacylase: new assay for ceramidase activity detection. Anal. Biochem. 247: 52–57. [DOI] [PubMed] [Google Scholar]
- 36.Klibanov A., Samokhin G. P., Martinek K., Berezin I. V. 1977. A new approach to preparative enzymatic synthesis. Biotechnol. Bioeng. 19: 1351–1361. [DOI] [PubMed] [Google Scholar]
- 37.Abe A., Radin N. S., Shayman J. A. 1996. Induction of glucosylceramide synthase by synthase inhibitors and ceramide. Biochim. Biophys. Acta. 1299: 333–341. [DOI] [PubMed] [Google Scholar]
- 38.Komori H., Ichikawa S., Hirabayashi Y., Ito M. 2000. Regulation of UDP-glucose:ceramide glucosyltransferase-1 by ceramide. FEBS Lett. 475: 247–250. [DOI] [PubMed] [Google Scholar]
- 39.Liu Y. Y., Yu J. Y., Yin D., Patwardhan G. A., Gupta V., Hirabayashi Y., Holleran W. M., Giuliano A. E., Jazwinski S. M., Gouaze-Andersson V., et al. 2008. A role for ceramide in driving cancer cell resistance to doxorubicin. FASEB J. 22: 2541–2551. [DOI] [PubMed] [Google Scholar]
- 40.Reap E. A., Roof K., Maynor K., Borrero M., Booker J., Cohen P. L. 1997. Radiation and stress-induced apoptosis: a role for Fas/Fas ligand interactions. Proc. Natl. Acad. Sci. USA. 94: 5750–5755. [DOI] [PMC free article] [PubMed] [Google Scholar]
- 41.Watts J. D., Gu M., Polverino A. J., Patterson S. D., Aebersold R. 1997. Fas-induced apoptosis of T cells occurs independently of ceramide generation. Proc. Natl. Acad. Sci. USA. 94: 7292–7296. [DOI] [PMC free article] [PubMed] [Google Scholar]
- 42.Rodriguez-Lafrasse C., Alphonse G., Broquet P., Aloy M. T., Louisot P., Rousson R. 2001. Temporal relationships between ceramide production, caspase activation and mitochondrial dysfunction in cell lines with varying sensitivity to anti-Fas-induced apoptosis. Biochem. J. 357: 407–416. [DOI] [PMC free article] [PubMed] [Google Scholar]
- 43.Watanabe M., Kitano T., Kondo T., Yabu T., Taguchi Y., Tashima M., Umehara H., Domae N., Uchiyama T., Okazaki T. 2004. Increase of nuclear ceramide through caspase-3-dependent regulation of the “sphingomyelin cycle” in Fas-induced apoptosis. Cancer Res. 64: 1000–1007. [DOI] [PubMed] [Google Scholar]
- 44.Lafont E., Milhas D., Carpentier S., Garcia V., Jin Z. X., Umehara H., Okazaki T., Schulze-Osthoff K., Levade T., Benoist H., et al. 2010. Caspase-mediated inhibition of sphingomyelin synthesis is involved in FasL-triggered cell death. Cell Death Differ. 17: 642–654. [DOI] [PubMed] [Google Scholar]
- 45.Makino A., Baba T., Fujimoto K., Iwamoto K., Yano Y., Terada N., Ohno S., Sato S. B., Ohta A., Umeda M., et al. 2003. Cinnamycin (Ro 09-0198) promotes cell binding and toxicity by inducing transbilayer lipid movement. J. Biol. Chem. 278: 3204–3209. [DOI] [PubMed] [Google Scholar]
- 46.Senkal C. E., Ponnusamy S., Bielawski J., Hannun Y. A., Ogretmen B. 2010. Antiapoptotic roles of ceramide-synthase-6-generated C16-ceramide via selective regulation of the ATF6/CHOP arm of ER-stress-response pathways. FASEB J. 24: 296–308. [DOI] [PMC free article] [PubMed] [Google Scholar]
- 47.Mullen T. D., Spassieva S., Jenkins R. W., Kitatani K., Bielawski J., Hannun Y. A., Obeid L. M. 2010. Selective knockdown of ceramide synthases reveals complex interregulation of sphingolipid metabolism. J. Lipid Res. 52: 68–77. [DOI] [PMC free article] [PubMed] [Google Scholar]
- 48.Bielawska A., Crane H. M., Liotta D., Obeid L. M., Hannun Y. A. 1993. Selectivity of ceramide-mediated biology. Lack of activity of erythro-dihydroceramide. J. Biol. Chem. 268: 26226–26232. [PubMed] [Google Scholar]
- 49.Jarvis W. D., Fornari F. A., Traylor R. S., Martin H. A., Kramer L. B., Erukulla R. K., Bittman R., Grant S. 1996. Induction of apoptosis and potentiation of ceramide-mediated cytotoxicity by sphingoid bases in human myeloid leukemia cells. J. Biol. Chem. 271: 8275–8284. [DOI] [PubMed] [Google Scholar]
- 50.Hartfield P. J., Mayne G. C., Murray A. W. 1997. Ceramide induces apoptosis in PC12 cells. FEBS Lett. 401: 148–152. [DOI] [PubMed] [Google Scholar]
- 51.Okabe K., Keenan R. W., Schmidt G. 1968. Phytosphingosine groups as quantitatively significant components of the sphingolipids of the mucosa of the small intestines of some mammalian species. Biochem. Biophys. Res. Commun. 31: 137–143. [DOI] [PubMed] [Google Scholar]
- 52.Iwamori M., Costello C., Moser H. W. 1979. Analysis and quantitation of free ceramide containing nonhydroxy and 2-hydroxy fatty acids, and phytosphingosine by high-performance liquid chromatography. J. Lipid Res. 20: 86–96. [PubMed] [Google Scholar]
- 53.Coderch L., Lopez O., de la Maza A., Parra J. L. 2003. Ceramides and skin function. Am. J. Clin. Dermatol. 4: 107–129. [DOI] [PubMed] [Google Scholar]
- 54.Motta S., Monti M., Sesana S., Caputo R., Carelli S., Ghidoni R. 1993. Ceramide composition of the psoriatic scale. Biochim. Biophys. Acta. 1182: 147–151. [DOI] [PubMed] [Google Scholar]
- 55.Macheleidt O., Kaiser H. W., Sandhoff K. 2002. Deficiency of epidermal protein-bound omega-hydroxyceramides in atopic dermatitis. J. Invest. Dermatol. 119: 166–173. [DOI] [PubMed] [Google Scholar]
- 56.Hwang O., Kim G., Jang Y. J., Kim S. W., Choi G., Choi H. J., Jeon S. Y., Lee D. G., Lee J. D. 2001. Synthetic phytoceramides induce apoptosis with higher potency than ceramides. Mol. Pharmacol. 59: 1249–1255. [DOI] [PubMed] [Google Scholar]
- 57.Hornemann T., Penno A., Rutti M. F., Ernst D., Kivrak-Pfiffner F., Rohrer L., von Eckardstein A. 2009. The SPTLC3 subunit of serine palmitoyltransferase generates short chain sphingoid bases. J. Biol. Chem. 284: 26322–26330. [DOI] [PMC free article] [PubMed] [Google Scholar]
- 58.Futerman A. H., van Meer G. 2004. The cell biology of lysosomal storage disorders. Nat. Rev. Mol. Cell Biol. 5: 554–565. [DOI] [PubMed] [Google Scholar]
- 59.Li Y. T., Li S. C., Buck W. R., Haskins M. E., Wu S. W., Khoo K. H., Sidransky E., Bunnell B. A. Selective extraction and effective separation of galactosylsphingosine (psychosine) and glucosylsphingosine from other glycosphingolipids in pathological tissue samples. Neurochem. Res. Epub ahead of print. December 7, 2010; doi:10.1007/s11064-010-0348-3. [DOI] [PMC free article] [PubMed] [Google Scholar]


