

Summary
Mutations in the Plasmodium falciparum chloroquine (CQ) resistance transporter (PfCRT), are major determinants of verapamil (VP)-reversible CQ resistance (CQR). In the presence of mutant PfCRT, additional genes contribute to the wide range of CQ susceptibilities observed. It is not known if these genes influence mechanisms of chemosensitization by CQR reversal agents. Using quantitative trait locus (QTL) mapping of progeny clones from the HB3 × Dd2 cross, we show that the P. falciparum multidrug resistance gene 1 (pfmdr1) interacts with the Southeast Asia-derived mutant pfcrt haplotype to modulate CQR levels. A novel chromosome 7 locus is predicted to contribute with the pfcrt and pfmdr1 loci to influence CQR levels. Chemoreversal via a wide range of chemical structures operates through a direct pfcrt-based mechanism. Direct inhibition of parasite growth by these reversal agents is influenced by pfcrt mutations and additional loci. Direct labeling of purified recombinant PfMDR1 protein with a highly specific photoaffinity CQ analogue, and lack of competition for photolabeling by VP, supports our QTL predictions. We find no evidence that pfmdr1 copy number affects CQ response in the progeny, however, inheritance patterns indicate that an allele-specific interaction between pfmdr1 and pfcrt is part of the complex genetic background of CQR.
Keywords: QTL, malaria, PfMDR1, PfCRT, drug resistance, copy number
Introduction
Efforts against Plasmodium falciparum are hampered by the evolution and worldwide spread of decreasing parasite susceptibility to an array of anti-malarial compounds, including the near global failure of the former mainstay drug, chloroquine (CQ) (Ginsburg, 2005). Extensive field and laboratory research on CQ resistance (CQR) identified the crucial role of a gene on chromosome (chr) 7, the P. falciparum CQR transporter (pfcrt), that encodes a putative transporter with channel like properties, localized to the digestive vacuole membrane in erythrocytic stage parasites (Cooper et al., 2002; Fidock et al., 2000; Martin et al., 2009; Paguio et al., 2009; Sidhu et al., 2002; Su et al., 1997; Wellems et al., 1991; Zhang et al., 2004). A K76T change is ubiquitous in CQ resistant populations worldwide and is a reliable molecular marker of CQR (Best Plummer et al., 2004; Chen et al., 2003; Djimde et al., 2001; Durrand et al., 2004; Plowe, 2003; Wootton et al., 2002).
Drug pressure in the laboratory to select mutant CQ resistant parasite lines has been successful in only one CQ sensitive (CQS) parasite line, 106/1 (Cooper et al., 2002), which is unique in harboring six of the seven PfCRT mutations characteristic of Southeast Asian CQ resistant parasites, lacking only the critical K76T (Su et al., 1997). Attempts to select for CQR using other CQS parasite lines have failed (Lim and Cowman, 1996). In other experiments, the wild-type PfCRT allele of GC03, a CQS progeny clone of the HB3 × Dd2 genetic cross with a haplotype of CMNKAQNIR at amino acid positions 72, 74, 75, 76, 220, 271, 326, 356, and 371, was replaced with three unique CQ resistant haplotypes: CIETSESTI (Dd2), CIEISESII (106/176I), and SMNTSQDLR (7G8) by homologous recombination (Sidhu et al., 2002). Each of these replacements conferred a distinct CQR phenotype in GC03 (Lakshmanan et al., 2005; Sidhu et al., 2002). Collectively, these studies underscore the major role of amino acid 76 in CQR, but also indicate an important role for additional factors in the genetic background of the key PfCRT mutation.
The suggestion that multiple genetic factors underpin CQR was raised more than 20 years ago, well before the identification of pfcrt (Foote et al., 1990). A strong but incomplete association of mutations in pfmdr1, a gene encoding a P-glycoprotein homologue (Pgp) of the human multidrug resistant (MDR) efflux pump (McGrath et al., 1989; Shen et al., 1986), with CQR in field isolates (Foote et al., 1990), combined with the observation that pfmdr1 mutations were not linked with CQS or CQ resistant progeny of the HB3 × Dd2 cross (Wellems et al., 1990), spurred a lasting debate about this gene’s role in the mechanism and evolution of CQR (Bray et al., 1998; Krogstad et al., 1987; Orjih et al., 1994; Sanchez et al., 2003; Sanchez et al., 2005; Yayon et al., 1984). This incongruity led to the suggestion that some CQS parasites may be competent to become CQ resistant with the acquisition of additional mutation(s) (Foote et al., 1990). Pfmdr1 point mutations have been associated with CQR (Foote et al., 1989; Foote et al., 1990; Mu et al., 2003; Wilson et al., 1989), however these associations vary geographically, leaving the role of pfmdr1 in CQR modulation and reversibility unresolved (Adagu and Warhurst, 2001; Chen et al., 2002; Duraisingh and Cowman, 2005; Hayton and Su, 2004; Rason et al., 2007; Sidhu et al., 2006). PfMDR1 overexpressed in Xenopus laevis oocytes transports quinine (QN), halofantrine and CQ in a mutation specific manner, but only wild type PfMDR1 transported CQ in this model (Sanchez et al., 2008). In Pichia pastoris, heterologous PfMDR1 expression catalyzes drug-stimulated ATPase activity (Amoah et al., 2007; Lekostaj et al., 2008a).
Pfcrt and pfmdr1, among other loci, interact to affect QN dose responses, leading us to propose that local drug selection in different geographic regions can differentially shape the gene interactions and their impact on a range of drug resistance phenotypes (Ferdig et al., 2004; Sen and Ferdig, 2004). Two recent studies, one using classical genetics (Sa et al., 2009) and the other reverse genetics (Valderramos et al., 2010), demonstrated the pivotal influence of the parasites’ genetic backgrounds (i.e. distinct drug selection histories) into which the key CQR-conferring pfcrt mutations are successfully inherited or experimentally introduced.
A hallmark of CQ resistant parasites is that particular compounds can re-sensitize them to CQ, a phenomenon termed “reversibility” (Martin et al., 1987). A similar reversal effect was first observed in MDR mammalian tumor cells (Rogan et al., 1984; Tsuruo et al., 1982), and many classes of compounds have now been identified that can reverse CQR (Kyle et al., 1990; Pradines et al., 2005). One of the earliest identified reversal agents was verapamil (VP), a Ca2+ channel blocker indicated for the treatment of angina pectoris, cardiac arrhythmias, and hypertension. In human tumor cells, VP-dependent chemosensitization is believed to be mediated by Pgp (McGrath et al., 1989; Shen et al., 1986). Because VP was found to re-sensitize CQ resistant P. falciparum to near CQS levels, a Pgp efflux mechanism was considered the likely basis of CQR. Three-dimensional quantitative structure activity relationship studies generated a pharmacophore model for a group of tri-cyclic antidepressants that reverse CQR (Bhattacharjee et al., 2002). Two hydrophobic, aromatic regions with a nitrogen atom acting as a hydrogen-bond acceptor are apparently required for CQR reversal activity (Bhattacharjee et al., 2001). This model accommodates a variety of CQR reversal agents that span distinct chemical classes, including VP, cyproheptadine, ketotifen, chlorpheniramine (CLM), and citalopram (CT). Two theories have been proposed for VP reversal of CQR: 1) the ‘drug transporter’ hypothesis argues that VP competes with CQ for target binding and perhaps drug transport in resistant parasites (Bray and Ward, 1998; Martiney et al., 1995; Sanchez et al., 2004), and; 2) VP may act on ion transport to alter the compartmental pH and/or membrane potentials to levels found in CQS parasites (Bennett et al., 2004; Martiney et al., 1995; Roepe and Martiney, 1999; Ursos et al., 2000). Both hypotheses are possibly relevant, as drug transport by drug resistance proteins could be due to direct or indirect ion mediated co-transport (Zhang et al., 2004). CQR reversibility by VP and the 8-aminoquinoline, primaquine (Bray et al., 2005), like CQR itself, has been attributed to PfCRT, yet the possibility of non-target based mechanisms suggests the interaction of multiple transporters. Reversal agents themselves are toxic to the parasites (Adovelande et al., 1998; Menezes et al., 2002, 2003), but it is not known if these structurally diverse reversal agents exert their toxic effect solely by PfCRT or involve additional genes, nor if their inherent anti-plasmodial effects predict the degree of reversibility of CQR. For example, some CQ resistant parasites such as the South American 7G8 strain, are less responsive to the VP reversal effect (Mehlotra et al., 2001; Sa et al., 2009). It is not known if factors that contribute to the wide range in CQ IC50 values among CQ resistant field isolates, even in the presence of identical PfCRT alleles (Mu et al., 2003), can also influence reversibility.
PfCRT has been the overriding focus of recent studies of CQR and its coupled reversibility by VP. To search for additional contributing genes we measured quantitative CQ susceptibility and its reversibility by various pharmacological classes of compounds, including VP, CLM, CT, probenecid (PB) and amitriptyline (AM) in progeny of the HB3 × Dd2 genetic cross. Using 33 independent progeny, we use quantitative trait locus (QTL) profiles to probe the complex genetic background of the Southeast Asia-derived CQR and its functional relationship to reversal. This approach revealed a dynamic interplay of major and minor shared loci highlighting gene adaptations influencing CQR, reversibility, and fitness. The contribution of pfmdr1 and a putative secondary locus on chr 7 locus to CQR is reported. Pfcrt controls the vast majority of reversal by a range of compounds. We find no evidence that pfmdr1 copy number (CN) affects CQ IC50 values, however, co-inheritance of specific pfmdr and pfcrt allele combinations in individual progeny underscores a complex genetic background of CQR.
Results
Quantitative effects of reversal agents, independently and in combinations, in the parental lines
Six reversal agents – VP, CT, AM, CLM, PB, and desipramine (DES) – spanning various pharmacologically active drug classes were tested in combination with CQ. Fractional inhibitory concentrations (FIC) (Elion et al., 1954) at each of the fixed molar ratios for all drug combinations were determined for both HB3 and Dd2 to quantify the type and degree of interactions between the reversal agent and CQ. When plotted as isobolograms, synergistic effects were observed for Dd2 in combinations of CQ+VP (Fig. 1A), CQ+CT (Fig. 1B), CQ+AM (Fig. 1D), CQ+DES (Fig. 1E), and CQ+CLM (Fig. 1F), whereas all combinations were additive in HB3. PB was not synergistic in Dd2 (Fig. 1C), contrary to a previous observation in the CQ resistant strain, V1/S (Nzila et al., 2003); however, a recent report from this same group (Masseno et al., 2009) revised their assessment of PB reversal of V1/S CQR to be 5-fold less synergistic. We confirmed a linear or slightly additive relationship between PB and CQ for both HB3 and Dd2.
Fig. 1. Isobolograms characterize drug interactions in Dd2 and HB3.
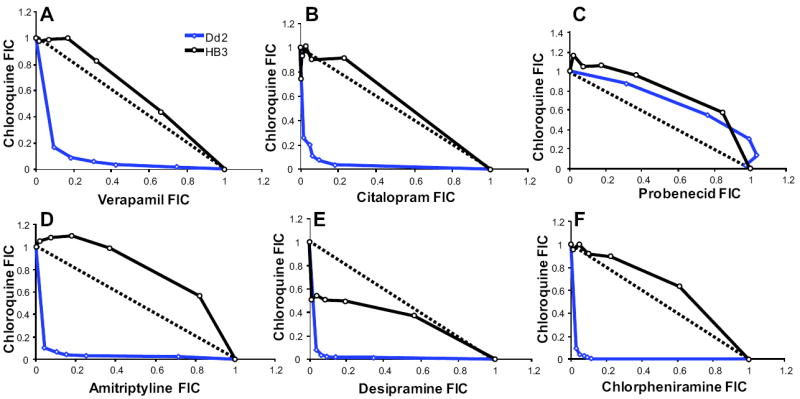
Data points represent the FICs of various dose-combinations of (A) CQ+VP, (B) CQ+CT, (C) CQ+PB, (D) CQ+AM, (E) CQ+DES and (F) CQ+CLM. Each isobologram represents the interaction in both CQ resistant parent Dd2 (blue) and CQS parent HB3 (black). Points near the solid line indicate an additive relationship between the two drugs; while those above the line indicate antagonism those below the line indicate a synergistic relationship. Synergistic interactions were observed for most drug combinations except CQ+PB. The CQ+DES interaction plot showed weak synergism in HB3 and CQ+PB was additive for both HB3 and Dd2.
Based on the comprehensive analysis of the parent clones, a single fixed dose combination was used to construct a measure of reversibility for replicate testing of 33 progeny clones. The fixed dose volumetric ratio of 9:1, representing the lowest concentration of reversal agent that showed synergism (Fig. 1) was used for all drug combinations examined in the progeny (CQ+VP, CQ+CLM, CQ+CT, and CQ+AM). The starting concentration for the 2-fold serial dilutions (see methods) were CQ:VP – 2.25 μM : 24.03 μM, CQ:CLM – 2.25 μM : 71.01 μM, CQ:CT – 2.25 μM : 6.85 μM, and CQ:AM – 2.25 μM : 22.30 μM. CQ IC50 values in HB3 and Dd2, with and without reversal agent, demonstrated that reversal agents did not significantly alter the CQ response in HB3 (p > 0.05, n = 5), whereas highly reproducible reversibility (n = 18-22) was achieved with each of the four combinations in Dd2 (Fig. S1). The combination of CQ+AM was the most potent, lowering the IC50 of CQ to 59.2 ± 3.12 nM, whereas CQ+CT was the least potent, lowering the IC50 to an intermediate level of 117.3 ± 6.84 nM in Dd2. Table 1 summarizes the inherent IC50 values for VP, CLM, and CT when tested independently. Dd2 was more sensitive to VP, CLM, and CT than HB3, with more than 6-, 45-, 20-fold differences, respectively. Dd2 was only slightly more sensitive to DES (1.4-fold) than HB3, and no difference was observed between the parent lines for PB IC50 values (data not shown).
Table 1.
Drug responses in the parents of the genetic cross.
| Drugs | n | Mean ± SEM | n | Mean ± SEM |
|---|---|---|---|---|
| Dd2 IC50 (nM) | HB3 IC50 (nM) | |||
| VP | 21 | 2303 ± 245 | 5 | 14307 ± 3442 |
| CLM | 22 | 1976 ± 238 | 5 | 90446 ± 1902 |
| CT | 21 | 2082 ± 200 | 5 | 42276 ± 1771 |
| CQ | 18 | 422 ± 25.0 | 5 | 27.2 ± 0.94 |
| CQ+VP | 22 | 82.8 ± 4.42 | 5 | 25.9 ± 0.57 |
| CQ+CLM | 22 | 71.7 ± 3.71 | 5 | 20.6 ± 5.19 |
| CQ+CT | 21 | 117 ± 6.84 | 5 | 25.5 ± 0.78 |
| CQ+AM | 22 | 59.2 ± 3.12 | 5 | 25.4 ± 0.91 |
Reversibility in the progeny of the genetic cross
Only the reversal agent-CQ combinations that showed strong synergy in Dd2 were carried over into a full analysis of the progeny. Mean IC50 values from VP, CLM and CT, alone and in combination with CQ, were obtained from five independent replicates for each of the progeny of the genetic cross (Table S1). Values were continuously distributed for each compound, with no clear IC50 gap dividing the progeny into two classes that would be expected if a single gene determined the phenotype. CQS progeny were less sensitive to VP alone than CQ resistant progeny (Fig. 2A, p < 0.01), and this dichotomy was consistent for all the reversal agents.
Fig. 2. Ranked plots showing phenotype distributions for CQ with and without VP.

A. Ranked distribution for VP response against CQ response in the cross. VP response is continuously distributed and inversely related to CQ response. Progeny that had high VP IC50 values had lower CQ IC50 values. This negative relationship was consistent with all other reversal agents tested.
B. Ranked distribution for CQ response against fold change in the presence of VP. Fold change partitions the drug responses into two groups (CQS and CQ resistant) depending on the HB3 and Dd2 pfcrt allele.
Among the progeny, IC50 values ranged from 18.3-771.0 nM for CQ and 17.8-105.1 nM for CQ+VP. A relative measure, computed as fold change, was used to assess the degree of reversibility. For each drug combination, the fold change distribution divided the progeny into two groups that coincided with the inherited pfcrt allele and therefore CQ resistant or CQS status (Fig. 2B). CQ susceptibility in the presence of VP for both CQS (Fig. 3A) and CQ resistant (Fig. 3B) progeny was strongly correlated with CQ response in the absence of VP; however, no significant changes were observed in CQ susceptibilities of CQS progeny in the presence of VP (fold change 1.1 ± 0.1, p > 0.05), whereas significantly lower IC50 values were detected in CQ resistant parasites (6.6 ± 1.1 fold change, p < 0.0001) in the presence of VP. The degree of reversibility (fold change ranging from 4.7-8.1) was independent of the inherent CQ IC50 values in CQ resistant progeny (Fig. 3C) (r = 0.2, p > 0.05), and the primary reversal mechanism for all three compounds depended on pfcrt mutations. Highly significant correlations were observed among fold-changes induced by the 4 compounds in CQ resistant progeny (Table S1) (r values ranging from 0.89 to 0.95), indicating that a common additional gene(s) controls the degree of reversibility. Regression analyses of the relationships between CQ IC50 and the potencies of the reversal agents and fold change are provided in Table 2. Negative correlations were detected between CQ IC50 values and VP, CLM, and CT IC50 values, whereas fold change resulting from CQ+reversal agent was strongly positively correlated with the CQ IC50. When these analyses were performed individually on the CQS and CQ resistant subgroups, the relationship between fold change and CQ IC50 was lost in both sub-groups, indicating that secondary influences on CQ IC50 values do not affect fold change. However, positive relationships were identified for CLM and CT potencies with CQ IC50 in both CQS and CQ resistant progeny, suggesting that secondary genetic determinants of quantitative CQ susceptibility in these sub-groups may influence CLM and CT response.
Fig. 3. Relationship between CQ IC50 and CQ with VP response in CQS and CQ resistant progeny.

A. Relationship between CQ response with and without VP in CQS parasites. CQS progeny exhibit a strong positive relationship between CQ response with and without VP (r = 0.80, p < 0.0001), although this relationship reflects unchanged responses.
B. Relationship between CQ response with and without VP in CQ resistant parasites. CQ resistant progeny exhibit a strong positive relationship between CQ response with and without VP (r = 0.84, p < 0.0001), resulting from a significant reduction in CQ response in the presence of VP.
C. Relationship between CQ response and fold change of CQ response in the presence of VP. Correlation analysis detects no significant relationship between CQ response in CQ resistant parasites and the fold change resulting from CQ+VP combination (r = 0.2, p > 0.05).
Table 2.
Correlation analyses for CQ response vs. reversal agent potency and fold change in CQS and CQR progeny.
| All progeny
| |||||||
|---|---|---|---|---|---|---|---|
| CQ IC50 vs. | VP | CLM | CT | CQ+VP fold change | CQ+CLM fold change | CQ+CT fold change | CQ+AM fold change |
| r | -0.72 | -0.95 | -0.92 | 0.98 | 0.98 | 0.98 | 0.98 |
| p value | *** | *** | *** | *** | *** | *** | *** |
|
| |||||||
|
CQS progeny
| |||||||
| CQS IC50 vs. | VP | CLM | CT | CQ+VP fold change | CQ+CLM fold change | CQ+CT fold change | CQ+AM fold change |
| r | 0.37 | 0.49 | 0.53 | 0.32 | 0.42 | 0.34 | 0.45 |
| p value | 0.12 | 0.03 | 0.02 | 0.19 | 0.07 | 0.15 | 0.06 |
|
| |||||||
|
CQR progeny
| |||||||
| CQR IC50 vs. | VP | CLM | CT | CQ+VP fold change | CQ+CLM fold change | CQ+CT fold change | CQ+AM fold change |
| r | 0.48 | 0.55 | 0.75 | 0.15 | 0.02 | 0.08 | 0.04 |
| p value | 0.06 | 0.03 | 0.0001 | 0.59 | 0.93 | 0.78 | 0.89 |
VP, CLM, and CT represent IC50 values of reversal agents when used alone (i.e. potency)
Correlation analysis reported as Pearson’s correlation coefficient reported as an r value, and the p value determining if significantly deviating from zero.
p < 0.0001
QTL analysis of drug responses
Genome-wide QTL scans for VP, CLM, CT, CQ, and CQ+VP responses are presented in Fig. 4. VP, tested independently (Fig. 4A), revealed a significant chr 7 QTL at 20.2 cM (log of odds [LOD] = 6.9) in the region of pfcrt. In addition, a suggestive QTL was identified on chr 5 (LOD = 2.3) that mapped to the marker at position 68.8 cM in the region of pfmdr1. CLM (Fig. 4B) and CT (Fig. 4C), tested independently, each revealed two QTL: a significant QTL on chr 7 (20.2 cM, LOD = 47 and 28, respectively) and a suggestive QTL on chr 5 (68.8 cM, LOD = 2.7 and 2.9, respectively). The substantial coincidence of the chr 5 (pfmdr1) and chr 7 (pfcrt) QTL for VP, CLM, and CT was consistent with a relationship between these two loci in controlling sensitivities to VP, CLM, and CT. The genome-wide scan for CQ sensitivity detected a single highly significant QTL with a LOD = 39 (Fig. 4D). Fold change resulting from combining each reversal agent with CQ revealed a single shared QTL on chr 7 (20.2 cM) with even higher LODs than were observed for CQ response (e.g. Fig. 4E).
Fig. 4. Genome-wide QTL scans.

Three significance thresholds were determined by permutation testing. Highly significant (p < 0.01), significant (p < 0.05), and suggestive (p < 0.63) LOD scores are represented by horizontal lines on each scan. The abscissae show chromosomal location (14 chromosomes), where the width of the chromosome number is proportional to the number of markers. All traits (A) VP, (B) CLM, (C) CT, (D) CQ, and (E) CQ+VP map to chr 7 (20.2 cM) in the region of pfcrt. A suggestive QTL on chr 5 (68.8 cM) in the region of pfmdr1 was detected for (A) VP, (B) CLM, and (C) CT.
Allelic effects for the chr 5 (68.8 cM) and chr 7 (20.2 cM) loci (Fig. 5A and B, respectively) indicated that higher IC50 values for VP, CLM, and CT drug responses were associated with the HB3 allele at both loci. For CQ response, the Dd2 allele on chr 7 (20.2 cM) was associated with a higher IC50 and a greater fold change in the presence of a reversal agent. Figure 5C and D show an overlay of QTL highlighting the shared QTL on chrs 5 and 7, respectively. This shows that at least two, and probably more loci influence the response to reversal agents by themselves, commensurate with the continuous distribution of those traits. However, CQ response reversibility is solely dependent on the chr 7 genetic effect that generates a two-class phenotype as a result of mutations in pfcrt (Cooper et al., 2002; Fidock et al., 2000; Sidhu et al., 2002). To investigate the genetic basis of the highly correlated degree of reversibility induced by VP, CT, AM and CLM in CQ resistant progeny, measured as fold change, we conducted QTL scans directly on this sub-class of progeny. A QTL peak on chr 11 (48.8 cM) in the region of marker C12M42 at 701,403 bp, passed the suggestive LOD threshold for fold-change with all 4 compounds (data not shown).
Fig. 5. Allele effects at peak markers for QTL detected on chr 5 and 7.

Effects of the Dd2 and HB3 alleles for response to VP, CLM, CT, and CQ at peak markers for QTL: (A) chr 5 (68.8 cM) and (B) chr 7 (20.2 cM). Higher trait values were observed for the HB3 alleles at both QTL for the reversal agents tested independently, whereas the higher trait value for CQ response and fold change (degree of reversibility) were observed with the Dd2 allele. (*p < 0.05, **p < 0.001, and ***p < 0.0001). Overlaid QTL for VP (blue), CLM (red), and CT (black) for (C) chr 5 and (D) chr 7, respectively.
Identification of genetic loci affecting the range of susceptibilities in CQ resistant progeny
The rank order distribution of CQ response in the progeny is bimodal, as originally demonstrated by Wellems et al. (1990), and as is expected for a single major gene. In that early work, microscopy-based evaluation of parasitemias showed identical IC50 values for 8 CQS and 8 CQ resistant progeny, and these two discrete classes did not segregate with the pfmdr1 marker allele, proving that in the HB3 × Dd2 progeny pfmdr1 was not the determinant of CQR. Here we used 33 progeny and multiple independent replications of radiolabeled-hypoxanthine incorporation to observe continuous distributions of quantitative CQ susceptibility within both the CQS (18-38 nM) and CQ resistant (266-771 nM) sub-groups (Fig. 6A). We examined only the CQ resistant progeny for further analyses to specifically map QTL contributing to the wide range of CQ IC50 values in the resistant class inheriting mutant pfcrt. This approach eliminates the contribution by pfcrt effect because each of the CQR progeny carried the identical Dd2 pfcrt allele. We identified two secondary loci, on chrs 5 and 7. The chr 5 QTL again mapped to 68.8 cM in the region of pfmdr1, with a LOD = 2.5, and the novel chr 7 QTL mapped to 5.8 cM with a LOD = 2.0 (Fig. 6B and Table S2). The allelic effect plots indicate that the chr 5 (68.8 cM) HB3 allele and the chr 7 (5.8 cM) Dd2 allele contributed to the highest CQR IC50 values (Fig. 6C). Because we observed a suggestive chr 5 QTL peak in this subset of progeny, we further examined the relationship between pfmdr1 and the Dd2 type pfcrt allele by employing the statistical method described by Sa et al. (2009) to directly test the influence of different pfmdr1 alleles on CQ IC50 values. Four different allele pair combinations were possible for pfmdr1 and pfcrt: D5D7, H5D7, D5H7, and H5H7 (D represents an allele inherited from Dd2, and H represents an allele inherited from HB3). The pfmdr1 locus significantly influenced the CQ IC50 only in CQ resistant progeny; we detected a 1.57-fold shift in CQ susceptibility (p < 0.01) depending on the source of the pfmdr1 allele in combination with mutant pfcrt. CQR progeny with the H5D7 combination have significantly higher IC50 values than D5D7 (Fig. 6C). Because this difference was not detected in a recent study (Sa et al., 2009), we validated our findings. The rank order of CQ IC50 values, 1BB5 > QC03 > 3BD5 in our study, contributed most to the differing results between the two studies. Because we use CQ as a control drug in our ongoing drug assays, 4 independent replicated analyses of the complete progeny set were available in our database and each demonstrated the same statistically significant rank order (1BB5 > QC03 > 3BD5) (data not shown). We also reanalyzed CQ IC90 values from the HB3 × Dd2 cross (Ferdig et al., 2004) using the same alternative statistical model outlined here and found a 1.4-fold CQ IC90 difference (p < 0.01) between D5D7 and H5D7 progeny, with the latter combination most resistant.
Fig. 6. CQ drug responses in the progeny identifying additional QTL effects contributing to extreme CQ drug response.
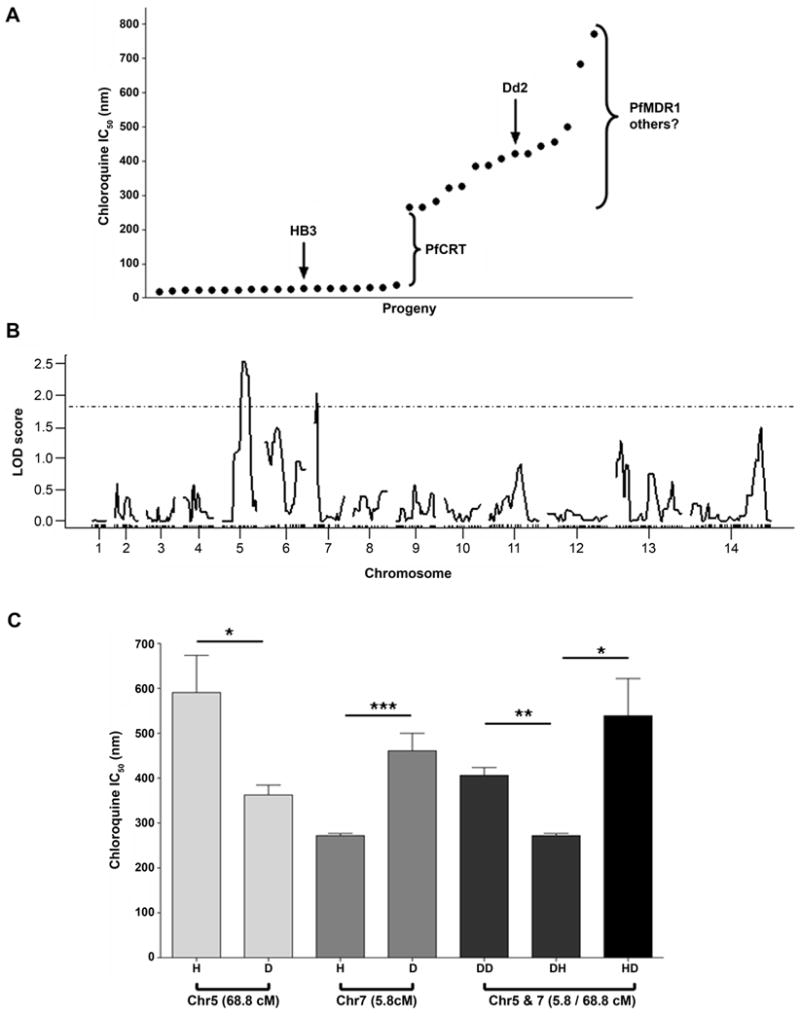
A. Rank order plot of CQ response in the progeny of the cross. A greater than 10 fold increase in IC50 divides the progeny into CQS and CQ resistant subsets. As a trait, this large difference maps to pfcrt on chr 7 and explains greater than 95% of the total variation in the cross. A steady increase in CQ resistant progeny is observed ranging from (266.5 - 771.0 nm).
B. Genome-wide QTL scan for CQ response in CQ resistant progeny. This QTL analysis identifies two suggestive QTL (p < 0.63): one on chr 5 (68.8 cM) in the region of pfmdr1 and one on chr 7 (5.8 cM).
C. Allele effects of peak markers of CQR QTL. Inheritance of the Dd2 allele at the QTL on chr 5 (68.8 cM) confers low-level CQR, whereas the HB3 allele corresponds to higher CQR levels. An opposite pattern is seen for the chr 7 QTL peak marker (5.8 cM). A combination of H5D7 alleles combined with Dd2-type pfcrt results in the highest CQR levels, (*p < 0.05, **p < 0.001, *** p < 0.0001).
PfMDR1 CN and observed allele combinations in the progeny clones
Pfmdr1 CN was determined for all progeny (Table S3). The Dd2 parent has 3 copies while HB3 has a single copy. We observe 9 progeny with 2 copies and 3 additional progeny with the Dd2 pfmdr1 allele and CN = 1. Non-parental CN were reported previously for partial sets of HB3 × Dd2 progeny (Rohrbach et al., 2006; Wellems et al., 1990) and increased CN shows increased expression levels of PfMDR1 (Rohrbach et al., 2006; Wilson et al., 1989). Here we confirm and extend the findings of the inherited variation in CN, noting that the HB3 pfmdr1 allele is always present as a single copy, while the Dd2 allele varies from 1-4 copies across the progeny set. We have confirmed the in vitro stability of CN by culturing 10 progeny clones for 30-45 replication cycles and observing no change in CN (data not shown).
It is difficult to determine the direct impact of pfmdr1 CN on CQ IC50 values because the allele effects cannot be precisely separated from the CN effects in progeny carrying 1 vs. 2 copies. However, a direct comparison of IC50 values of CQ resistant parasites with 2 vs. 3 or more copies, all of which contain Dd2 pfcrt and pfmdr1 alleles, reveals no correlation (r = -0.02) and no difference in the mean IC50 values (p = 0.59). Furthermore, we statistically removed the contribution of pfcrt and compared the residuals of mean CQ IC50 values in the complete progeny set and found that CN (1 vs. >1, p = 0.044) accounted for somewhat less of the residual variation than point mutations alone (HB3 vs. Dd2, p = 0.02). Consequently, our data do not support a role for CN in influencing CQ susceptibility. However, several observations support co-adaptation between pfmdr1 CN and pfcrt. Inherited combinations of these loci in the progeny clones suggest an influence on fitness as surmised from the combinations that exist among the progeny: i. of 33 progeny analyzed, 15 inherited the Dd2 pfmdr1 allele, but only 3 retained the full complement of 3 copies; each of these 3 carries the mutant pfcrt. Twelve of 15 progeny with the Dd2 pfmdr1 allele lost at least one pfmdr1 copy in the establishment of the stable progeny clonal lines ; ii. all progeny carrying the single copy Dd2 pfmdr1 allele are CQS, carrying the wild type pfcrt; iii. all 5 of the progeny with the D5H7 allele combination carry fewer than 3 copy. High CN is maintained only in the context of its co-selected mutant pfcrt partner, and CQS pfcrt is never paired with 3 copies of pfmdr1 (Table S3).
Binding of a high affinity CQ analogue to PfMDR1
Recently, the CQ binding site for wild-type PfCRT was defined using a novel photoaffinity chloroquine analogue, azido-biotinylated chloroquine (AzBCQ) (Lekostaj et al., 2008b). Using this same method and overexpression of recombinant PfMDR1 (Amoah et al., 2007; Lekostaj et al., 2008a), we tested whether the high affinity AzBCQ probe would bind to 3D7 (wild type), Dd2, and 7G8 isoforms of purified recombinant PfMDR1 protein reconstituted into proteoliposomes (PLs) as recently described elsewhere (Pleeter et al., 2010). Figure 7 demonstrates that binding of AzBCQ to PfMDR1 reveals CQ affinity for PfMDR1. A 40-50 fold molar excess of CQ reduces efficiency of AzBCQ photolabeling to < 30% of control for 3D7 and Dd2 isoforms of PfMDR1 (Fig. 7A; lanes 2 vs. 1 and 5 vs. 4, respectively). Apparent CQ affinity for the 7G8 isoform is slightly reduced (competition to < 40% of control, Fig. 7A; lane 8 vs. 7) relative to the other isoforms. Averaged over 3 experiments and 2 independent PL preparations for each isoform of PfMDR1, we did not identify pronounced VP competition for AzBCQ photolabeling to any isoform of PfMDR1 (Fig. 7C), in contrast to our earlier demonstration of VP competition for AzBCQ photolabeling of the 3D7 and Dd2 isoforms PfCRT (Lekostaj et al., 2008b).
Fig. 7. Competition of AzBCQ labeling of 3D7, Dd2 and 7G8 isoforms of PfMDR1 by CQ and VP.

In each photolabeling experiment, AzBCQ was present in a probe:protein molar ratio of about 100:1. PfMDR1 was labeled at various drug:AzBCQ molar excess ratios indicated below. All blots are representative of experiments conducted at least three times on at least two preparations of purified PLs wherein similar data was observed. Lanes 1-3 are 3D7 PfMDR1, lanes 4-6 are Dd2 PfMDR1, and lanes 7-9 are 7G8 PfMDR1. Top panels: Streptavidin-HRP detection of AzBCQ photolabeling with CQ competition. First lanes of each isoform have no competitor; second lanes of each isoform have 48-fold excess CQ; third lanes of each isoform have 80-fold excess CQ. Middle panels: Anti-PentaHis-HRP detection of -6His tag present in all isoforms. Bottom panels: Streptavidin-HRP detection of AzBCQ photolabeling with VP competition. First lanes have no competitor; second lanes have 20-fold excess VP; third lanes have 40-fold excess VP.
Discussion
After decades of remarkable success, CQ is no longer used against P. falciparum in most regions of the world due to the evolution of resistance (Wellems and Plowe, 2001). Selection by CQ was the first step towards the evolution of modern-day MDR parasites, yet questions remain about how CQR evolved and why CQR parasites persist long after CQ disuse. Answers to these questions will inform a more strategic development and deployment of drugs against MDR parasites.
The classical genetics approach relies on Mendelian recombination and segregation to shuffle the naturally evolved allele combinations that have been fine-tuned by selection pressures on the parental genomes. By crossing two parents with distinct evolutionary histories, e.g. drug selection pressures applied in different geographic regions, the divergent signatures of selection in these genomes can be identified by QTL mapping. The strength of this approach was illustrated in a recent study comparing the genetic control of CQ and amodiaquine susceptibilities in progeny from two crosses between parents carrying a range of drug selection histories (Sa et al., 2009).
Here, we rely on the P. falciparum HB3 × Dd2 genetic cross (Wellems et al., 1990) to dissect the quantitative response to CQ, and to identify genetic loci that influence the reversibility of CQR. HB3 is a CQS parasite derived from Honduras. The progenitor of Dd2 was derived from a Laotian patient who failed CQ therapy (Campbell et al., 1982), and this line also has high-level resistance to pyrimethamine. Dd2 was cloned from W2-mef which was selected in the laboratory by mefloquine (MQ). Consequently, the MDR Dd2 genome has been shaped by sequential drug selections and carries the Southeast Asia-derived CQ resistant PfCRT haplotype, referred to here as CVIET (amino acid positions 72-76).
A wide range of compounds can reverse CQR. By adapting the QTL methodology to compare a range of CQ chemosensitizers, we explored the genetic components of reversibility, represented by fold-change of CQ IC50 induced by several reversal agents. Furthermore, we examined the potencies of the individual reversal compounds. Continuous distributions were observed for the inherent potencies of VP (Fig. 2A), CLM, and CT and susceptibility to these compounds was inversely correlated with CQ response. Previously VP was shown to have greater potency against CQ resistant parasites (Gerena et al., 1992), as have various antihistaminics (Peters et al., 1989, 1990) and amantadine (Johnson et al., 2004). Models predict binding of amantadine, a proton channel blocker, to the putative PfCRT pore of CQ resistant parasites that could interfere with the transport of a critical substrate, resulting in parasite death (Johnson et al., 2004; Wellems, 2004). This and other observations suggest that specific PfCRT binding by reversal agents underscores the potential of this transporter as a drug target. The continuous phenotype distributions indicate that multiple genes contribute to these traits. QTL analyses of the direct responses to VP, CLM, and CT (Fig. 4 A-C) identified two loci shared by all three reversal agents. The QTL on chr 5 maps to a marker at 68.8 cM in the region of pfmdr1 (Fig. 5C) and the QTL on chr 7 maps to the marker at 20.2 cM in the region of pfcrt (Fig. 5D). These shared QTL indicate that parasite susceptibility to these structurally and pharmacologically distinct compounds is controlled by similar mechanisms that depend on both pfcrt and pfmdr1. The HB3 allele at both loci is associated with higher drug IC50 values in the progeny (Fig. 5A and B). No other statistically significant loci were detected for these compounds, leaving unclear where additional factors controlling these complex traits reside.
In contrast to the individual effects by these compounds, genome-wide scans for reversibility maps to a single locus on chr 7 (20.2 cM) in the region of pfcrt. All combinations [CQ+VP (Fig. 4E), CQ+CLM, CQ+CT, and CQ+AM] had exceptionally high LOD scores, indicating that reversibility of CQR is predominantly determined by pfcrt for all drug combinations. This observation is consistent with the recent observations that VP inhibits CQ transport (Martin et al., 2009; Paguio et al., 2009) and competes for labeling of recombinant purified PfCRT by a photoaffinity CQ analog (Lekostaj et al., 2008b). Correspondingly, that we observed no effect by pfmdr1 on reversibility agrees with the lack of significant disruption by VP of PfMDR1-AzBCQ binding (Fig. 7). Our observation of a direct determination of reversibility by pfcrt mutations concurs with the recent evidence that CQ reversal agents are substrates for PfCRT and possibly inhibit CQ transport by a competitive mechanism (Lehane and Kirk, 2010). Our findings are restricted to the CVIET pfcrt allele carried by the Dd2 parent; other reports indicate that VP has less potency as a CQR reverser in the context of the SVMNT allele (Mehlotra et al., 2001; Sa et al., 2009), perhaps because VP is not a substrate for this form of pfcrt (Lehane and Kirk, 2010). We also identified a candidate locus on chr 11 controlling the 4- to 8-fold increase in CQ susceptibility induced by all 4 reversal agents. Although this is a modifying locus in HB3 × Dd2 progeny, it could point to a gene or pathway that plays a prominent role in the more subtle form of reversal observed in 7G8 that is not strongly linked to PfCRT mutations.
The HB3 × Dd2 P. falciparum genetic cross (Wellems et al., 1990) was generated to localize the determinant of CQR. For those studies, CQ susceptibility was treated as a bimodal trait such that each progeny was assigned to a subclass – CQS or CQ resistant. This approach is effective for mapping a major genetic determinant and led to the identification of the chr 7 locus (Wellems et al., 1991), followed by positional cloning of pfcrt and eventual identification of the critical K76T mutation (Fidock et al., 2000; Su et al., 1997). QTL analyses relies on precise measurement of continuous phenotypes and can reveal both major and minor gene contributions and define the interactions among the identified loci (Ferdig et al., 2004). QTL analyses of CQ resistant progeny removes the dominant pfcrt effect and points to two suggestive QTL [on chr 5 (68.8 cM) and on chr 7 (5.8 cM)] that account for ~70% of the phenotypic variance inherited in CQ resistant individuals (Fig. 6B). We found that the pfmdr1 locus significantly influenced CQ IC50 values in CQ resistant progeny, producing a 1.57-fold shift in CQ susceptibility. The effect of pfmdr1 in generating distinct levels of CQR in the HB3 × Dd2 cross is weaker than the nearly 2-fold shift induced in the progeny from the 7G8 × GB4 cross that carries the7G8 pfcrt allele from South America (SVMNT) (Sa et al., 2009).
The insight of Sa et al. that different drug use in different geographic regions will result in differentially tuned allele combinations may also be relevant here. Specifically, these authors propose that pfmdr1 mediates a more stable, persistent form of CQR in South America and that this advantaged pfmdr1 × pfcrt allelic combination may be induced in Africa by increased use of amodiaquine. The observation that low level QN resistance in the HB3 × Dd2 cross exhibited a positive correlation with CQ IC90 values in CQ resistant parasites led to the suggestion that secondary loci selected by QN pressure, including pfmdr1, could incrementally influence CQ and other drug susceptibilities through a complex adaptive role among various polymorphisms (Ferdig et al., 2004). That is, amplification of and site-specific changes in pfmdr1 associated with QN susceptibility (Cowman et al., 1994; Reed et al., 2000), could, in turn, have influenced the stability of CQR in Southeast Asia and Africa through co-adapted allele combinations.
We observed that CQ resistant progeny that inherited an HB3 allele at pfmdr1 produced the highest CQ IC50 values (Fig. 6C). This observation concurs with the observation that 7G8 × GB4 progeny that inherited the GB4 (CVIET) PfCRT allele show a smaller shift in CQR levels (1.4 fold) induced by the co-inherited pfmdr1 allele (Sa et al., 2009). In both crosses, it is the mismatched pfmdr1 allele – the allele not originating from the CQ resistant parent with the CVIET haplotype – that is associated with the highest levels of CQR among the respective progeny. Importantly, this is in contrast to the situation for the 7G8 form of pfcrt (SVMNT) that produces its highest levels of CQR when matched with its co-evolved 7G8 pfmdr1 partner. Notably, the levels of resistance produced by SVMNT are considerably lower than those produced by CVIET PfCRT, which originated in Southeast Asia and later spread to Africa (Wootton et al., 2002). The unmatched allele combination, GB4 pfmdr1 – 7G8 pfcrt exhibited a strikingly low level of CQR, with nearly 2.5-fold lower IC50 values than the average CVIET progeny, perhaps near the limit of surviving therapeutic CQ doses. Considered in total, these observations imply that pfmdr1 and pfcrt are co-evolved in the respective CQ resistant parent genomes to optimize cell function and compensation rather than to maximize CQR levels.
Analogous to the persistence of SVMNT CQR pfcrt allelles in South America (Contreras et al., 2002; Vieira et al., 2004), CQ resistant parasites continue to predominate in Thailand more than 25 years after cessation of CQ therapy (Brockman et al., 2000; Mu et al., 2005; Price et al., 2004), even while carrying the CVIET form of pfcrt that has been suggested to be less fit in some genetic contexts. For example, CQ sensitivity has reemerged in Malawi, where CQR was once widespread but CQ is no longer used (Kublin et al., 2003; Laufer et al., 2010; Mita et al., 2003), and in Hainan, China, where over a 10 year period CQR prevalence decreased from 98% to 61% (Liu et al., 1999). In these cases, CQ sensitivity returned steadily by re-integration of the complete CQS genomes, not by point mutant reversions that would be predicted for a single gene resistance with strong fitness costs.
Hastings et al. recognized that introduction of pfcrt mutations alone was sufficient to induce CQR only in certain genetic backgrounds (Hastings et al., 2002; Sidhu et al., 2002), noting that the definitive experiment would require the introduction of these mutations into a series of different genetic backgrounds. Valderramos et al. recently demonstrated the critical role of genetic background on the ability of the 7G8 pfcrt allele to confer CQR (Valderramos et al., 2010); they induced phenotypes in a variety of CQS backgrounds that ranged from high-level CQR (GC03, a progeny of the HB3 × Dd2 cross) to no change in IC50 but an increased rate of recrudescence (D10, Papua New Guinea). Parasite lines with identical pfmdr1 alleles transfected with the same pfcrt allele showed distinct CQ resistant phenotypes, underscoring the role of genes other than pfmdr1 and pfcrt. Moreover, the Dd2 pfcrt allele could not be used to successfully transform three different CQS background:, 3D7, D10 and HB3. Only GC03, carrying half of its genome from Dd2, has been successfully transfected with the Dd2 pfcrt, giving rise to high-level CQR. Because HB3 and GC03 carry identical single copy pfmdr1 alleles, we can again infer that an additional gene(s), co-selected in the Dd2 parent, must contribute to the competency of a CQS parasite to support the large effect CQR mutations. Notably, the mutational steps that gave rise to the few independently evolved CQR origins remain unknown. One possible candidate is an epistatic partner of pfcrt residing in the chr 6 locus was shown previously to regulate low level QN resistance and associate with slow in vitro expansion rates of progeny inheriting the HB3-type chr 6 and Dd2-type pfcrt loci (Ferdig et al., 2004).
Dd2 and HB3 differ both in point mutations and CN for pfmdr1: Dd2 (86Y, 184Y, and 1042N) maintains three copies of pfmdr1, while HB3 (86N, 184F, and 1042D) maintains a single copy. In an effort to evaluate the relative contribution of point mutations and CN on CQ susceptibility, we determined CN for the complete progeny set. Previous studies demonstrated that increased copies of pfmdr1 coincided with an increase in PfMDR1 protein levels (Rohrbach et al., 2006). Allelic exchange studies to understand the role of amino acid changes in PfMDR1 have been limited to the carboxyl region that includes 1042N; replacement of the pfmdr1 3’ polymorphisms in CQ resistant progeny 3BA6 with the Dd2- allele (D1042N) did not significantly alter CQ response (Sidhu et al., 2005) but did not rule out that either the 5’ region (86Y, 184Y) and/or pfmdr1 CN influence CQR levels. The placement of D10 pfmdr1 3’ polymorphisms in the 7G8 background led to a 2-fold decrease in CQ response (Reed et al., 2000). When pressured with CQ, parasites with multiple pfmdr1 copies lose extra copies of the gene (Barnes et al., 1992; Peel et al., 1994), with no other mutation in pfmdr1 or pfcrt, suggesting that excessive copies may have a fitness cost. We found no difference in CQR levels attributable to CN. Moreover, most progeny with the Dd2 pfmdr1 allele do not carry the parental complement of 3 copies. CN change is commonly reported in response to in vitro drug pressure (Barnes et al., 1992; Chavchich et al., 2010; Wilson et al., 1989), and a reduction in CN has been observed after removal of artelinic acid pressure (Chen et al., 2010); the rate of CN loss and the final stable numbers of copies is a characteristic of individual parasite lines. We have observed that CN is stable in long-term culture in these progeny, suggesting that the relationship of allele combinations at pfmdr1 and pfcrt is fine-tuned. High CN thrives only in the context of its co-evolved genome that includes Dd2 type pfcrt, whereas CQS pfcrt prefers a single copy of pfmdr1 (Table S3).
Pfmdr1 knockdown by gene disruption for FCB (86Y, 184Y, and 1042N) showed no significant changes in CQ susceptibility (Sidhu et al., 2006). Association studies in natural CQ resistant populations have identified a significant role for pfmdr1 86Y and pfcrt 76T in CQR (Babiker et al., 2001; Mittra et al., 2006), but the presence and strength of these associations varies geographically. The frequencies of both these alleles are on the rise in regions of India under intense CQ selection (Mittra et al., 2006). However, in Thailand, where CQ is no longer used and MQ pressure led to increased pfmdr1 CN, CQ resistant parasites uniformly carry pfmdr1 86N (Price et al., 2004). An apparent conflict exists between 86Y and increased CN such that CN increases often associated with selection by MQ, artemisinin, and lumefantrine, coincides with the loss of 86Y (Uhlemann et al., 2007). It is unusual to find the 86Y mutation with increased CN, but it has been reported in natural isolates collected prior to emergence of MQ resistance (Looareesuwan et al., 1992; Sidhu et al., 2007; Uhlemann et al., 2005). Both point mutations in pfmdr1 and increased CN have been widely associated with fitness costs during asexual, erythrocytic growth in the absence of drug pressure in field isolates (Osman et al., 2007), allelic replacements (Hayward et al., 2005), and drug selected mutants (Preechapornkul et al., 2009).
It may be that the coincidence of 86Y and increased copy number is a transitional state that has been captured in the Dd2 line by in vitro MQ selection on W2. In the HB3 × Dd2 progeny, the combination of PfMDR1 86Y and PfCRT 76T confers only low-level CQR and the progeny that inherited 86N combined with a single copy of pfmdr1 have the highest CQR levels. This is consistent with the co-adapted combination of Dd2 alleles at these two loci reflecting a tradeoff between the level of CQR and fitness.
Classical genetics and QTL mapping can compliment gene manipulations using trasfection methods to explore the basic biology of CQR. Pfcrt mutations are well known to be at the center of CQR and its reversibility however accumulating evidence points to an important role for additional factors that influence these traits as well as parasite fitness. We show that many structurally distinct reversal agents restore CQ susceptibility through a PfCRT mechanism. Furthermore, although pfcrt is the determinant of large phenotypic differences between CQ resistant and CQS parasites, secondary loci can be identified for CQ susceptibility and reversibility. These loci can point to genes that may interact with the endogenous function of pfcrt or may cause effects through indirect physiological mechanisms. Understanding these interacting/alternative pathways and their co-selection by drug may illuminate the evolutionary path to CQR and, more importantly, refine strategist to limit new resistances.
Experimental procedures
Parasites, genotypes, and culturing
The HB3 (Honduras) and Dd2 (Indochina) clonal parental isolates and 35 clonal progeny lines are from the same cross previously used to construct the P. falciparum high-resolution genetic linkage map (Su et al., 1999; Wellems et al., 1990). Leukocyte-free human red blood cells (Indiana regional blood center,) were suspended in complete medium [RPMI 1640 with L-glutamine (Invitrogen) 50 mg/L hypoxanthine, and 25 mM HEPES; 0.5% Albumax I (Invitrogen), 10 mg/L gentamicin, and 0.225% NaHCO3] at 4% hematocrit and grown at 37°C in six-well culture plates, placed in a sealed environmental chamber (Billups-Rothenberg), and gassed daily (mixture of 5% CO2, 5% O2, and 90% N2). Lines were cultured for at least three cycles after thawing with a minimum doubling of parasitemia each 48 h cycle, prior to initiation of drug assays. No attempt was made to synchronize parasite cultures; however, the process of thawing yielded partially synchronous parasite stages. Dilutions to initiate assays were made from cultures between 1-5% parasitemia consisting of greater than 75% ring stages. To minimize chances of genotype-phenotype shifts resulting from mutation accumulation, parasite cultures were carried for a maximum of six weeks and replicate testing was conducted on stocks closest to the original progeny (stock cultures are frozen from short-term cultures).
Drug response assays
Drug stocks of chloroquine diphosphate (Sigma-Aldrich Co), verapamil hydrochloride (Sigma-Aldrich Co), chlorpheniramine maleate (Sigma-Aldrich Co), and amitriptyline hydrochloride (Sigma-Aldrich Co), were made in deionized water. A stock solution of citalopram hydrobromide (Fisher Scientific) was made in 100% ethanol. Stock solutions of probenecid (Avocado Research Chemicals) and desipramine (Sigma-Aldrich Co) were made in DMSO. All solutions were stored at -20°C until use. Dilutions from these stocks were made in low-hypoxanthine complete medium (low-HX CM; RPMI 1640 with L-glutamine, 2.94 μM HX, and 50 mM HEPES; 0.5% Albumax I, 10 μg/mL gentamicin, and 0.225% NaHCO3). Drug assays based on [3H]-hypoxanthine incorporation were performed as previously described (Ferdig et al., 2004); each biological replication was conducted independently on different days for each parasite line. For inclusion in the assay, each progeny clone was genotyped using a panel of 10 MS markers to ensure clonality and confirm identity.
Percent inhibition was calculated by the formula:
IC50 values were determined by fitting data to a non-linear sigmoidal dose-response curve (variable slope) using GraphPad Prism v4.0 software. Log transformed mean dose response values were obtained from 5-22 independent measurements and were used for QTL analysis.
Isobologram analysis
To determine the presence and degree of reversibility in the parents of the genetic cross, two-fold serial dilutions of the drug combinations of CQ and reversal agents were prepared using fixed ratios. The starting concentrations of reversal agents for the serial dilutions were adjusted to approximately center the IC50 doses in the range tested. The following CQ : reversal agent volumetric ratios were used: 10:0, 9:1, 8:2, 7:3, 5:5, 3:7, 2:8, 1:9, and 0:10. The first and last ratios include only one drug, either CQ or the reversal agent. FIC were determined for each drug combination for both HB3 and Dd2 using the formula:
Additivity was defined as a FIC = 1 and synergism (reversibility) was defined as a FIC of ≤ 0.5 (points lying below the diagonal line of additivity). The fixed dose ratio with the lowest concentration of reversal agent that showed a synergistic interaction with CQ was used for tests in the progeny.
QTL analyses
Genome-wide scans were performed using R/QTL (Broman et al., 2003) to detect single and interacting QTL associated with drug responses in the HB3 × Dd2 genetic cross. Drug responses were log transformed to approximate a normal distribution. Genome-wide significance thresholds were determined by permutation testing (n=1000 permutations) (Doerge and Churchill, 1996) and the strength of linkage of a locus to the trait was expressed as a logarithm of odds (LOD) score. Loci that exceeded the 99th percentile (p < 0.01), 95th percentile (p < 0.05), and 37th percentile (p < 0.63) were used to identify highly significant, significant, and suggestive QTL, respectively. The combined effects of all QTL detected for each trait were determined by multiple regression analysis for all significant and suggestive QTL. Other statistical analyses were performed using GraphPad Prism v4.0. Allele effects were determined by calculating the phenotypic mean at the peak marker for each of the two possible genotypes.
Copy number determination
Pfmdr1 copy number was determined by TaqMan real-time PCR using an ABI 7700 as reported previously (Rohrbach et al., 2006). The pfmdr1 probe was FAMTM (6-carboxyfluorescein) labeled at the 5’ end, and the α-tubulin control probe was VICTM labeled. Forty cycles were performed and fluorescence data were expressed as normalized reporter signals, calculated by dividing the amount of reporter signal by the passive reference signal. The assay was replicated four independent times and normalized to HB3.
Purification of Recombinant PfMDR1 and Reconstitution into PLs
High level expression of various isoforms of PfMDR1 with C-terminal-hexaHis detection tags via the pPICZc expression vector (Invitrogen) in P. pastoris has been reported previously (Amoah et al., 2007; Lekostaj et al., 2008a). Yeast were grown under standard conditions, induced with 0.5% methanol medium for 21 h, mechanically lysed via a modified glass bead method and membranes harboring PfMDR1 were isolated as described (Amoah et al., 2007; Fritz et al., 1999). Proteoliposomes (PL) harboring purified PfMDR1 were prepared using methods described earlier for PfCRT (Lekostaj et al., 2008b). In brief, total protein was determined using the amido black assay, crude yeast membranes (CM) were solubilized with dodecyl maltoside (DM), and protein purified by nickel chelation chromatography. CMs were diluted to 2 mg/ml in a Tris-based wash buffer [50 mM Tris-HCl, 250 mM sucrose, 20% (v/v) glycerol, and 1 mM MgCl2 (pH 7.5), supplemented with 3 M NaCl] and centrifuged at 100,000g for 1 h. The washed pellet was resuspended at 2 mg/mL in solubilization buffer (wash buffer supplemented with 500 mM NaCl and 1% DM). The sample was rotated for 30 min, and centrifuged for 1 h at 100,000g. The detergent extract was then applied to a His GraviTrap column (GE Healthcare) and allowed to flow through via gravity. The column was washed with several bed volumes of 20 mM imidazole to remove nonspecifically bound proteins, and PfMDR1 was eluted with 500 mM imidazole, into polar Escherichia coli lipid suspension at a final concentration of 1.2% lipid. Protein-lipid mixtures were rotated gently for 30 min and then dialyzed against 50 mM Tris-HCl, 250 mM sucrose, and 1 mM EDTA (pH 7.5) for 20 h. Purified PfMDR1 PLs were centrifuged for 1 h at 100,000g, pellets were resuspended in fresh dialysis buffer, and snap-frozen in dry ice-ethanol. Purified protein levels were redetermined using the amido black assay.
Drug Competition with AzBCQ Photolabeling
The synthesis of AzBCQ and optimization of photolabeling conditions within a 96 well plate format has been described in detail previously (Lekostaj et al., 2008b). Experiments with PfMDR1 PLs were carried out with minor modifications (Pleeter et al., 2010). Briefly, a fixed amount (4.0 μg per well) of purified PL protein was diluted in a 50 mM Mes-Tris buffer at pH 5.2. The PL-buffer solution was aliquoted into wells of a 96-well UV transparent plate. Either buffer or competing drug solution was added to each respective well, followed by the addition of 0.5 mM AzBCQ. The plate was shaken at 650 rpm for 30 s and then incubated for 10 min at 37°C in a water bath. The plate was then exposed to UV radiation (254 nm maximum) at 1 cm distance lamp for 10 min. The reaction was quenched with the addition of an equal volume of Laemmli sample buffer. The samples were again incubated for 10 min at 37°C, divided in half, and loaded onto 2 parallel 7.5% bis-acrylamide Tris-HCl gels. For AzBCQ photolabeling detection, blots were blocked in 10% milk and probed with streptavidin-HRP (1:400). For quantitation of PfMDR1 protein present, C-terminal hexaHis tags were probed with the Qiagen PentaHis detection kit according to the manufacturer’s instructions (Lekostaj et al., 2008b).
Supplementary Material
Acknowledgments
This work was supported by NIH grants AI055035 and AI071121 (MTF), grant AI071121 (RAC), and AI052312 (PDR). We are grateful to Tom Wellems and Xin-zhuan Su for developing the genetic system that underpins this QTL approach. We thank Karen Hayton for critical comments, Upeka Samarakoon for help with copy number analysis, and Michelle Paguio and Jacqueline Lekostaj for advice and help with proteoliposomes.
References
- Adagu IS, Warhurst DC. Plasmodium falciparum: linkage disequilibrium between loci in chromosomes 7 and 5 and chloroquine selective pressure in Northern Nigeria. Parasitology. 2001;123:219–224. doi: 10.1017/s0031182001008344. [DOI] [PubMed] [Google Scholar]
- Adovelande J, Deleze J, Schrevel J. Synergy between two calcium channel blockers, verapamil and fantofarone (SR33557), in reversing chloroquine resistance in Plasmodium falciparum. Biochem Pharmacol. 1998;55:433–440. doi: 10.1016/s0006-2952(97)00482-6. [DOI] [PubMed] [Google Scholar]
- Amoah LE, Lekostaj JK, Roepe PD. Heterologous expression and ATPase activity of mutant versus wild type PfMDR1 protein. Biochemistry. 2007;46:6060–6073. doi: 10.1021/bi7002026. [DOI] [PubMed] [Google Scholar]
- Babiker HA, Pringle SJ, Abdel-Muhsin A, Mackinnon M, Hunt P, Walliker D. High-level chloroquine resistance in Sudanese isolates of Plasmodium falciparum is associated with mutations in the chloroquine resistance transporter gene pfcrt and the multidrug resistance Gene pfmdr1. J Infect Dis. 2001;183:1535–1538. doi: 10.1086/320195. [DOI] [PubMed] [Google Scholar]
- Barnes DA, Foote SJ, Galatis D, Kemp DJ, Cowman AF. Selection for high-level chloroquine resistance results in deamplification of the pfmdr1 gene and increased sensitivity to mefloquine in Plasmodium falciparum. EMBO J. 1992;11:3067–3075. doi: 10.1002/j.1460-2075.1992.tb05378.x. [DOI] [PMC free article] [PubMed] [Google Scholar]
- Bennett TN, Kosar AD, Ursos LM, Dzekunov S, Singh Sidhu AB, Fidock DA, Roepe PD. Drug resistance-associated pfCRT mutations confer decreased Plasmodium falciparum digestive vacuolar pH. Mol Biochem Parasitol. 2004;133:99–114. doi: 10.1016/j.molbiopara.2003.09.008. [DOI] [PubMed] [Google Scholar]
- Best Plummer W, Pinto Pereira LM, Carrington CV. Pfcrt and pfmdr1 alleles associated with chloroquine resistance in Plasmodium falciparum from Guyana, South America. Mem Inst Oswaldo Cruz. 2004;99:389–392. doi: 10.1590/s0074-02762004000400008. [DOI] [PubMed] [Google Scholar]
- Bhattacharjee AK, Kyle DE, Vennerstrom JL. Structural analysis of chloroquine resistance reversal by imipramine analogs. Antimicrob Agents Chemother. 2001;45:2655–2657. doi: 10.1128/AAC.45.9.2655-2657.2001. [DOI] [PMC free article] [PubMed] [Google Scholar]
- Bhattacharjee AK, Kyle DE, Vennerstrom JL, Milhous WK. A 3D QSAR pharmacophore model and quantum chemical structure--activity analysis of chloroquine(CQ)-resistance reversal. J Chem Inf Comput Sci. 2002;42:1212–1220. doi: 10.1021/ci0200265. [DOI] [PubMed] [Google Scholar]
- Bray PG, Mungthin M, Ridley RG, Ward SA. Access to hematin: the basis of chloroquine resistance. Mol Pharmacol. 1998;54:170–179. doi: 10.1124/mol.54.1.170. [DOI] [PubMed] [Google Scholar]
- Bray PG, Ward SA. A comparison of the phenomenology and genetics of multidrug resistance in cancer cells and quinoline resistance in Plasmodium falciparum. Pharmacol Ther. 1998;77:1–28. doi: 10.1016/s0163-7258(97)00083-1. [DOI] [PubMed] [Google Scholar]
- Bray PG, Deed S, Fox E, Kalkanidis M, Mungthin M, Deady LW, Tilley L. Primaquine synergises the activity of chloroquine against chloroquine-resistant P. falciparum. Biochem Pharmacol. 2005;70:1158–1166. doi: 10.1016/j.bcp.2005.07.021. [DOI] [PubMed] [Google Scholar]
- Brockman A, Price RN, van Vugt M, Heppner DG, Walsh D, Sookto P, et al. Plasmodium falciparum antimalarial drug susceptibility on the north-western border of Thailand during five years of extensive use of artesunate-mefloquine. Trans R Soc Trop Med Hyg. 2000;94:537–544. doi: 10.1016/s0035-9203(00)90080-4. [DOI] [PMC free article] [PubMed] [Google Scholar]
- Broman KW, Wu H, Sen S, Churchill GA. R/qtl: QTL mapping in experimental crosses. Bioinformatics. 2003;19:889–890. doi: 10.1093/bioinformatics/btg112. [DOI] [PubMed] [Google Scholar]
- Campbell CC, Collins WE, Nguyen-Dinh P, Barber A, Broderson JR. Plasmodium falciparum gametocytes from culture in vitro develop to sporozoites that are infectious to primates. Science. 1982;217:1048–1050. doi: 10.1126/science.7051285. [DOI] [PubMed] [Google Scholar]
- Chavchich M, Gerena L, Peters J, Chen N, Cheng Q, Kyle DE. Role of pfmdr1 amplification and expression in induction of resistance to artemisinin derivatives in Plasmodium falciparum. Antimicrob Agents Chemother. 2010;54:2455–2464. doi: 10.1128/AAC.00947-09. [DOI] [PMC free article] [PubMed] [Google Scholar]
- Chen N, Russell B, Fowler E, Peters J, Cheng Q. Levels of chloroquine resistance in Plasmodium falciparum are determined by loci other than pfcrt and pfmdr1. J Infect Dis. 2002;185:405–407. doi: 10.1086/338470. [DOI] [PubMed] [Google Scholar]
- Chen N, Kyle DE, Pasay C, Fowler EV, Baker J, Peters JM, Cheng Q. pfcrt Allelic types with two novel amino acid mutations in chloroquine-resistant Plasmodium falciparum isolates from the Philippines. Antimicrob Agents Chemother. 2003;47:3500–3505. doi: 10.1128/AAC.47.11.3500-3505.2003. [DOI] [PMC free article] [PubMed] [Google Scholar]
- Chen N, Chavchich M, Peters JM, Kyle DE, Gatton ML, Cheng Q. Deamplification of pfmdr1-containing amplicon on chromosome 5 in Plasmodium falciparum is associated with reduced resistance to artelinic acid in vitro. Antimicrob Agents Chemother. 2010;54:3395–3401. doi: 10.1128/AAC.01421-09. [DOI] [PMC free article] [PubMed] [Google Scholar]
- Contreras CE, Cortese JF, Caraballo A, Plowe CV. Genetics of drug-resistant Plasmodium falciparum malaria in the Venezuelan state of Bolivar. Am J Trop Med Hyg. 2002;67:400–405. doi: 10.4269/ajtmh.2002.67.400. [DOI] [PubMed] [Google Scholar]
- Cooper RA, Ferdig MT, Su XZ, Ursos LM, Mu J, Nomura T, et al. Alternative mutations at position 76 of the vacuolar transmembrane protein PfCRT are associated with chloroquine resistance and unique stereospecific quinine and quinidine responses in Plasmodium falciparum. Mol Pharmacol. 2002;61:35–42. doi: 10.1124/mol.61.1.35. [DOI] [PubMed] [Google Scholar]
- Cowman AF, Galatis D, Thompson JK. Selection for mefloquine resistance in Plasmodium falciparum is linked to amplification of the pfmdr1 gene and cross-resistance to halofantrine and quinine. Proc Natl Acad Sci U S A. 1994;91:1143–1147. doi: 10.1073/pnas.91.3.1143. [DOI] [PMC free article] [PubMed] [Google Scholar]
- Djimde A, Doumbo OK, Cortese JF, Kayentao K, Doumbo S, Diourte Y, et al. A molecular marker for chloroquine-resistant falciparum malaria. N Engl J Med. 2001;344:257–263. doi: 10.1056/NEJM200101253440403. [DOI] [PubMed] [Google Scholar]
- Doerge RW, Churchill GA. Permutation tests for multiple loci affecting a quantitative character. Genetics. 1996;142:285–294. doi: 10.1093/genetics/142.1.285. [DOI] [PMC free article] [PubMed] [Google Scholar]
- Duraisingh MT, Cowman AF. Contribution of the pfmdr1 gene to antimalarial drug-resistance. Acta Trop. 2005;94:181–190. doi: 10.1016/j.actatropica.2005.04.008. [DOI] [PubMed] [Google Scholar]
- Durrand V, Berry A, Sem R, Glaziou P, Beaudou J, Fandeur T. Variations in the sequence and expression of the Plasmodium falciparum chloroquine resistance transporter (Pfcrt) and their relationship to chloroquine resistance in vitro. Mol Biochem Parasitol. 2004;136:273–285. doi: 10.1016/j.molbiopara.2004.03.016. [DOI] [PubMed] [Google Scholar]
- Elion GB, Singer S, Hitchings GH. Antagonists of nucleic acid derivatives. VIII. Synergism in combinations of biochemically related antimetabolites. J Biol Chem. 1954;208:477–488. [PubMed] [Google Scholar]
- Ferdig MT, Cooper RA, Mu J, Deng B, Joy DA, Su XZ, Wellems TE. Dissecting the loci of low-level quinine resistance in malaria parasites. Mol Microbiol. 2004;52:985–997. doi: 10.1111/j.1365-2958.2004.04035.x. [DOI] [PubMed] [Google Scholar]
- Fidock DA, Nomura T, Talley AK, Cooper RA, Dzekunov SM, Ferdig MT, et al. Mutations in the P. falciparum digestive vacuole transmembrane protein PfCRT and evidence for their role in chloroquine resistance. Mol Cell. 2000;6:861–871. doi: 10.1016/s1097-2765(05)00077-8. [DOI] [PMC free article] [PubMed] [Google Scholar]
- Foote SJ, Thompson JK, Cowman AF, Kemp DJ. Amplification of the multidrug resistance gene in some chloroquine-resistant isolates of P. falciparum. Cell. 1989;57:921–930. doi: 10.1016/0092-8674(89)90330-9. [DOI] [PubMed] [Google Scholar]
- Foote SJ, Kyle DE, Martin RK, Oduola AM, Forsyth K, Kemp DJ, Cowman AF. Several alleles of the multidrug-resistance gene are closely linked to chloroquine resistance in Plasmodium falciparum. Nature. 1990;345:255–258. doi: 10.1038/345255a0. [DOI] [PubMed] [Google Scholar]
- Fritz F, Howard EM, Hoffman MM, Roepe PD. Evidence for altered ion transport in Saccharomyces cerevisiae overexpressing human MDR 1 protein. Biochemistry. 1999;38:4214–4226. doi: 10.1021/bi981929n. [DOI] [PubMed] [Google Scholar]
- Gerena L, Bass GT, Sr, Kyle DE, Oduola AM, Milhous WK, Martin RK. Fluoxetine hydrochloride enhances in vitro susceptibility to chloroquine in resistant Plasmodium falciparum. Antimicrob Agents Chemother. 1992;36:2761–2765. doi: 10.1128/aac.36.12.2761. [DOI] [PMC free article] [PubMed] [Google Scholar]
- Ginsburg H. Should chloroquine be laid to rest? Acta Trop. 2005;96:16–23. doi: 10.1016/j.actatropica.2005.06.021. [DOI] [PubMed] [Google Scholar]
- Hastings IM, Bray PG, Ward SA. Parasitology. A requiem for chloroquine. Science. 2002;298:74–75. doi: 10.1126/science.1077573. [DOI] [PubMed] [Google Scholar]
- Hayton K, Su XZ. Genetic and biochemical aspects of drug resistance in malaria parasites. Curr Drug Targets Infect Disord. 2004;4:1–10. doi: 10.2174/1568005043480925. [DOI] [PubMed] [Google Scholar]
- Hayward R, Saliba KJ, Kirk K. pfmdr1 mutations associated with chloroquine resistance incur a fitness cost in Plasmodium falciparum. Mol Microbiol. 2005;55:1285–1295. doi: 10.1111/j.1365-2958.2004.04470.x. [DOI] [PubMed] [Google Scholar]
- Johnson DJ, Fidock DA, Mungthin M, Lakshmanan V, Sidhu AB, Bray PG, Ward SA. Evidence for a central role for PfCRT in conferring Plasmodium falciparum resistance to diverse antimalarial agents. Mol Cell. 2004;15:867–877. doi: 10.1016/j.molcel.2004.09.012. [DOI] [PMC free article] [PubMed] [Google Scholar]
- Krogstad DJ, Gluzman IY, Kyle DE, Oduola AM, Martin SK, Milhous WK, Schlesinger PH. Efflux of chloroquine from Plasmodium falciparum: mechanism of chloroquine resistance. Science. 1987;238:1283–1285. doi: 10.1126/science.3317830. [DOI] [PubMed] [Google Scholar]
- Kublin JG, Cortese JF, Njunju EM, Mukadam RA, Wirima JJ, Kazembe PN, et al. Reemergence of chloroquine-sensitive Plasmodium falciparum malaria after cessation of chloroquine use in Malawi. J Infect Dis. 2003;187:1870–1875. doi: 10.1086/375419. [DOI] [PubMed] [Google Scholar]
- Kyle DE, Oduola AM, Martin SK, Milhous WK. Plasmodium falciparum: modulation by calcium antagonists of resistance to chloroquine, desethylchloroquine, quinine, and quinidine in vitro. Trans R Soc Trop Med Hyg. 1990;84:474–478. doi: 10.1016/0035-9203(90)90004-x. [DOI] [PubMed] [Google Scholar]
- Lakshmanan V, Bray PG, Verdier-Pinard D, Johnson DJ, Horrocks P, Muhle RA, et al. A critical role for PfCRT K76T in Plasmodium falciparum verapamil-reversible chloroquine resistance. Embo J. 2005;24:2294–2305. doi: 10.1038/sj.emboj.7600681. [DOI] [PMC free article] [PubMed] [Google Scholar]
- Laufer MK, Takala-Harrison S, Dzinjalamala FK, Stine OC, Taylor TE, Plowe CV. Return of chloroquine-susceptible falciparum malaria in Malawi was a reexpansion of diverse susceptible parasites. J Infect Dis. 2010;202:801–808. doi: 10.1086/655659. [DOI] [PMC free article] [PubMed] [Google Scholar]
- Lehane AM, Kirk K. Efflux of a range of antimalarial drugs and ‘chloroquine resistance reversers’ from the digestive vacuole in malaria parasites with mutant PfCRT. Mol Microbiol. 2010 doi: 10.1111/j.1365-2958.2010.07272.x. Epub ahead of print. [DOI] [PubMed] [Google Scholar]
- Lekostaj JK, Amoah LE, Roepe PD. A single S1034C mutation confers altered drug sensitivity to PfMDR1 ATPase activity that is characteristic of the 7G8 isoform. Mol Biochem Parasitol. 2008a;157:107–111. doi: 10.1016/j.molbiopara.2007.09.008. [DOI] [PMC free article] [PubMed] [Google Scholar]
- Lekostaj JK, Natarajan JK, Paguio MF, Wolf C, Roepe PD. Photoaffinity labeling of the Plasmodium falciparum chloroquine resistance transporter with a novel perfluorophenylazido chloroquine. Biochemistry. 2008b;47:10394–10406. doi: 10.1021/bi8010658. [DOI] [PMC free article] [PubMed] [Google Scholar]
- Lim AS, Cowman AF. Plasmodium falciparum: chloroquine selection of a cloned line and DNA rearrangements. Exp Parasitol. 1996;83:283–294. doi: 10.1006/expr.1996.0076. [DOI] [PubMed] [Google Scholar]
- Liu D, Cai X, Ren D, Liu R, Lin S, Zeng L, Tang X. Changes in chloroquine resistance of Plasmodium falciparum in Hainan province. Zhongguo Ji Sheng Chong Xue Yu Ji Sheng Chong Bing Za Zhi. 1999;17:32–34. [PubMed] [Google Scholar]
- Looareesuwan S, Kyle DE, Viravan C, Vanijanonta S, Wilairatana P, Charoenlarp P, et al. Treatment of patients with recrudescent falciparum malaria with a sequential combination of artesunate and mefloquine. Am J Trop Med Hyg. 1992;47:794–799. doi: 10.4269/ajtmh.1992.47.794. [DOI] [PubMed] [Google Scholar]
- Martin RE, Marchetti RV, Cowan AI, Howitt SM, Broer S, Kirk K. Chloroquine transport via the malaria parasite’s chloroquine resistance transporter. Science. 2009;325:1680–1682. doi: 10.1126/science.1175667. [DOI] [PubMed] [Google Scholar]
- Martin SK, Oduola AM, Milhous WK. Reversal of chloroquine resistance in Plasmodium falciparum by verapamil. Science. 1987;235:899–901. doi: 10.1126/science.3544220. [DOI] [PubMed] [Google Scholar]
- Martiney JA, Cerami A, Slater AF. Verapamil reversal of chloroquine resistance in the malaria parasite Plasmodium falciparum is specific for resistant parasites and independent of the weak base effect. J Biol Chem. 1995;270:22393–22398. doi: 10.1074/jbc.270.38.22393. [DOI] [PubMed] [Google Scholar]
- Masseno V, Muriithi S, Nzila A. In vitro chemosensitization of Plasmodium falciparum to antimalarials by verapamil and probenecid. Antimicrob Agents Chemother. 2009;53:3131–3134. doi: 10.1128/AAC.01689-08. [DOI] [PMC free article] [PubMed] [Google Scholar]
- McGrath T, Latoud C, Arnold ST, Safa AR, Felsted RL, Center MS. Mechanisms of multidrug resistance in HL60 cells. Analysis of resistance associated membrane proteins and levels of mdr gene expression. Biochem Pharmacol. 1989;38:3611–3619. doi: 10.1016/0006-2952(89)90134-2. [DOI] [PubMed] [Google Scholar]
- Mehlotra RK, Fujioka H, Roepe PD, Janneh O, Ursos LM, Jacobs-Lorena V, et al. Evolution of a unique Plasmodium falciparum chloroquine-resistance phenotype in association with pfcrt polymorphism in Papua New Guinea and South America. Proc Natl Acad Sci U S A. 2001;98:12689–12694. doi: 10.1073/pnas.221440898. [DOI] [PMC free article] [PubMed] [Google Scholar]
- Menezes CM, Kirchgatter K, Di Santi SM, Savalli C, Monteiro FG, Paula GA, Ferreira EI. In vitro chloroquine resistance modulation study on fresh isolates of Brazilian Plasmodium falciparum: intrinsic antimalarial activity of phenothiazine drugs. Mem Inst Oswaldo Cruz. 2002;97:1033–1039. doi: 10.1590/s0074-02762002000700018. [DOI] [PubMed] [Google Scholar]
- Menezes CM, Kirchgatter K, Di Santi SM, Savalli C, Monteiro FG, Paula GA, Ferreira EI. In vitro evaluation of verapamil and other modulating agents in Brazilian chloroquine-resistant Plasmodium falciparum isolates. Rev Soc Bras Med Trop. 2003;36:5–9. doi: 10.1590/s0037-86822003000100002. [DOI] [PubMed] [Google Scholar]
- Mita T, Kaneko A, Lum JK, Bwijo B, Takechi M, Zungu IL, et al. Recovery of chloroquine sensitivity and low prevalence of the Plasmodium falciparum chloroquine resistance transporter gene mutation K76T following the discontinuance of chloroquine use in Malawi. Am J Trop Med Hyg. 2003;68:413–415. [PubMed] [Google Scholar]
- Mittra P, Vinayak S, Chandawat H, Das MK, Singh N, Biswas S, et al. Progressive Increase in Point Mutations Associated with Chloroquine Resistance in Plasmodium falciparum Isolates from India. J Infect Dis. 2006;193:1304–1312. doi: 10.1086/502979. [DOI] [PubMed] [Google Scholar]
- Mu J, Ferdig MT, Feng X, Joy DA, Duan J, Furuya T, et al. Multiple transporters associated with malaria parasite responses to chloroquine and quinine. Mol Microbiol. 2003;49:977–989. doi: 10.1046/j.1365-2958.2003.03627.x. [DOI] [PubMed] [Google Scholar]
- Mu J, Awadalla P, Duan J, McGee KM, Joy DA, McVean GA, Su XZ. Recombination hotspots and population structure in Plasmodium falciparum. PLoS Biol. 2005;3:e335. doi: 10.1371/journal.pbio.0030335. [DOI] [PMC free article] [PubMed] [Google Scholar]
- Nzila A, Mberu E, Bray P, Kokwaro G, Winstanley P, Marsh K, Ward S. Chemosensitization of Plasmodium falciparum by probenecid in vitro. Antimicrob Agents Chemother. 2003;47:2108–2112. doi: 10.1128/AAC.47.7.2108-2112.2003. [DOI] [PMC free article] [PubMed] [Google Scholar]
- Oduola AM, Weatherly NF, Bowdre JH, Desjardins RE. Plasmodium falciparum: cloning by single-erythrocyte micromanipulation and heterogeneity in vitro. Exp Parasitol. 1988;66:86–95. doi: 10.1016/0014-4894(88)90053-7. [DOI] [PubMed] [Google Scholar]
- Orjih AU, Ryerse JS, Fitch CD. Hemoglobin catabolism and the killing of intraerythrocytic Plasmodium falciparum by chloroquine. Experientia. 1994;50:34–39. doi: 10.1007/BF01992046. [DOI] [PubMed] [Google Scholar]
- Osman ME, Mockenhaupt FP, Bienzle U, Elbashir MI, Giha HA. Field-based evidence for linkage of mutations associated with chloroquine (pfcrt/pfmdr1) and sulfadoxine-pyrimethamine (pfdhfr/pfdhps) resistance and for the fitness cost of multiple mutations in P. falciparum. Infect Genet Evol. 2007;7:52–59. doi: 10.1016/j.meegid.2006.03.008. [DOI] [PubMed] [Google Scholar]
- Paguio MF, Cabrera M, Roepe PD. Chloroquine transport in Plasmodium falciparum. 2. Analysis of PfCRT-mediated drug transport using proteoliposomes and a fluorescent chloroquine probe. Biochemistry. 2009;48:9482–9491. doi: 10.1021/bi901035j. [DOI] [PMC free article] [PubMed] [Google Scholar]
- Peel SA, Bright P, Yount B, Handy J, Baric RS. A strong association between mefloquine and halofantrine resistance and amplification, overexpression, and mutation in the P-glycoprotein gene homolog (pfmdr) of Plasmodium falciparum in vitro. Am J Trop Med Hyg. 1994;51:648–658. doi: 10.4269/ajtmh.1994.51.648. [DOI] [PubMed] [Google Scholar]
- Peters W, Ekong R, Robinson BL, Warhurst DC, Pan XQ. Antihistaminic drugs that reverse chloroquine resistance in Plasmodium falciparum. Lancet. 1989;2:334–335. doi: 10.1016/s0140-6736(89)90522-9. [DOI] [PubMed] [Google Scholar]
- Peters W, Ekong R, Robinson BL, Warhurst DC, Pan XQ. The chemotherapy of rodent malaria. XLV. Reversal of chloroquine resistance in rodent and human Plasmodium by antihistaminic agents. Ann Trop Med Parasitol. 1990;84:541–551. doi: 10.1080/00034983.1990.11812509. [DOI] [PubMed] [Google Scholar]
- Pleeter P, Lekostaj JK, Roepe PD. Purified Plasmodium falciparum multi-drug resistance protein (PfMDR 1) binds a high affinity chloroquine analogue. Mol Biochem Parasitol. 2010;173:158–161. doi: 10.1016/j.molbiopara.2010.05.012. [DOI] [PMC free article] [PubMed] [Google Scholar]
- Plowe CV. Monitoring antimalarial drug resistance: making the most of the tools at hand. J Exp Biol. 2003;206:3745–3752. doi: 10.1242/jeb.00658. [DOI] [PubMed] [Google Scholar]
- Pradines B, Pages JM, Barbe J. Chemosensitizers in drug transport mechanisms involved in protozoan resistance. Curr Drug Targets Infect Disord. 2005;5:411–431. doi: 10.2174/156800505774912875. [DOI] [PubMed] [Google Scholar]
- Preechapornkul P, Imwong M, Chotivanich K, Pongtavornpinyo W, Dondorp AM, Day NP, et al. Plasmodium Falciparum Pfmdr1 Amplification, Mefloquine Resistance, and Parasite Fitness. Antimicrob Agents Chemother. 2009 doi: 10.1128/AAC.00241-08. [DOI] [PMC free article] [PubMed] [Google Scholar]
- Price RN, Uhlemann AC, Brockman A, McGready R, Ashley E, Phaipun L, et al. Mefloquine resistance in Plasmodium falciparum and increased pfmdr1 gene copy number. Lancet. 2004;364:438–447. doi: 10.1016/S0140-6736(04)16767-6. [DOI] [PMC free article] [PubMed] [Google Scholar]
- Rason MA, Andrianantenaina HB, Ariey F, Raveloson A, Domarle O, Randrianarivelojosia M. Prevalent pfmdr1 n86y mutant Plasmodium falciparum in Madagascar despite absence of pfcrt mutant strains. Am J Trop Med Hyg. 2007;76:1079–1083. [PubMed] [Google Scholar]
- Reed MB, Saliba KJ, Caruana SR, Kirk K, Cowman AF. Pgh1 modulates sensitivity and resistance to multiple antimalarials in Plasmodium falciparum. Nature. 2000;403:906–909. doi: 10.1038/35002615. [DOI] [PubMed] [Google Scholar]
- Roepe PD, Martiney JA. Are ion-exchange processes central to understanding drug-resistance phenomena? Trends Pharmacol Sci. 1999;20:62–65. doi: 10.1016/s0165-6147(98)01282-6. [DOI] [PubMed] [Google Scholar]
- Rogan AM, Hamilton TC, Young RC, Klecker RW, Jr, Ozols RF. Reversal of adriamycin resistance by verapamil in human ovarian cancer. Science. 1984;224:994–996. doi: 10.1126/science.6372095. [DOI] [PubMed] [Google Scholar]
- Rohrbach P, Sanchez CP, Hayton K, Friedrich O, Patel J, Sidhu AB, et al. Genetic linkage of pfmdr1 with food vacuolar solute import in Plasmodium falciparum. Embo J. 2006;25:3000–3011. doi: 10.1038/sj.emboj.7601203. [DOI] [PMC free article] [PubMed] [Google Scholar]
- Sa JM, Twu O, Hayton K, Reyes S, Fay MP, Ringwald P, Wellems TE. Geographic patterns of Plasmodium falciparum drug resistance distinguished by differential responses to amodiaquine and chloroquine. Proc Natl Acad Sci U S A. 2009;106:18883–18889. doi: 10.1073/pnas.0911317106. [DOI] [PMC free article] [PubMed] [Google Scholar]
- Sanchez CP, Stein W, Lanzer M. Trans stimulation provides evidence for a drug efflux carrier as the mechanism of chloroquine resistance in Plasmodium falciparum. Biochemistry. 2003;42:9383–9394. doi: 10.1021/bi034269h. [DOI] [PubMed] [Google Scholar]
- Sanchez CP, McLean JE, Stein W, Lanzer M. Evidence for a substrate specific and inhibitable drug efflux system in chloroquine resistant Plasmodium falciparum strains. Biochemistry. 2004;43:16365–16373. doi: 10.1021/bi048241x. [DOI] [PubMed] [Google Scholar]
- Sanchez CP, McLean JE, Rohrbach P, Fidock DA, Stein WD, Lanzer M. Evidence for a pfcrt-associated chloroquine efflux system in the human malarial parasite Plasmodium falciparum. Biochemistry. 2005;44:9862–9870. doi: 10.1021/bi050061f. [DOI] [PubMed] [Google Scholar]
- Sanchez CP, Rotmann A, Stein WD, Lanzer M. Polymorphisms within PfMDR1 alter the substrate specificity for anti-malarial drugs in Plasmodium falciparum. Mol Microbiol. 2008;70:786–798. doi: 10.1111/j.1365-2958.2008.06413.x. [DOI] [PubMed] [Google Scholar]
- Sen S, Ferdig M. QTL analysis for discovery of genes involved in drug responses. Curr Drug Targets Infect Disord. 2004;4:53–63. doi: 10.2174/1568005043480916. [DOI] [PubMed] [Google Scholar]
- Shen DW, Fojo A, Chin JE, Roninson IB, Richert N, Pastan I, Gottesman MM. Human multidrug-resistant cell lines: increased mdr1 expression can precede gene amplification. Science. 1986;232:643–645. doi: 10.1126/science.3457471. [DOI] [PubMed] [Google Scholar]
- Sidhu AB, Verdier-Pinard D, Fidock DA. Chloroquine resistance in Plasmodium falciparum malaria parasites conferred by pfcrt mutations. Science. 2002;298:210–213. doi: 10.1126/science.1074045. [DOI] [PMC free article] [PubMed] [Google Scholar]
- Sidhu AB, Valderramos SG, Fidock DA. pfmdr1 mutations contribute to quinine resistance and enhance mefloquine and artemisinin sensitivity in Plasmodium falciparum. Mol Microbiol. 2005;57:913–926. doi: 10.1111/j.1365-2958.2005.04729.x. [DOI] [PubMed] [Google Scholar]
- Sidhu AB, Uhlemann AC, Valderramos SG, Valderramos JC, Krishna S, Fidock DA. Decreasing pfmdr1 Copy Number in Plasmodium falciparum Malaria Heightens Susceptibility to Mefloquine, Lumefantrine, Halofantrine, Quinine, and Artemisinin. J Infect Dis. 2006;194:528–535. doi: 10.1086/507115. [DOI] [PMC free article] [PubMed] [Google Scholar]
- Sidhu AB, Sun Q, Nkrumah LJ, Dunne MW, Sacchettini JC, Fidock DA. In vitro efficacy, resistance selection, and structural modeling studies implicate the malarial parasite apicoplast as the target of azithromycin. J Biol Chem. 2007;282:2494–2504. doi: 10.1074/jbc.M608615200. [DOI] [PubMed] [Google Scholar]
- Su X, Kirkman LA, Fujioka H, Wellems TE. Complex polymorphisms in an approximately 330 kDa protein are linked to chloroquine-resistant P. falciparum in Southeast Asia and Africa. Cell. 1997;91:593–603. doi: 10.1016/s0092-8674(00)80447-x. [DOI] [PubMed] [Google Scholar]
- Su X, Ferdig MT, Huang Y, Huynh CQ, Liu A, You J, et al. A genetic map and recombination parameters of the human malaria parasite Plasmodium falciparum. Science. 1999;286:1351–1353. doi: 10.1126/science.286.5443.1351. [DOI] [PubMed] [Google Scholar]
- Thaithong S, Beale GH, Chutmongkonkul M. Susceptibility of Plasmodium falciparum to five drugs: an in vitro study of isolates mainly from Thailand. Trans R Soc Trop Med Hyg. 1983;77:228–231. doi: 10.1016/0035-9203(83)90080-9. [DOI] [PubMed] [Google Scholar]
- Tsuruo T, Iida H, Tsukagoshi S, Sakurai Y. Increased accumulation of vincristine and adriamycin in drug-resistant P388 tumor cells following incubation with calcium antagonists and calmodulin inhibitors. Cancer Res. 1982;42:4730–4733. [PubMed] [Google Scholar]
- Uhlemann AC, Ramharter M, Lell B, Kremsner PG, Krishna S. Amplification of Plasmodium falciparum multidrug resistance gene 1 in isolates from Gabon. J Infect Dis. 2005;192:1830–1835. doi: 10.1086/497337. [DOI] [PubMed] [Google Scholar]
- Uhlemann AC, McGready R, Ashley EA, Brockman A, Singhasivanon P, Krishna S, et al. Intrahost selection of Plasmodium falciparum pfmdr1 alleles after antimalarial treatment on the northwestern border of Thailand. J Infect Dis. 2007;195:134–141. doi: 10.1086/509809. [DOI] [PMC free article] [PubMed] [Google Scholar]
- Ursos LM, Dzekunov SM, Roepe PD. The effects of chloroquine and verapamil on digestive vacuolar pH of P. falciparum either sensitive or resistant to chloroquine. Mol Biochem Parasitol. 2000;110:125–134. doi: 10.1016/s0166-6851(00)00262-0. [DOI] [PubMed] [Google Scholar]
- Valderramos SG, Valderramos JC, Musset L, Purcell LA, Mercereau-Puijalon O, Legrand E, Fidock DA. Identification of a mutant PfCRT-mediated chloroquine tolerance phenotype in Plasmodium falciparum. PLoS Pathog. 2010;6:e1000887. doi: 10.1371/journal.ppat.1000887. [DOI] [PMC free article] [PubMed] [Google Scholar]
- Vieira PP, Ferreira MU, Alecrim MG, Alecrim WD, da Silva LH, Sihuincha MM, et al. pfcrt Polymorphism and the spread of chloroquine resistance in Plasmodium falciparum populations across the Amazon Basin. J Infect Dis. 2004;190:417–424. doi: 10.1086/422006. [DOI] [PubMed] [Google Scholar]
- Wellems TE, Panton LJ, Gluzman IY, do Rosario VE, Gwadz RW, Walker-Jonah A, Krogstad DJ. Chloroquine resistance not linked to mdr-like genes in a Plasmodium falciparum cross. Nature. 1990;345:253–255. doi: 10.1038/345253a0. [DOI] [PubMed] [Google Scholar]
- Wellems TE, Walker-Jonah A, Panton LJ. Genetic mapping of the chloroquine-resistance locus on Plasmodium falciparum chromosome 7. Proc Natl Acad Sci U S A. 1991;88:3382–3386. doi: 10.1073/pnas.88.8.3382. [DOI] [PMC free article] [PubMed] [Google Scholar]
- Wellems TE, Plowe CV. Chloroquine-resistant malaria. J Infect Dis. 2001;184:770–776. doi: 10.1086/322858. [DOI] [PubMed] [Google Scholar]
- Wellems TE. Transporter of a malaria catastrophe. Nat Med. 2004;10:1169–1171. doi: 10.1038/nm1104-1169. [DOI] [PubMed] [Google Scholar]
- Wilson CM, Serrano AE, Wasley A, Bogenschutz MP, Shankar AH, Wirth DF. Amplification of a gene related to mammalian mdr genes in drug-resistant Plasmodium falciparum. Science. 1989;244:1184–1186. doi: 10.1126/science.2658061. [DOI] [PubMed] [Google Scholar]
- Wootton JC, Feng X, Ferdig MT, Cooper RA, Mu J, Baruch DI, et al. Genetic diversity and chloroquine selective sweeps in Plasmodium falciparum. Nature. 2002;418:320–323. doi: 10.1038/nature00813. [DOI] [PubMed] [Google Scholar]
- Yayon A, Cabantchik ZI, Ginsburg H. Identification of the acidic compartment of Plasmodium falciparum-infected human erythrocytes as the target of the antimalarial drug chloroquine. Embo J. 1984;3:2695–2700. doi: 10.1002/j.1460-2075.1984.tb02195.x. [DOI] [PMC free article] [PubMed] [Google Scholar]
- Zhang H, Paguio M, Roepe PD. The antimalarial drug resistance protein Plasmodium falciparum chloroquine resistance transporter binds chloroquine. Biochemistry. 2004;43:8290–8296. doi: 10.1021/bi049137i. [DOI] [PubMed] [Google Scholar]
Associated Data
This section collects any data citations, data availability statements, or supplementary materials included in this article.