Abstract
At this transplant center 1340 patients were entered on the liver transplant waiting list during the first 25 months {October 1987 to November 1989) after the initiation of the UNOS allocation system for liver grafts. Of these 972 (72.5%) of the patients received a graft, 120 (9.0%) died waiting for a graft, 109 (8.1%) remained on the active list as of the study endpoint of December 15, 1989, 123 (9.2%) were withdrawn from candidacy, and 16 (1.2%) received a transplant at another center. A total of 1201 patients were candidates for a first graft. Of the 812 primary candidates who received a graft, 64.8% received their graft within one month of entry on the waiting list. Of the 109 primary candidates who died before a graft could be found, 79.0% died within a month of entry onto the waiting list. At time of transplantation, 135 (16.6%) primary recipients of a graft were UNOS class 1, 326 (40.1%) were UNOS class 2, 190 (23.4%) were UNOS class 3, and 161 (19.8%) were UNOS class 4. Actuarial survival rates (percentage) at 6 months for recipients in UNOS class 1, class 2, class 3, and class 4 were 88.7±2.9, 82.6±2.1, 78.4±3.2, and 68.4±3.9, respectively (P<0.001). At the time of death of recipients who failed to get a graft, 6 (5.5%) were UNOS class 1, 14 (12.8%) were UNOS class 2, 23 (21.1%) were UNOS class 3, and 66 (60.6%) were UNOS class 4.
These results indicate that a high proportion of liver transplant candidates are in urgent need of a graft and that the UNOS system succeeds in giving these patients high priority. However patient mortality on the waiting list and after transplantation would lessen significantly if more patients with end-stage liver disease were referred to the transplant center in a timely manner before their condition reaches the point where the probability of survival is diminished.
Since October 1, 1987, the United Network for Organ Sharing has operated, under contract with the U.S. Department of Health and Human Services, a national system for the distribution of solid organs for transplantation. The allocation of livers for transplantation is presently based on a point system that gives highest priority to medical urgency and accumulated candidate waiting time (1).
We here report a retrospective analysis of the experience accumulated at a single center with 1340 candidates who were entered into a candidate registry over the first 25 months of the UNOS system. The data suggest that a high percentage of patients with end-stage liver illness are still referred for transplantation in advanced stages of disease when the best chance for survival has already passed them by. The UNOS point system gives these patients preferential access to organs, but mortality rates while on the waiting list and after transplantation are higher as a result.
MATERIALS AND METHODS
Database
Since 1985, a microcomputer database has been maintained of all patients entered into the liver transplant program at the University of Pittsburgh (2, 3). The records of 1340 patients entered into this database between October 1, 1987 and November 30, 1985 were reviewed. End-points for data analysis were date of transplantation, date of death, or December 15, 1989 for patients remaining on the active list and for calculation of survival for patients who received grafts. Variables analyzed included sex, age, ABO blood type, medical urgency (UNOS class), primary liver disease, waiting time, waiting list status (active, transplanted, still waiting), and patient survival.
The UNOS rating system for medical priority was revised from a six level to a four level classification during the period analyzed. For purposes of this review, each patient was reclassified according to four levels: (1) out of hospital, (2) hospital-dependent, (3) requiring intensive care, and (4) extremely urgent, including patients with fulminant failure, primary graft failure, and “UNOS STAT” patients.
Statistical analysis
Analysis of proportionality (chi square), means testing (analysis of variance), and nonparametric comparison of sample medians (k sample means test) were performed using SPSS/PC+ version 3.1 statistical analysis software (SPSS, Inc., Chicago, IL). Actuarial survival analysis was performed using the 1L module of BMDP/PC, 1988 release (BMDP Statistical Software, Los Angeles, CA). Differences were considered significant if P<0.05 and highly significant if P<0.01.
Exclusions
Data for sex, age, ABO blood type, and waiting list status were available for all patients. The exact date of entry was missing for only one patient, and this case was excluded from analysis of waiting time. For one recipient of a graft, the final pathological diagnosis of primary liver disease was not yet available and this case was excluded from analysis based on primary liver disease, In four cases, although the patients were known to have died while still waiting for a graft, the exact dates of death were not known and therefore these cases were excluded from analyses of waiting time. One date of death for a graft recipient was still undetermined and this patient was excluded from survival analysis.
RESULTS
Of the 1340 patients entered into the candidate registry, 112 (9.2%) were withdrawn from the active list and 16 (1.2%) were transplanted at other centers. Thus 1201 patients remained in the “active pool” of candidates for transplantation at this center. A total of 972 (72.5%) patients received a graft, 123 (9.2%) died before a graft could be found, and 109 (8.1%) remained on the active list at the study end-point of December 15, 1989.
There were 1023 (85.2%) candidates for a primary graft, 151 (12.6%) for a second graft, and 27 (2.3%) for a third or subsequent graft. Of the primary candidates, 812 (79.4%), and of the retransplant candidates, 159 (89.9%) received a graft; 109 (10.7%) of the primary candidates and 11 (6.2%) of the retransplant candidates died before a graft was found; 102 (10.0%) of the primary candidates and 7 (3.9%) of the retransplant candidates remained on the active waiting list at the study end-point.
Primary Candidates
Sex
The fate of 569 male and 454 female candidates for a first liver graft is shown in Table 1. Sixty (10.5%) males and 49 (10.8%) females died before a graft could be found, and 88.1% of these males and 67.5% of these females died within one month of entry on to the waiting list.
Table 1.
Fate of 812 candidates waiting for a first liver graft
| Transplanted | Active | Died | Total | |
|---|---|---|---|---|
| Male | 460 (80.8) | 49 (8.6) | 60 (10.5) | 569 (55.6) |
| Female | 352 (77.5) | 53 (11.7) | 49 (10.8) | 454 (44.4) |
| Infant | 68 (79.1) | 8 (9.3) | 10 (11.6) | 86 (8.4) |
| Child | 61 (80.3) | 12 (15.8) | 3 (3.9) | 76 (7.4) |
| Adult | 683 (79.3) | 82 (9.5) | 96 (11.1) | 861 (84.2) |
| Group O | 340 (77.4) | 48 (10.9) | 51 (11.6) | 439 (42.9) |
| Group A | 316 (78.8) | 42 (10.5) | 43 (10.7) | 401 (39.2) |
| Group B | 119 (85.6) | 9 (6.5) | 11 (7.9) | 139 (13.6) |
| Group AB | 37 (84.1) | 3 (6.8) | 4 (9.1) | 44 (4.3) |
| Class 1 | 135 (65.2) | 66 (31.9) | 6 (2.9) | 207 (20.2) |
| Class 2 | 326 (96.6) | 12 (3.4) | 14 (4.0) | 352 (34.4) |
| Class 3 | 190 (81.9) | 19 (8.2) | 23 (9.9) | 232 (22.7) |
| Class 4 | 161 (69.4) | 5 (2.2) | 66 (28.4) | 232 (22.7) |
Among the patients who received a transplant, 69.0% of the males and 59.4% of the females received their graft within one month, and 88.6% of the males and 83.8% of the female recipients received their grafts within 3 months.
Age groups
Patients were classified as infants (age under 2 years), children (age 2–17 years), and adults (age 18 or older) based on age at time of entry into candidacy. The fate of 86 infants, 76 children, and 861 adults is shown in Table 1. Ten (11.6%) infants, 3 (3.9%) children, and 96 (11.1%) adults died while waiting for a graft. The differences are not significant. However, only 33.3% of the infants died within one month of entry on the waiting list compared with 66.7% of the children and 83.9% of the adults (P<0.001).
Only 38.3% of the infants who were given a graft received it within one month, compared with 69.4% of the children and 67.1% of the adults. Of the children, 64.8% were given a graft within 3 months, compared with 95.2% of children and 87.9% of adults. These differences are highly significant (P<0.001).
ABO blood groups
The fate of primary candidates based on ABO blood type is shown in Table 1. Fifty-one (11.6%) patients with blood group O, 43 (10.7%) with blood group A, 11 (7.9%) with blood group B, and 4 (8.9%) with blood group AB died while waiting for a graft; 75.0% of patients who died waiting for a graft with blood group O, 85.6% with blood group A, 81.9% with blood group B, and 50.0% with blood group AB died within one month. The differences are not significant.
Within one month of entry onto the waiting list, 60.8% of type O candidates, 71.5% of type A, 63.9% of type B, and 51.3% of type AB candidates who received a transplant had received it. By 3 months, 81.6% of type O, 91.8% of type A, 88.3% of type B, and 83.7% of type AB recipients had received their grafts. Thus, more grafts were obtained for type A recipients and fewer for type AB recipients within one month (P=0.0234), but by three months the AB group had caught up with the others.
Primary liver disease
Pathological confirmation of the diagnosis of primary liver disease was available for 811 of the 812 candidates who received a primary liver graft. The most common indications for liver replacement were postnecrotic cirrhosis (257, 31.6%), alcoholic cirrhosis (128, 15.7%), cholestatic liver disease (primary biliary cirrhosis, sclerosing cholangitis) (124, 15.3%), primary hepatic or biliary tract cancer (81, 10.0%), biliary atresia (77, 9.5%), acute hepatic failure (40, 4.9%), and inborn errors of metabolism (37, 4.6%).
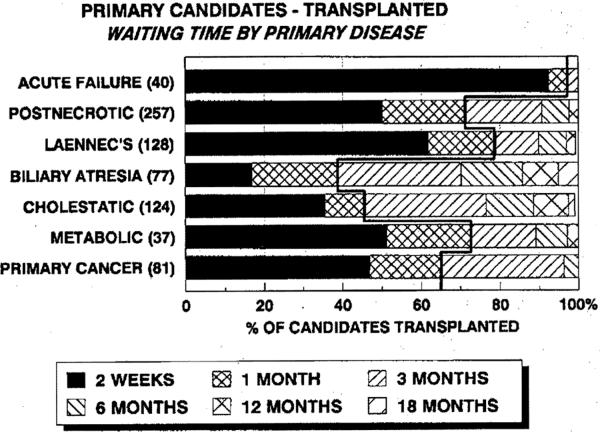
The distribution of waiting time to transplantation according to primary indication for liver replacement is shown in Figure 1. 87.5% of the patients given a graft with acute hepatic failure received their new liver within 7 days. Within one month 71.6% of liver recipients with postnecrotic cirrhosis, 79.0% of patients with alcoholic cirrhosis, 39.0% of patients with biliary atresia, 45.9% of patients with cholestatic liver disease, 72.9% of patients with inborn errors of metabolism, and 65.4% of patients with primary hepatobiliary cancers had received their grafts.
Figure 1.
The proportion of candidates who received a primary graft within specified intervals according to the primary indication for liver replacement. The meandering bold line indicates the proportion of patients who received a graft within one month of entry on to the waiting list. The further the line shifts to the right, the higher the proportion of patients receiving a graft within one month.
UNOS class
The UNOS class of candidates for a first graft according to sex, age group, and ABO blood group is summarized in Table 2. There were no significant differences.
Table 2.
Medical priority (UNOS class) for primary graft candidates
| UNOS class |
|||||
|---|---|---|---|---|---|
| 1 | 2 | 3 | 4 | ||
| Male | 108 (19.0) | 199 (35.0) | 128 (22.3) | 135 (23.7) | 569 |
| Female | 99 (21.8) | 153 (33.7) | 105 (23.1) | 97 (21.4) | 454 |
| Infant | 20 (23.3) | 21 (24.4) | 25 (29.1) | 30 (23.5) | 86 |
| Child | 18 (23.7) | 23 (30.3) | 17 (22.4) | 18 (23.7) | 76 |
| Adult | 169 (19.6) | 308 (35.8) | 190 (22.1) | 194 (22.5) | 86 |
| Group O | 84 (19.8) | 164 (37.8) | 100 (22.8) | 91 (20.7) | 439 |
| Group A | 88 (21.9) | 127 (31.7) | 93 (23.2) | 93 (23.2) | 401 |
| Group B | 31 (22.1) | 42 (30.0) | 29 (20.7) | 37 (26.6) | 139 |
| Group AB | 4 (9.1) | 19 (43.2) | 10 (22.7) | 11 (25.0) | 44 |
The fate of candidates based on UNOS class at study end-point is shown in Table 1. Among all the candidates who died waiting for a graft, 6 (5.5%) patients were listed in UNOS class 1, 14 (12.8%) in UNOS class 2, 23 (21.1%) in UNOS class 3, and 66 (60.6%) in UNOS class 4. Among all the candidates who were ultimately listed in class 4, 28.4% died waiting for a graft compared with 2.9% of those in class 1, 4.2% of those in class 2, and 9.9% of those in class 3 (P<0.001).
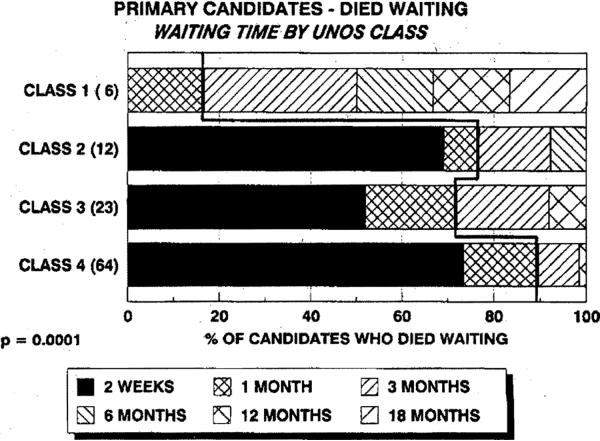
Also among candidates who died waiting for a graft, 89.7% of those listed in class 4, 72.0% of those listed in class 3, 76.9% of those listed in class 2, and 16.7% of those listed in class 1 were dead within one month of entry onto the waiting list (Fig. 2). The differences are highly significant (P<0.001). Thus, there is a relationship between the UNOS classification of medical priority and the urgency of need for a graft.
Figure 2.
The proportion of candidates who died after specified intervals before a graft could be found according to UNOS class (medical priority). There were 109 primary candidates who died waiting. The exact date of death for 4 cases was not known, leaving 105 cases available for analysis. The meandering bold line indicates the relative proportion of patients who died within one month of entry to the waiting list.
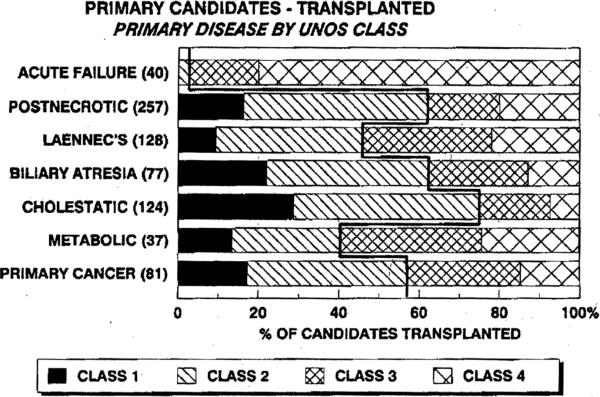
The proportion of patients in each UNOS class at the time of transplantation according to primary liver disease is shown in Figure 3. The proportion of patients in higher-urgency classes 3 and 4 was greatest for those with acute hepatic failure (97.5%), inborn errors of metabolism (59.4%), or alcoholic cirrhosis (53.9%).
Figure 3.
The proportion of candidates for a first liver graft in each UN OS class of medical urgency at the time of transplantation according to primary liver disease. The meandering bold line separates the proportion of patients in higher-risk groups (classes 3 and 4) from those in moderate- (class 2) and low-risk groups (class 1). The further the line shifts to the left, the higher the proportion of patients in classes 3 and 4.
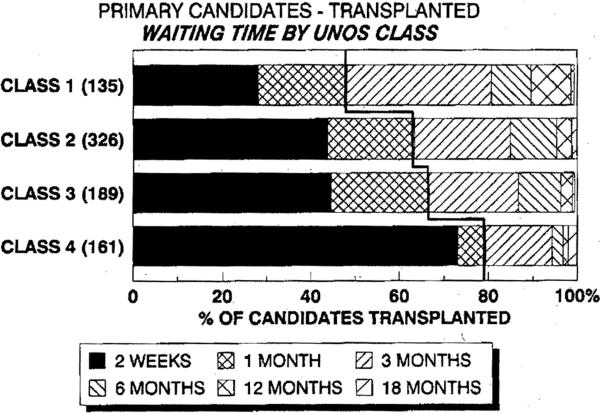
As would be expected, recipient waiting time was significantly related to UNOS class: 79.2% of candidates who were in class 4 at time of transplantation received their graft within one month compared with 48.2% of those in class 1, 63.5% of those in class 2, and 66.7% of those in class 3 (Fig. 4) (P<0.001).
Figure 4.
The proportion of candidates who received a primary paft within specified intervals according to-UNOS class (medical priority). The meandering bold line separates the proportion of patients in higher-risk groups (classes 3 and 4) from those in moderate- (class 2) and low-risk (class 1) groups. The further the line shifts to the left, the higher the proportion of patients in classes 3 and 4.
Survival after transplantation
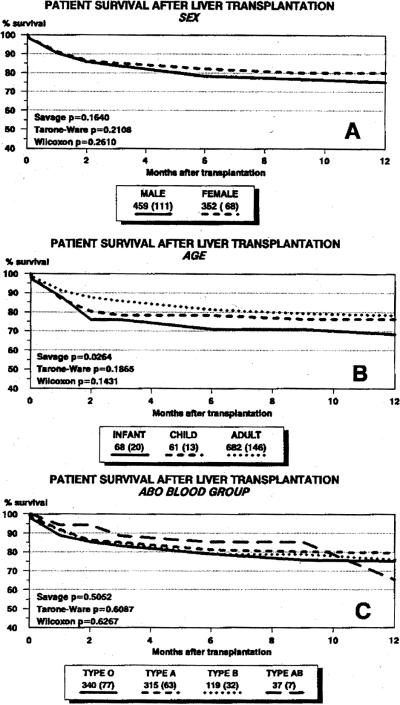
Actuarial survival rates (life-table method) after primary liver transplantation according to sex, age group, and ABO blood type are shown in Figure 5. Except for a slight early survival advantage for adult recipients, no significant differences in survival were observed. Overall survival of infants is now equivalent to the results achieved for adults.
Figure 5.
Actuarial survival rates for 811 primary graft recipients based on sex (A), age group (B), and ABO blood group (C).
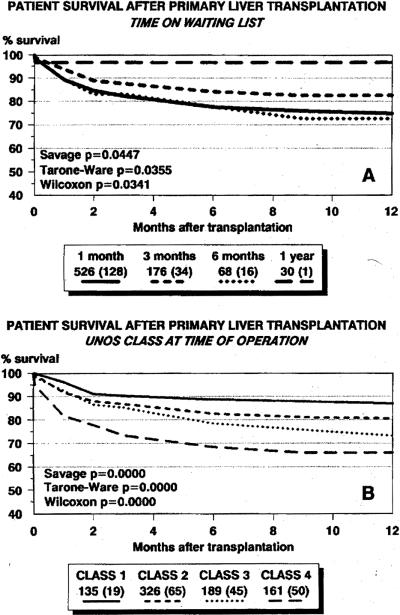
Figure 6 presents the survival rates for primary graft recipients based on waiting time accumulated prior to transplantation (Fig. 6A) and UNOS class at the time of transplantation (Fig. 6B). Survival was poorest for patients who received a graft within one month or between 3 and 6 months after entry onto the waiting list (P<0.05).
Figure 6.
(A) Actuarial (life-table) survival rates for graft recipients based on accumulated waiting list time. One month includes all patients receiving a graft within 30 days of entry on to the waiting list. Three months includes all patients receiving a graft more than 30 days but within 90 days of entry. Six months includes all patients receiving a graft more than 90 days but within 180 days of entry. One year includes all patients given a graft more than 180 days but within 365 days of entry. (B) Actuarial (life-table) survival rates for graft recipients based on UNOS class (medical urgency) at the time of transplantation.
There was a highly significant difference in survival rates between patients in UNOS class 4 (the most urgently ill) and those in the other classes (P<0.001). Actuarial survival rates (percentage) at 6 months for recipients in UNOS class 1, class 2, class 3, and class 4 were 88.7±2.9, 82.6±2.1, 78.4±3.2, and 68.4±3.9, respectively. At one year actuarial survival rates (percentage) for recipients in UNOS class 1, class 2, class 3, and class 4 were 86.8±3.0, 80.6±2.3, 72.3±3.7, and 66.1± 4.1, respectively.
Analysis of Mean and Median Waiting Time
The mean, standard deviation, and median waiting times (days) until transplantation for primary graft candidates who were given a new liver are shown in Table 3. Of the 812 primary candidates who received a graft, 702 (86.6%) were on the waiting list for 90 or fewer days, including 526 (64.9%) patients who waited 30 days or fewer. The distribution of waiting times is skewed by a small number of patients with long waiting times, and therefore the median may be a better estimator of central tendency for waiting time than the mean. The P values in the tables are the results of a k sample median test for differences in median waiting time. Although not shown in the table, t tests for differences in mean waiting time achieved similar levels of significance. The data show that females waited slightly longer than males, infants waited over three times longer than adults, type A patients received a graft slightly faster than blood group O, B, or AB patients—and, as would be expected, waiting time for UNOS class 4 patients was much shorter than for others.
Table 3.
Waiting time: descriptive statistics for primary candidates given a transplant
| n | Mean | SD | Median | Pa | |
|---|---|---|---|---|---|
| All | 811 | 43.0 | 74.4 | 17 | |
| Male | 459 | 38.2 | 69.6 | 14 | 0.0019 |
| Female | 352 | 49.4 | 79.9 | 21.5 | |
| Infant | 68 | 92.9 | 111.5 | 49 | 0.0000 |
| Child | 61 | 27.5 | 34.1 | 12 | |
| Adult | 682 | 39.5 | 70.6 | 15 | |
| O | 340 | 55.6 | 94.1 | 21 | 0.0029 |
| A | 315 | 30.1 | 51.6 | 12 | |
| B | 119 | 39.4 | 58.6 | 19 | |
| AB | 37 | 106.0 | 351.3 | 24 | |
| Class 1 | 135 | 63.6 | 88.8 | 32 | 0.0003 |
| Class 2 | 326 | 44.6 | 73.0 | 19 | |
| Class 3 | 189 | 39.7 | 65.7 | 20 | |
| Class 4 | 161 | 26.6 | 69.8 | 4 |
P value for k sample median test.
Table 4 presents the mean, standard deviation, median waiting times, and results of the k sample median test for candidates who died before a graft could be found. The distribution of waiting times for candidates who died while waiting for a graft is also skewed. Of the 109 primary candidates who died before a graft could be found, 83 (76.1%) died within 30 days on the waiting list. Only the patients with blood group AB, a very small group of patients, and those in UNOS class 1 had accumulated long waiting times before death. In general, the data show a short time to death for most of these patients.
Table 4.
Waiting time: descriptive statistics for primary candidates who died before a graft could be found
| n | Mean | SD | Median | Pa | |
|---|---|---|---|---|---|
| All | 109 | 29.8 | 65.3 | 11 | |
| Male | 60 | 20.5 | 46.1 | 10 | 0.3067 |
| Female | 49 | 41.9 | 82.7 | 13 | |
| Infant | 10 | 80.1 | 99.9 | 38 | 0.0324 |
| Child | 3 | 39.0 | 55.0 | 2 | |
| Adult | 96 | 24.7 | 59.8 | 10 | |
| O | 51 | 33.9 | 62.3 | 12 | 0.3199 |
| A | 43 | 17.8 | 24.6 | 10 | |
| B | 11 | 54.8 | 147.4 | 10 | |
| AB | 4 | 39.3 | 37.6 | 42 | |
| Class 1 | 6 | 160.8 | 176.9 | 98 | 0.0056 |
| Class 2 | 14 | 28.0 | 36.7 | 13 | |
| Class 3 | 23 | 38.3 | 69.9 | 15 | |
| Class 4 | 66 | 14.8 | 26.7 | 9 |
P value for k sample median test.
Except for patients in UNOS class 1 and class 4, waiting times were equal and often shorter for patients who died than for patients who received a graft. The overall median waiting time for all primary transplant candidates who died before a graft could be found was 11 days compared with a median waiting time of 17 days for those who received a graft (P=0.0003).
Retransplantation Candidates
Waiting list outcome for 178 candidates for liver retransplantation according to UNOS class is shown in Table 5. Only 11 patients died before a graft could be found, including 1 patient in class 3 and 10 patients in class 4. Candidates for third or subsequent grafts constituted less than 3% of patients and had minimal impact on waiting list outcome.
Table 5.
Fate of candidates waiting for liver retransplantation according to UNOS classification of urgency
| Transplanted | Active | Died | Total | |
|---|---|---|---|---|
| Class 1 | 3 (75.0) | 1 (25.0) | 4 | |
| Class 2 | 9 (90.0) | 1 (10.0) | 10 | |
| Class 3 | 15 (83.3) | 2 (11.1) | 1 (5.6) | 18 |
| Class 4 | 133 (91.1) | 3 (2.1) | 10 (6.8) | 146 |
| Total | 160 | 7 | 11 | 178 |
DISCUSSION
The UNOS point system for allocation of liver grafts has been operating since October 1987. Some modifications of the original point system have been made since its introduction, but it has continued to place the greatest emphasis on medical urgency, as defined by the level of medical care required by each candidate, and waiting time on the national list. In this report, we analyzed the impact of this system for liver allocation on candidate and graft recipient mortality rates at a single large liver transplantation center.
We did not here address the question of whether or not the level of medical care as defined by the UNOS system is the best indicator of urgency of need for a graft. Other measures such as the classic Child-Pugh score or a multivariate assessment such as that suggested by Shaw (4) might or might not provide better estimates of urgency of need. Further study of alternative methods of assessment is needed. However, we did find a significant relationship among UNOS medical priority class and waiting time, candidiate mortality, and recipient mortality. This suggests a correlation between the UNOS priority class and urgency of need for a graft.
We also did not consider here the length of time patients were in a particular UNOS class or shifts from one UNOS class to another during the waiting period. This information is not available in our computer database and would be best acquired in a prospective study.
Also, the definition of class 4 used in this study does not strictly adhere to the official UNOS definition. We modified the definition for purposes of this report for two reasons. First, the UNOS classification system was modified during the period covered in this study. Second, there was misunderstanding in the liver transplantation community about the precise definition of class 4 and “UNOS STAT” that resulted in inconsistencies among centers, including our own, in how patients were classified in these two categories. The simplest solution was to include all class 4 and “UNOS STAT” patients in a single class 4.
The overall mortality of patients waiting for liver grafts at this center has not changed significantly since the UNOS system was put in place. In the period from September 1986 to April 1987, just prior to the initiation of the UNOS allocation system, 46 (11.8%) of 392 candidates were lost before a graft could be found compared with 120 (10.0%) of the 1201 active candidates lost in the experience reported here. Since the UNOS system was adopted, 64.8% of candidates for a primary graft were able to be transplanted within one month of entry on the waiting list.
There were few differences in outcome for patients based on sex or ABO blood group. Infants continue to wait longer for a graft than adults, but infant survival has improved in our most recent experience and now is equal to that achieved in adults. Despite the longer waiting times for infants to get a graft and a similar proportion of infants in high-urgency classes, the percentage of infants lost waiting for a graft was not any higher than that for adults. Adults who died before a graft could be found for them tended to die sooner than infants, but even for infants who died waiting, 42.9% were dead in only two weeks, and by one month 57.2% had died.
The most remarkable finding in this study is the large percentage of patients in the upper classes of medical urgency (23% each in class 3 and class 4) and the significant increases in mortality both on the waiting list and after transplantation for such patients. Survival at 6 months after transplantation for patients in class 1 at the time of operation was nearly 89% compared with only 68% for patients in class 4.
The original UNOS point system for liver allocation assigned medical priority according to a six class scale based on social and vocational invalidism for the lower three levels and increasing requirements for hospital based care in the upper three levels (1). It was hoped that an appropriate balance would be achieved between those needing urgent transplantation and those whose waiting time would accumulate sufficiently to permit them a chance at getting a graft before their medical condition deteriorated to the point at which survival was jeopardized. The medical priority classification was later reduced to four classes, with the lowest class limited to patients not hospital-bound, and the other three classes containing the hospital-based groups of patients. A fifth category, “UNOS STAT” provides for patients in extremely urgent need who are expected to live only a matter of days without a graft. Our data suggest that there remains a disturbingly high proportion of higher-risk patients in the liver transplant candidate pool, and—although the present point system is heavily biased in favor of finding these patients an organ—there is a significant penalty in mortality, both on the waiting list and after transplantation, for having such a large proportion of higher risk patients. Nevertheless, although survival for patients in class 4 at time of transplantation is significantly lower than for other groups, it is still above 65% at one year and it would be difficult to justify denying liver transplantation to this group of patients.
The significant number of patients in high-risk categories and the relatively short waiting times accumulated by patients who died waiting suggest that part of the problem continues to be referral of a high percentage of patients in advanced stages of disease. In this regard it should be acknowledged that the data analyzed here may be subject to a center effect. As the largest and oldest liver transplantation program in the country, the University of Pittsburgh attracts complex and higher-risk cases. The ability of this center to handle a large volume of such patients reflects the institutional resources committed here to liver transplantation, including hospital beds, intensive care facilities, operating rooms, procurement teams, and recipient surgeons. Thus, our experience may not be representative of some other programs.
Nevertheless, our results suggest that the system is presently serving a larger percentage of patients with advanced degrees of illness than is desirable and that remedial measures may be needed. The results reported here add emphasis to the need for timely referral of patients with irreversible liver disease to the transplant center before the patient worsens to the point of diminished probability of survival either during the wait for an organ or after transplantation.
Given the increasing demands for restraint in health care costs, we are obligated to find ways to improve outcome and reduce morbidity. The liver transplant waiting list will continue to extract a higher-than-acceptable mortality until we improve the risk profile of the patients who are entered onto it.
ORAL DISCUSSION
DR. KLEIN (Baltimore, Maryland): My two questions would be that in one of your bar graphs, 20% of your class 4 patients waited between three and eighteen months for a transplant. How would you explain that a person who is class 4 can wait a year and a half for a transplant?
DR. GORDON: They didn't wait in class 4, Andy. As I tried to emphasize, this is classification at the time of transplantation. Patients who waited that long were not in class 4 the entire time. They obviously moved up in class and moved into class 4 at the time they got the liver.
DR. KLEIN: My second question would be that of the class 1 patients, half waited less than 30 days. To what would you attribute that very good fortune?
DR. GORDON: There is a misperception in the liver transplant community that the important competition here is for donors. Remember that there are less than a thousand patients at any one time waiting for livers. In fact, the waiting list is usually around 850 patients. Compare that to the thousands of patients waiting for kidneys. Also, liver transplants tend to be more durable, and once you get out beyond the early period, “retransplantation rate drops off dramatically, so there is less demand to reuse organs for retransplantation long-term.
The competition here is not for donors, with some exceptions, like infants. The competition is for recipients. The reason Pittsburgh gets so many livers is because we have so many recipients. The programs that have been most successful in starting up and establishing a place for themselves in transplantation of the liver, like the program in Omaha, like Charlie Miller's program at Mount Sinai in New York, are the programs that have been successful in recruiting recipients. If you own 30% of the cards in the deck, your card is going to come up more often. That's why the class 1 patients get transplanted in Pittsburgh.
There has also been a complaint that we soak up too many livers from around the country in Pittsburgh. To answer that, I would remind you that Pittsburgh is one of the few centers that actually has a truly national patient population. The livers come to us from all over the country and so do the recipients. I don't see the inequity in that.
DR. ROBERTS (San Francisco, California): I was looking at the abstract and see what you didn't talk about in your presentation were the UNOS STAT patients. About 25% of your patients are done as UNOS STAT. The surprising thing was that only 38% of those patients received a graft within one week, but only 20% of those patients died while waiting for a graft.
DR. GORDON: Again, you have to be careful to remember that some of the UNOS STAT patients shown here did not start out at UNOS STAT, and I don't know exactly how many of them switched and more importantly, I don't know when they switched.
The UNOS system has been confusing for most of us because it started out as a six-class system, but when we proposed the point system to UNOS, we didn't recommend the UNOS STAT designation. I don't know where it came from. It was conceived by some that it was supposed to be based on expected death within 48 hr. Then it was supposed to be only acute fulminant failure or primary graft nonfunction. Then we changed to a four-class system. So the whole system was in a state of flux, and the definitions were not clear to everybody during this time period. To simplify it, I put all of the UNOS STAT patients into class 4, but not everybody in class 4 was UNOS STAT in the data that I showed. A good percentage were, but only for relatively short periods of time, because I showed results at the time of transplantation.
Footnotes
Presented at the 16th Annual Meeting of the American Society of Transplant Surgeons, May 30-June 1, 1990, Chicago, IL.
This work was supported by research grants from the Veterans Administration and by Project Grant AM 29961 from the National Institutes of Health, Bethesda, MD.
REFERENCES
- 1.Starzl TE, Gordon RD, Tzakis AG, et al. Equitable allocation of extrarenal organs: with special reference to the liver. Transplant Proc. 1988;20:131. [PMC free article] [PubMed] [Google Scholar]
- 2.Gordon RD, Starzl TE. A microcomputer based approach to data management: an essential tool in the assessment of trends and results in liver transplantation. Semin Liver Dis. 1985;5:329. doi: 10.1055/s-2008-1040629. [DOI] [PMC free article] [PubMed] [Google Scholar]
- 3.Markus BH, Mitchell S, Gordon RD, Gilquist B, Starzl TE. TIMY—a center oriented transplant information management system. Transplant Proc. 1988;20:385. [PMC free article] [PubMed] [Google Scholar]
- 4.Shaw BW, Jr, Wood RP, Stratta RJ, et al. Stratifying the causes of death in liver transplant recipients: an approach to improving survival. Arch Surg. 1989;124:895. doi: 10.1001/archsurg.1989.01410080025003. [DOI] [PubMed] [Google Scholar]


