Abstract
Background: The objective of this study was to assess the factors associated with the traffic mortality in the region of Central Macedonia in order to produce evidence in building up preventive policies.
Material and Methods: This study is a descriptive survey covering a three-year period (from 01-01-2006 to 31-12- 2008). The data used were supplied by the regional Road Traffic Police Service in Thessaloniki.
Results: A total of 280 fatal vehicle collisions were recorded in three years, in which 312 people died. 266 (85.26%) of the 312 people who died were men and 46 (14.74%) were women. The victims were between 1 and 91 years of age (mean ± SD, 42.00 ± 20.36 years). More fatal vehicle collisions were recorded on weekends and holidays than weekdays. Regarding the type of the vehicle, occupants of two-wheeled motor vehicles were in greater risk for dying compared to heavy duty vehicle passengers, who are considered to be protected by the vehicle. Among the 312 fatalities, alcohol was detected in 87 (28%) of the drivers who were responsible for the collision. Most of them (56/86, 64.4%) were between 15 and 44 years of age. In 6 (1.9%) cases, all of them drivers, illicit substances were detected. Vehicle collisions with younger victims were recorded during the early morning hours, whereas older people died more frequently during daytime.
Conclusions: The findings of this study are providing evidence for the design and implementation of concrete and urgently needed preventive strategies in order to control the almost completely preventable fatalities of the road crashes.
Keywords: fatal, motor vehicle, collision, parameters, analysis, Greece
Road crashes are the leading cause of death for people under 50 years of age1 and the second-leading cause of death worldwide2 for children aged 5–14 years and young people aged 15–29 years.
The number of people killed worldwide in road traffic crashes each year is estimated to be almost 1.2 million, while those injured could be as many as 50 million – a number which corresponds to the combined population of five of the world's largest cities2.
It is obvious that road crashes, as a cause of premature mortality, could be prevented to a great extent – if not completely eliminated. Under this perspective, a wealth of scientific, political and civil society activities are emerging targeting road safety.
World Health Organization (WHO) dedicated the 2004 World Health Day to Road Safety, an action which underlines the great problem of traffic fatalities2. The European Transport Safety Council recently published a Blueprint for the EU's Road Safety Action Programme 2010-2020 entitled "Road Safety as a right and responsibility for all"3.
In order to elaborate evidence based, preventive strategies, a meticulous research for the identification and the assessment of the underlying determinants of road crashes is urgently needed. A critical issue that was raised mainly by the civil society activities is the definition of the event as a crash or a collision replacing the term "accident", which, by implying the role of chance as a determinant factor, is necessarily fading out any moral, legal or technical responsibility.
Within Europe, Greece is ranked in the seventh highest position in road crash fatalities, among 38 countries (24 men and 5 women per 100,000 citizens)4. This obviously means that Greece is still dealing ineffectively with this important issue.
The aim of this study is to assess and identify the underlying causes of road crash mortality, in the social and cultural setting of Northern Greece, in order to promote evidence based and concrete preventive strategies.
Material and Methods
A descriptive survey was implemented in order to assess the prevalence of the diverse parameters implicated in road crash fatalities recorded the years 2006, 2007 and 2008 within the borders of the prefecture of Thessaloniki. This prefecture is the largest of Northern Greece, with 45 municipalities and 1,057,825 inhabitants, according to the Greek National Statistics Service5.
The data used in this study were supplied by the archives of the regional Road Traffic Police Service in Thessaloniki and were handled respecting the anonymity of the victims.
The archives were reviewed, and for each fatal event, information recorded included the year, day, month and time of day that the incident took place, the type of vehicles involved, the age and sex of the victims, the position of the victims and the detection of alcohol or illicit substances. However, these data only includes the deaths that occurred at the incidence place and none of those that took place after several days of hospitalization.
The three years studied, consisted of 752 working days and 344 Saturdays, Sundays or holidays. The expected number of deaths per day was computed, making the assumption that the day of occurrence was random. The observed number of fatalities per day was then recorded. The null hypothesis that there is no significant difference between the distributions of observed and expected deaths was then tested with the application of the chi-square test.
Day time was divided in four 6-hour intervals, namely 12:01am-6.00am, 6:01am-12:00pm, 12:01pm-6:00pm, and 6:01pm-12:00am.
In order to evaluate whether the proportion of a) the responsible, for the collision, vehicle types and b) the fatalities per vehicle type were statistically different to the proportion of the various vehicle types in the fleet of vehicles circulating in the prefecture of Thessaloniki, the expected number was computed respectively and compared with the observed.
Descriptive statistics were computed for all variables. According to the presence of normal distribution or not of the population, parametric or not parametric tests were computed respectively.
The Statistical Package for Social Sciences (Version 17) was used for data analysis.
Results
A total of 280 fatal vehicle collisions were recorded during the three year period (2006, 2007 and 2008), in which 312 people died.
In 2006, 111 deaths (35.58% of the total) were recorded, in the next year 101 (32.37%), and 100 (32.05%) in 2008. The per year differences of the number of fatalities were not statistically significant.
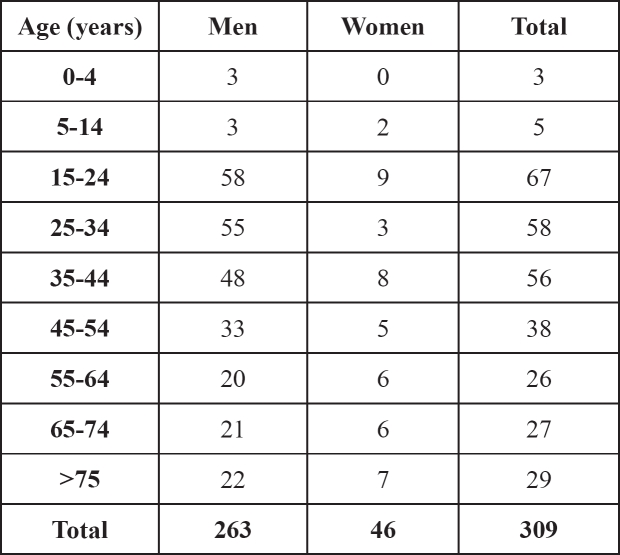
Information regarding age and sex distribution was available for 309 of the 312 fatalities and is shown in Table 1.
Table 1. Age and sex distribution for 309 of the 312 casesn studied.
The age range of the victims was between 1 and 91 years old, whereas the mean age was 42 years (SD ± 20.36 years).
Among the victims, 266 (85.26% of the total) were men and 46 (14.74%) were women, a difference that is statistically significant (Pearson chi square = 169.72, p<0.001).
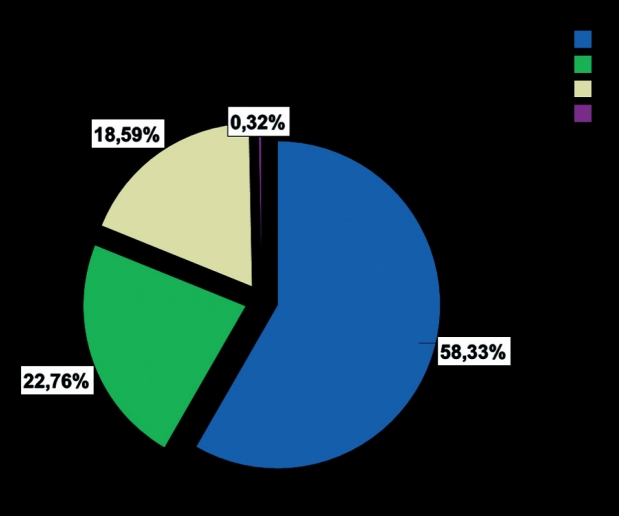
Figure 1 shows the proportion of drivers (182, 58.33%), passengers (71, 22.76%) and pedestrians (59, 18.59%) among fatalities.
Figure 1. Proportion of drivers (58.33%), passengers (22.76%) and pedestrians (18.59%) among fatalities.
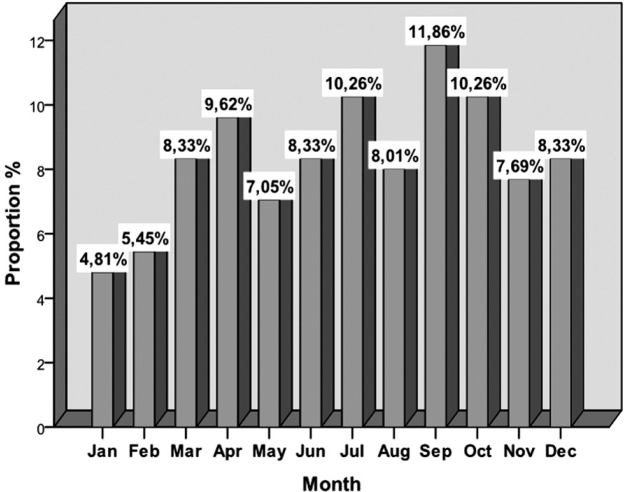
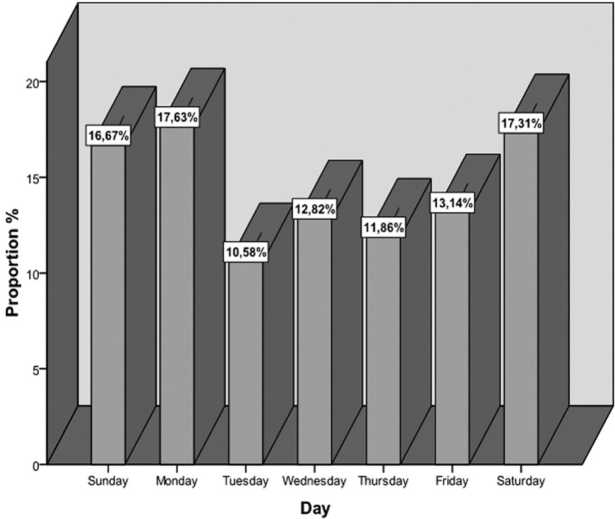
The monthly and daily distribution of the fatalities is shown in Figure 2 and Figure 3 respectively.
Figure 2. Monthly distribution of fatalities.
Figure 3. Daily distribution of fatalities.
The distribution of fatalities in the different months of the year or the different days of the week did not present significant differences (Pearson chi square = 16.62, p>0.05 and Pearson chi square = 10.72, p>0.05 respectively).
Nevertheless, most of the fatalities were recorded during the months of July (10.26%), September (11.86%) and October (10.26%). January (4.81%) and February (5.45%) were the months with the smallest number of fatal incidences.
Although there was no statistically significant difference regarding the daily distribution of road fatalities, the result became significant (Pearson chi square = 5.37, p<0.05) when examining the distribution of the fatal incidents in working and non-working days of the year (including weekends and holidays) and showed that more road fatalities occurred on weekends or holidays, rather than working days.
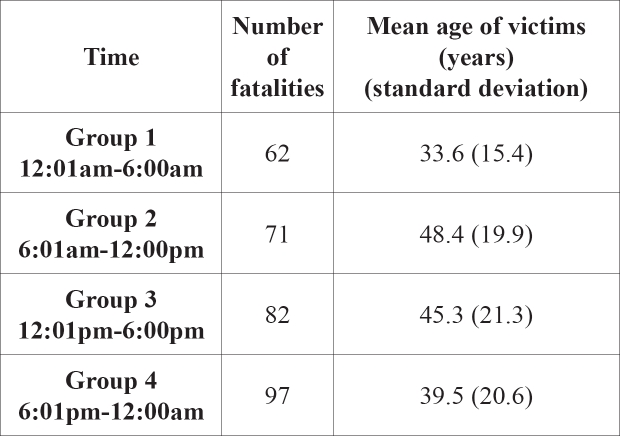
Statistical analysis revealed that there is a statistically significant difference in the mean age of the victims when different, 6-hour time frames are compared (p<0.0001) as shown in Table 2. Furthermore, the mean age of the victims was significantly different when Groups 1 and 2 (p<0.0001), Groups 1 and 3 (p=0.001) and Groups 2 and 4 (p=0.004) were compared (the p value is compared to 0.05/6=0.0083, according to Bonferroni adjustment).
Table 2. Time frame (group) in which fatal collisions took place and respective mean age of the victims.
The mean age of the victims in time frame Group 1 (12:01am-6:00am) was lower than that in Group 2 (6:01am-12:00pm) or Group 3 (12:01pm - 6:00pm), which means that young people usually die during the early hours (12:01am-6:00am). Similarly, people who die between 6:01am and 12:00pm (daylight) are older than those who die between 6:01pm and 6:00am (darkness).
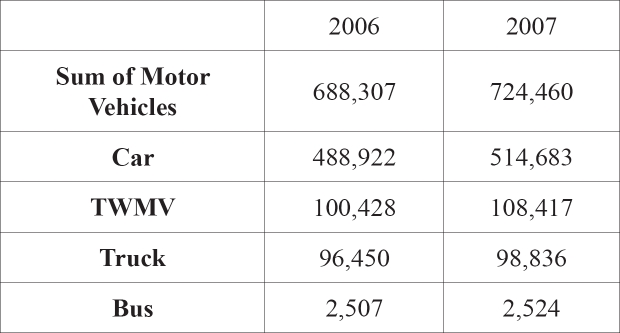
The actual number of vehicles, per type, circulating in the prefecture of Thessaloniki during the years 2006 and 2007 is shown in Table 3.
Table 3. Number of vehicles, per type, circulating in the prefecture of Thessaloniki during the years 2006 and 2007. (TWMV: two-wheeled motor vehicles).
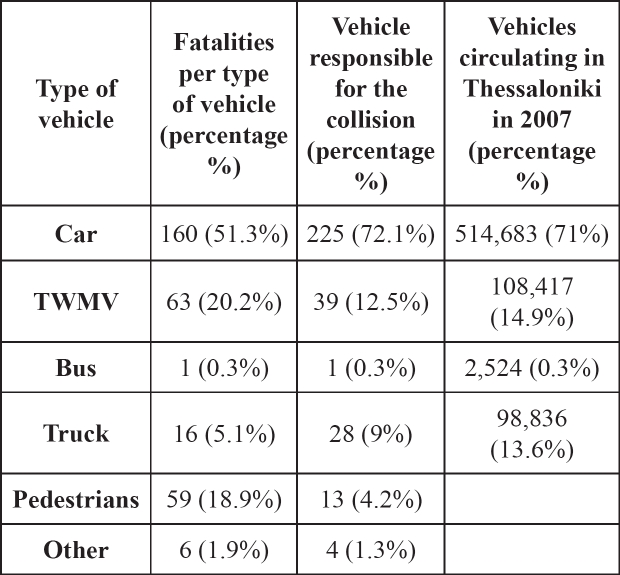
The type of vehicles responsible for the fatal collisions and the number of fatalities per vehicle type are shown in Table 4.
Table 4. Type of vehicles responsible for the fatal collisions, number of fatalities per type of vehicle and actual number of vehicles, per type, circulating in Thessaloniki. (TWMV: two wheeled motor vehicles.
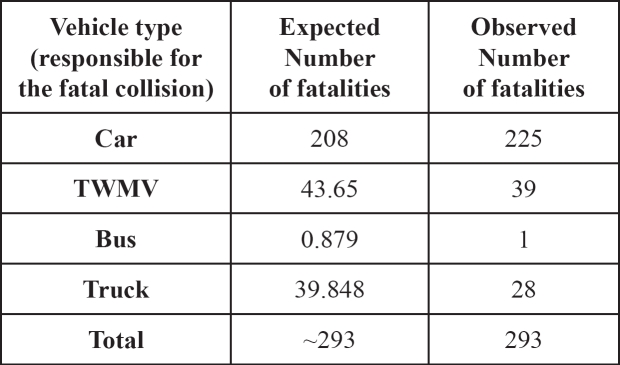
As shown in Table 5, there is no significant difference (Pearson chi square = 5.42, p>0.05) between the proportion of the various vehicle types in the circulating fleet of vehicles in the prefecture of Thessaloniki and the respective proportion of vehicle types in the vehicles whose drivers were responsible for the collision. Therefore, no specific vehicle type can be correlated with an increased risk for causing a fatal vehicle collision.
Table 5. Expected and observed number of fatalities per vehicle type, for the vehicles considered responsible for the fatal collision. (TWMV: two-wheeled motor vehicles. Pedestrians and other types of vehicles (trains, tractors etc.) were excluded. Pearson chi square = 5.42, p>0.05.
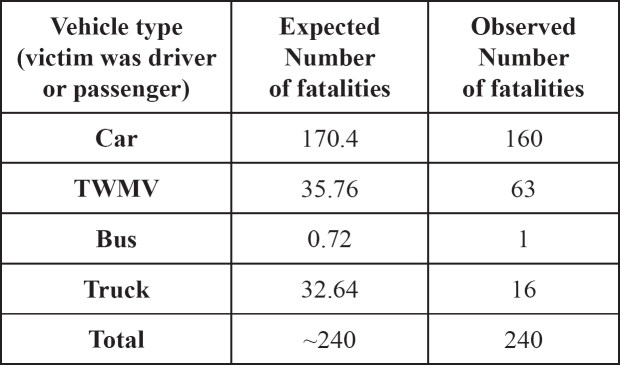
The extent to which the distribution of fatalities among the different vehicle types is corresponding to the respective proportion of the various vehicle types in the circulating fleet of vehicles in the prefecture of Thessaloniki is presented in Table 6.
Table 6. Expected and observed number of fatalities per vehicle type, for the vehicles that the victim was driver or passenger. Chi square= 29.97, p<0.001.
There is a statistically significant difference between the expected and the observed fatalities per vehicle type (Pearson chi square = 29.97, p<0.001). Testing per vehicle type, showed that trucks' passengers (or drivers) are protected when involved in a collision (p<0.01), whereas occupants of two-wheeled motor vehicles are at greater risk of dying (p<0.001).
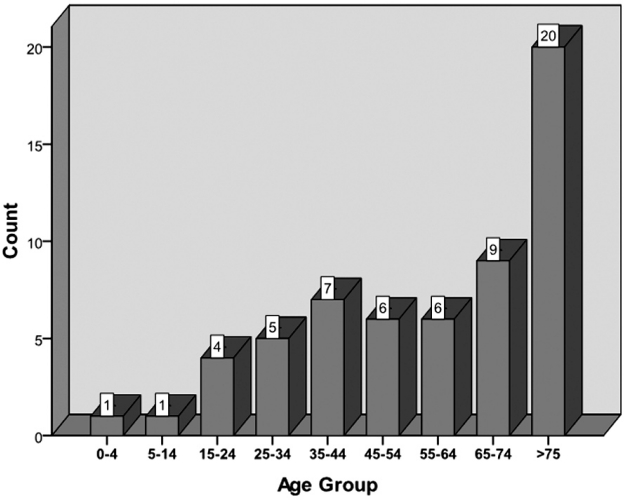
During the three year period, 59 pedestrian fatalities were recorded, representing 18.9% of the total fatalities. 43 of them (73%) were men and 16 (27%) women. The age distribution of the victims is shown in Figure 4. Almost half of the victims (49%) were more than 65 years old when the proportion of people over 65 years old in the prefecture's population is 14.1% according to the Greek National Statistics Service5.
Figure 4. Age distribution of pedestrian victims.
Consumption of alcohol was verified by a blood ethanol determination in 87 (28%) cases of fatalities. The person under the influence of alcohol was the responsible for the collision driver in 81 cases, both drivers involved in 2 cases, the pedestrian victim in 2 cases, both the pedestrian victim and the driver in 2 cases. The 64.4% of the individuals involved in a fatal incidence while being under the influence of alcohol were 15-44 years of age. Illicit substances were detected in 6 (1.9%) cases, all of which were drivers.
Discussion
According to the records of the World Health Organization, the ratio of males to females in fatal vehicle collisions worldwide is 2.7:12. However, in this study the ratio was much greater, namely 5.8:1, possibly reflecting still remaining gender differences in driving.
A limitation of the study was that our sample did not include the deaths that occurred after medical care was provided to the victims. It is known that the World Health Organization as well as the literature considers as fatality due to motor vehicle collisions every death within the first 30 days after the incidence. However, the raw data we received from the Road Traffic Police Service did not include this information.
This study did not reveal any significant difference regarding the monthly or the daily distribution of the fatalities. However, the rate of fatal traffic incidences was higher on weekends and holidays compared to weekdays, which shows that measures should be implemented to reduce road traffic crashes during leisure traveling6.
Although the difference was not statistically significant, most of the fatalities were recorded during the months of July (10.26%), September (11.86%) and October (10.26%), a finding which is in agreement with previous reports7, according to which summer and fall months experience more crash deaths than winter and spring, due to increased vehicle travel.
Another interesting finding was that younger people die during the nighttime and older people die during daytime. According to previous reports8 the nighttime fatality rate is 3 times the daytime rate, baring in mind that 75% of travel occurs during daytime light and almost half of fatalities occur during the nighttime. The increased fatality rate during the night can be attributed, according to the same report, to the limited use of passenger restraints, the increased alcohol consumption and speeding during the night. Nevertheless, another important factor involved could be fatigue.
The type of vehicles involved is of great importance when studying traffic fatalities. As expected, trucks' passengers or drivers are protected in contrast to two-wheeled motor vehicles (TWMV) occupants who are exposed and more vulnerable9.
Alcohol consumption was recorded in 28% of the fatalities, whereas prohibited psychoactive substances abuse was limited (1.9% of the cases studied). Our results are in accordance with those presented in older studies10. Driving under the influence of drugs seems to be a minor problem in Greece, while in other countries, such as Finland, an increasing trend is recorded11.
Conclusions
In view of these findings, this study is providing evidence that could be used for the implementation of concrete preventive strategies.
As stated and suggested by the literature, young people and especially men should be taught against aggressive driving which is considered to be a major traffic safety problem in several countries12–15. This is something that could be accomplished by implementing vehicle safety programs as early as in elementary school16.
Increased road supervision should be implemented during weekends and holidays, and especially in summer and fall, since most fatal incidences happen then.
Driving while tired is forbidden by the Finnish Road Traffic Act17. The influence of fatigue during early hour road crashes, has to be precisely assessed and raised as target issue of health education activities18.
Drinking and driving is obviously not dealt with efficiency. A recent study in Greece showed that one-third of the university students questioned, reported to have driven under the influence of alcohol19, while another interesting report showed that reinforcement of control policies can reduce the number of road crashes20. When the number of breath alcohol controls in Greece increased in 1998, an important reduction of the number of persons killed and seriously injured from traffic crashes was observed21.
In the current survey factors associated with fatal traffic incidences in the area of Central Macedonia were assessed. The findings of this study should be considered when designing and implementing concrete and urgently needed road crash preventive strategies.
References
- 1.Saukko P, Knight B. Knights Forensic Pathology. 3rd ed. London: Arnold; 2004. Transportation injuries; pp. 281–300. [Google Scholar]
- 2.Peden M, Scurfield R, Sleet D, editors. World report on road traffic injury prevention. Geneva: World Health Organization; 2004. [Google Scholar]
- 3.European Transport Safety Council . "Road Safety as a right and responsibility for all" A Blueprint for the EU’s Road Safety Action Program 2010-2020. Brussels: ETSC; 2008. Road Safety as a right and responsibility for all A Blueprint for the EUs Road Safety Action Program 2010. [Google Scholar]
- 4.Atlas of health in Europe. World Health Organization. 2nd ed. Copenhagen: WHO Regional Office for Europe; 2008. p. 56. [Google Scholar]
- 5.National Statistical Service of Greece . Concise Statistical Yearbook 2006. Pireas, Greece: NSSG Press; 2007. [cited 2010 Mar 23] Available from: www.statistics.gr. [Google Scholar]
- 6.Petridou E, Askitopoulou H, Vourvahakis D, Skalkidis Y, Trichopoulos D. Epidemiology of road traffic accidents during pleasure travelling: the evidence from the Island of Crete. Accid Anal Prev. 1997;29:687–693. doi: 10.1016/s0001-4575(97)00038-9. [DOI] [PubMed] [Google Scholar]
- 7.Farmer CM, Williams AF. Temporal factors in motor vehicle crash deaths. Inj Prev. 2005;11:18–23. doi: 10.1136/ip.2004.005439. [DOI] [PMC free article] [PubMed] [Google Scholar]
- 8.Thoma T. Passenger vehicle occupant fatalities by day and night-a contrast. Ann Emerg Med. 2008;51:443–445. doi: 10.1016/j.annemergmed.2008.02.005. [DOI] [PubMed] [Google Scholar]
- 9.Li MD, Doong JL, Huang WS, Lai CH, Jeng MC. Survival hazards of road environment factors between motor-vehicles and motorcycles. Accid Anal Prev. 2009;41:938–947. doi: 10.1016/j.aap.2009.05.009. [DOI] [PubMed] [Google Scholar]
- 10.Papadodima SA, Athanaselis SA, Stefanidou ME, Dona AA, Papoutsis I, Maravelias CP, et al. Driving under the influence in Greece: A 7-year survey (1998–2004) Forensic Sci Int. 2008;174:157–160. doi: 10.1016/j.forsciint.2007.03.019. [DOI] [PubMed] [Google Scholar]
- 11.Ojaniemi KK, Lintonen TP, Impinen AO, Lillsunde PM, Ostamo AI. Trends in driving under the influence of drugs: a registerbased study of DUID suspects during 1977-2007. Accid Anal Prev. 2009;41:191–196. doi: 10.1016/j.aap.2008.10.011. [DOI] [PubMed] [Google Scholar]
- 12.Björklund GM. Driver irritation and aggressive behaviour. Accid Anal Prev. 2008;40:1069–1077. doi: 10.1016/j.aap.2007.10.014. [DOI] [PubMed] [Google Scholar]
- 13.Kontogiannis T, Kossiavelou Z, Marmaras N. Self-reports of aberrant behaviour on the roads: errors and violations in a sample of Greek drivers. Accid Anal Prev. 2002;34:381–399. doi: 10.1016/s0001-4575(01)00035-5. [DOI] [PubMed] [Google Scholar]
- 14.Nabi H, Consoli SM, Chiron M, Lafont S, Chastang JF, Zins M, et al. Aggressive/hostile personality traits and injury accidents: an eight-year prospective study of a large cohort of French employees - the GAZEL cohort. Psychol Med. 2006;36:365–373. doi: 10.1017/S0033291705006562. [DOI] [PMC free article] [PubMed] [Google Scholar]
- 15.Papaioannou P. Driver behaviour, dilemma zone and safety effects at urban signalized intersections in Greece. Accid Anal Prev. 2007;39:147–158. doi: 10.1016/j.aap.2006.06.014. [DOI] [PubMed] [Google Scholar]
- 16.Bell ML, Kelley-Baker T, Rider R, Ringwalt C. Protecting you/protecting me: effects of an alcohol prevention and vehicle safety program on elementary students. J Sch Health. 2005;75:171–177. [PubMed] [Google Scholar]
- 17.Radun I, Radun JE. Convicted of fatigued driving: who, why and how? Accid Anal Prev. 2009;41:869–875. doi: 10.1016/j.aap.2009.04.024. [DOI] [PubMed] [Google Scholar]
- 18.Morad Y, Barkana Y, Zadok D, Hartstein M, Pras E, Bar-Dayan Y. Ocular parameters as an objective tool for the assessment of truck drivers fatigue. Accid Anal Prev. 2009;41:856–860. doi: 10.1016/j.aap.2009.04.016. [DOI] [PubMed] [Google Scholar]
- 19.Liourta E, van Empelen P. The importance of self-regulatory and goal-conflicting processes in the avoidance of drunk driving among Greek young drivers. Accid Anal Prev. 2008;40:1191–1199. doi: 10.1016/j.aap.2008.01.002. [DOI] [PubMed] [Google Scholar]
- 20.Yannis G, Papadimitriou E, Antoniou C. Multilevel modelling for the regional effect of enforcement on road accidents. Accid Anal Prev. 2007;39:818–825. doi: 10.1016/j.aap.2006.12.004. [DOI] [PubMed] [Google Scholar]
- 21.Yannis G, Antoniou C, Papadimitriou E. Road casualties and enforcement: distributional assumptions of serially correlated count data. Traffic Inj Prev. 2007;8:300–308. doi: 10.1080/15389580701369241. [DOI] [PubMed] [Google Scholar]


