Abstract
The histologic characteristics that are the basis for diagnosis of central nervous system conditions cannot be visualized directly using magnetic resonance (MR) methods, but clinical diagnosis may be based on the frequency and pattern of MR imaging signs, which represent predominantly the gross morphologic features of lesions. Additional quantitative MR measures of myelination, cell swelling, gliosis, and neuronal loss may also be used for more specific characterization of lesions. These measures include magnetization transfer ratio, apparent diffusion coefficient, and the concentrations or ratios of metabolites identified by spectroscopy. Confidence that an MR abnormality is responsible for the clinical signs depends primarily on the degree of correspondence between the site of the lesion and the neuroanatomical localization.
Keywords: apparent diffusion coefficient, brain, cat, dog, MR imaging, magnetization transfer ratio, spectroscopy
In general, magnetic resonance (MR) imaging is a sensitive, but non-specific method for the diagnosis of neural lesions.1,2 Sensitivity is higher for masses, malformations, and inflammation while lower for chronic progressive neuronal degeneration. Differential diagnoses are usually generated based on a combination of imaging signs and patient data such as signalment, progression of clinical signs, and clinicopathological results. Similarly, confidence that an MR abnormality is responsible for the clinical signs depends primarily on the degree of correspondence between the site of the lesion and the neuroanatomical localization; however, for many common lesions, such as hydrocephalus, quadrigeminal cyst, caudal occipital malformation and brain atrophy, there is no consensus about how to correlate severity in MR images and the severity of clinical signs.
Towards more specific diagnosis of brain disease
The histologic characteristics that are the basis for definitive diagnosis of central nervous system conditions cannot be visualized directly using MR imaging, but clinical diagnosis may be based on the frequency and pattern of MR imaging signs, which for the most part represent gross morphologic features of lesions. For example, the presence of a dural tail and signal void suggestive of calcification in an extra-axial mass together with hyperostosis of the overlying bone can help distinguish a meningioma, in which these signs are common, from a peripheral nerve sheath tumor or a round cell neoplasm, in which this combination of signs would be unusual. Various reports have described the MR signs in patients with age-related degeneration,3 caudal occipital malformation syndrome,4-6 arachnoid cysts,7-9 hydrocephalus,10-12 cerebellar degeneration, 13,14 necrotizing encephalitis15, granulomatous meningoencephalitis,16 infarcts,17, 18 pituitary tumors,19, 20 and brain neoplasms.21-27 These studies help estimate the prevalence of MR signs associated with these diseases, thus aiding interpretion of images of other patients. It may be that retrospective evaluation of gross and microscopic findings obtained from large populations of specific diseases for the frequency of potentially MR-visible abnormalities such as cysts, hemorrhage, and/or mineralization would also provide very useful data regarding the incidence of these abnormalities in imaged patients.30-32
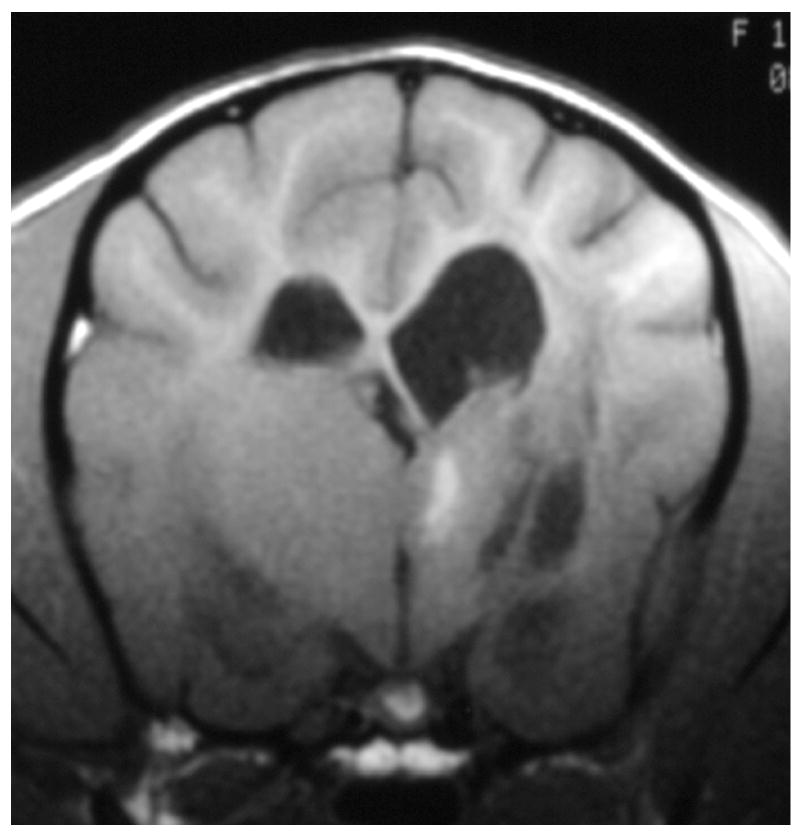
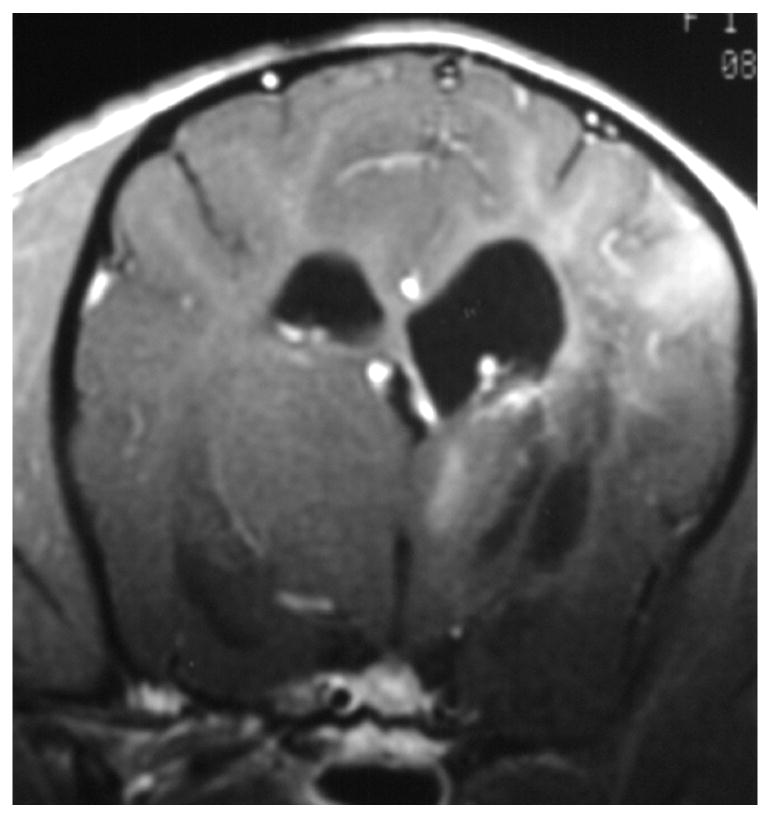
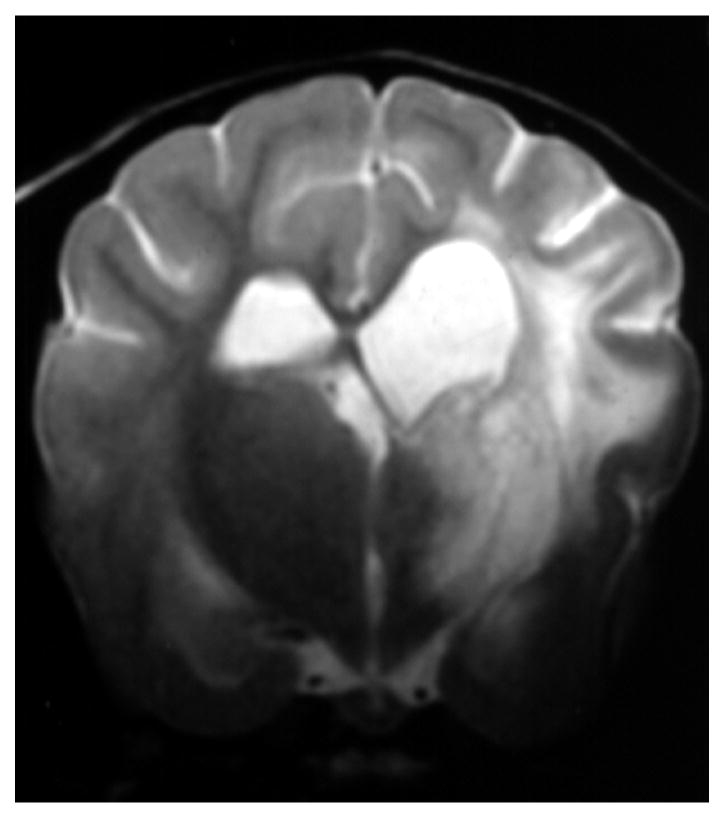
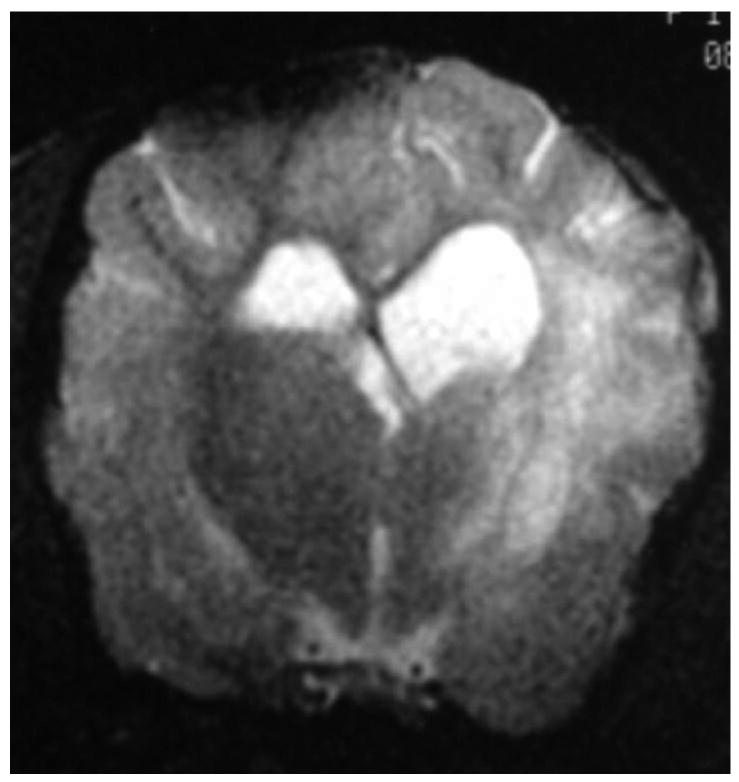
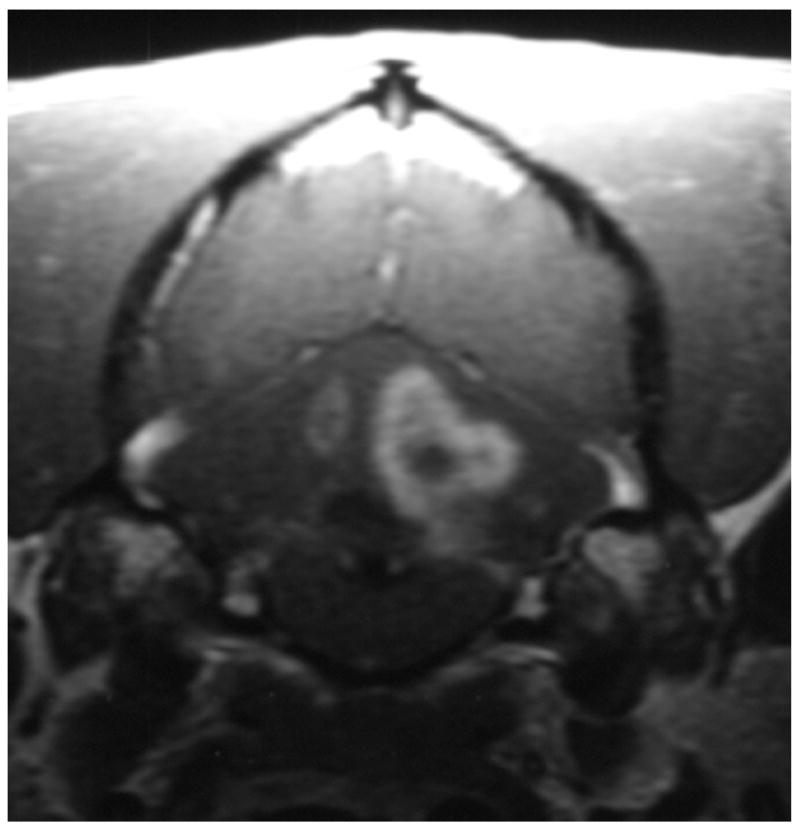
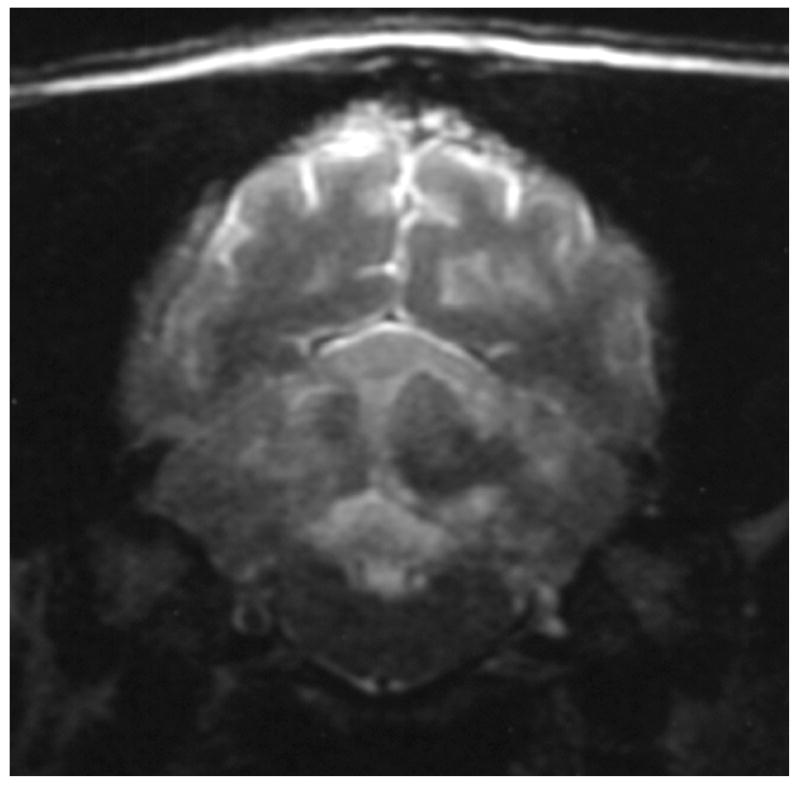
Knowledge of the prevalence of gross and histologic abnormalities in specific diseases is useful when interpreting MR images. 28, 29 For example, necrotizing encephalitis is an inflammatory disease of the brain due to unknown etiology.33, 34 Multifocal to coalescing lesions may be found throughout the brain, but are more commonly confined to the prosencephalon. Histologically, these lesions appear as rarefied parenchyma with infiltration of lymphocytes, histiocytes, and plasma cells.33, 34 Figure 1 shows the brain of a 1-year-old Maltese dog. Multifocal lesions are limited to the cerebrum and thalamus and are characterized by the presence of moderately contrast-enhancing parenchyma and meninges, as well as by the loss of parenchyma and the replacement by fluid. A meningoencephalitis is suspected from this pattern of multifocal enhancement. Diagnosis of necrotizing encephalitis is supported by the parenchymal loss, sparing of the caudal fossa, and signalment of the patient. In comparison, granulomatous meningoencephalomyelitis frequently causes lesions throughout the CNS but large regions of parenchymal loss are rare (Figure 2).35
Figure 1.
Images of the brain of a 1 year old Maltese dog with necrotizing encephalitis. Extensive signal abnormalities are present throughout the gray and white matter of the left cerebrum and thalamus. Mild to moderate gadolinium enhancement is present in the cerebrum and overlying meninges. Focal parenchymal loss and replacement with fluid are visible in the left thalamus and temporal lobe. (A - T1-weighted image; B – T1-weighted image + gadolinium; C – T2-weighted image, D – gradient echo image)
Figure 2.
Images of the brain of a 6 year old dachshund with granulomatous meningoencephalomyelitis. Extensive signal abnormalities are present throughout the gray and white matter of the cerebellum on T2-weighted image. Strong ring enhancing lesions are present in the cerebellum. Swelling is suggested by the lack of visible cerebellar folia. (A - T1-weighted image + gadolinium; B – T2-weighted image)
Globoid cell leukodystrophy is a genetic, degenerative disease of the white matter of immature dogs.36 Histologically, lesions appear as demyelination and loss of oligodendrocytes most severely affecting the centrum semiovale, corona radiata, and corpus callosum.37 Large numbers of swollen macrophages (“globoid cells”) also occur. T2-weighted images show bilaterally symmetrical hyperintensity of the white matter with the centrum semiovale and corona radiata most severely affected (Figure 3). Gadolinium-enhanced T1-weighted images show enhancement of these regions suggestive of inflammation. The pattern of white matter involvement helps to distinguish leukodystrophy from other white matter diseases of puppies, such as canine distemper virus infection, which usually has a less symmetrical, multifocal appearance.
Figure 3.
T2-weighted image of the brains of a 16-week-old Cairn terrier with globoid cell leukodystrophy showing the bilaterally symmetrical increase in signal intensity of the white matter throughout the brain.
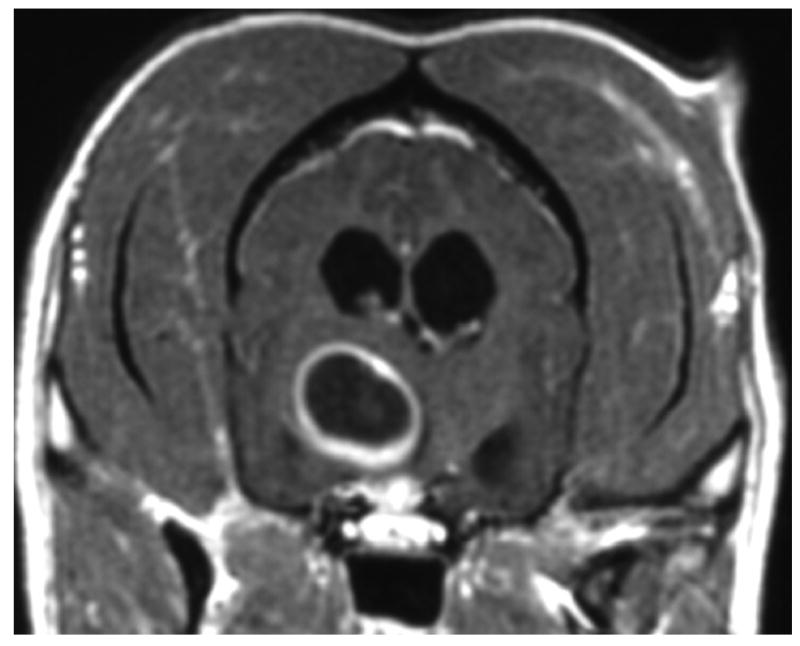
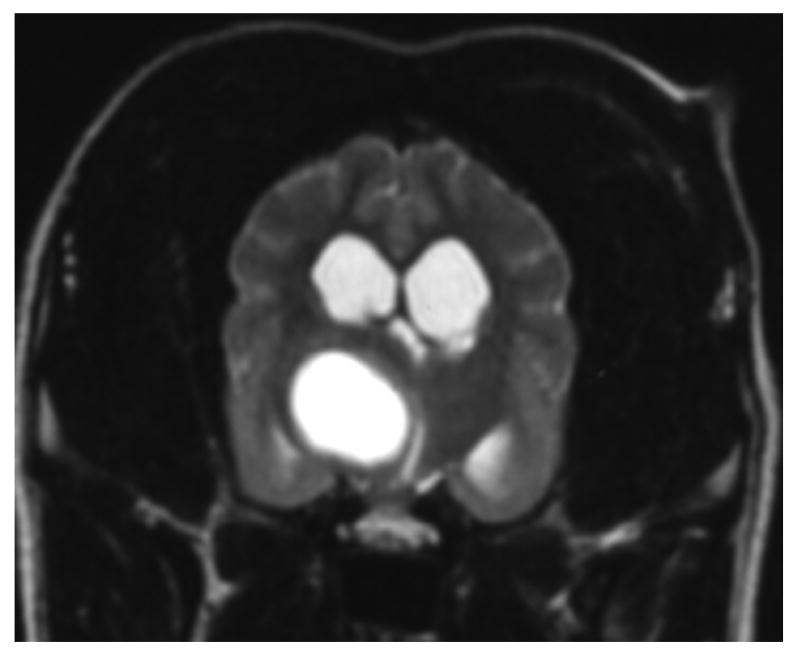
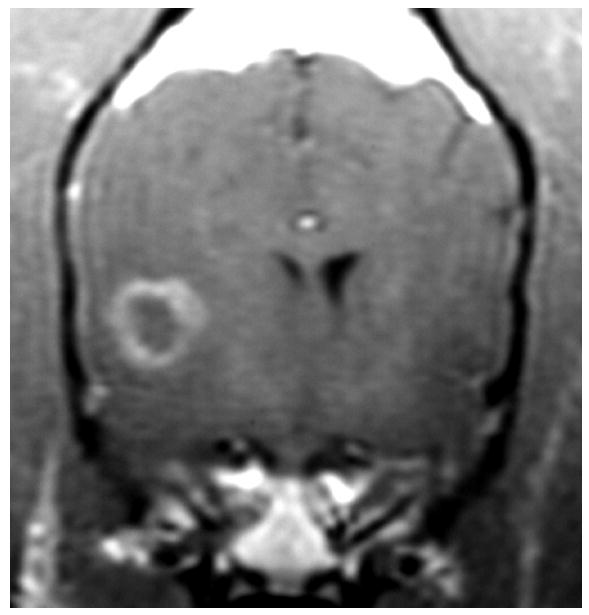
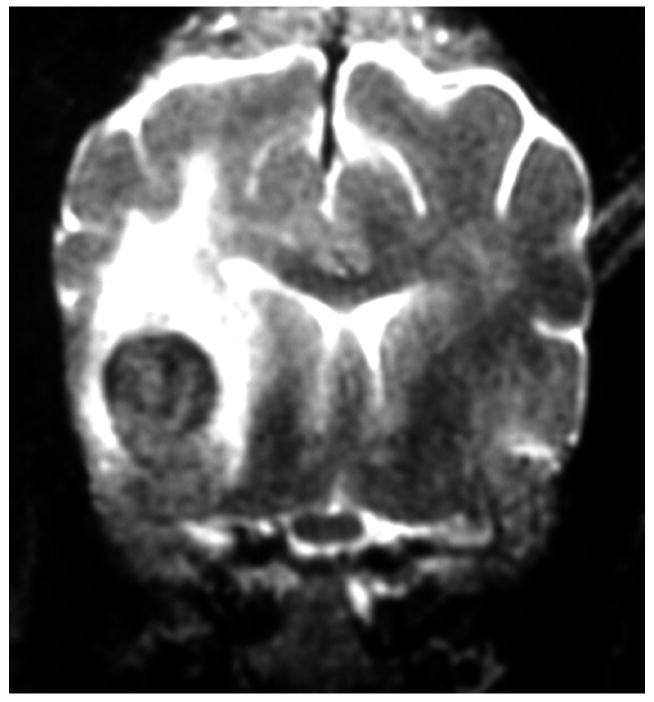
Other lesions remain difficult to distinguish. For example, gliomas and infarcts are intra-axial lesions that affect similar regions of the brain in older dogs. Histologically, gliomas appear as a proliferation of neoplastic cells with mass effect and rare hemorrhage.29 Infarcts are associated with cell swelling and occasionally hemorrhage, followed by cell death, invasion by inflammatory cells and eventual parenchymal loss.17 Although they are readily distinguished histologically, gliomas and infarcts may appear similar in MR images. In theory, the degree of enhancement and the presence or absence of mass effect should aid diagnosis because gliomas commonly show moderate to strong enhancement, perilesional edema and mass effect while infarcts show mild if any contrast enhancement and little mass effect.17, 26 However, a recent study in which three blinded observers were requested to classify 38 conventional T1- and T2-weighted images as either infarct or glioma, over 10% of the infarcts were incorrectly interpreted to be gliomas.38 Distinguishing glioma from infarct is difficult without the benefit of additional specific imaging sequences (Figure 4).
Figure 4.
Images A and B are of the brain of an 8 year old mixed-breed dog with an oligodendroglioma within the right side of the thalamus. The lesion shows strong ring-enhancement and the presence of a central cavity with signal characteristics distinct from that of CSF. Images C and D are of the brain of a 14 year old mixed breed dog with an infarct within the right temporal lobe. The lesion shows moderate to strong ring-enhancement, regionally extensive edema, and evidence of hemorrhage. (A & C – T1-weighted image + gadolinium; B &D – T2-weighted image)
There is potential for more specific diagnosis by using additional MR techniques complementary to the standard sequences. Examples include improved characterization of white matter disease using magnetization transfer imaging (MTI);39, 40 detection of cell swelling using diffusion-weighted imaging (DWI);41-43 and assessment of neuronal loss, gliosis, and membrane turnover using magnetic resonance spectroscopy (MRS).44
Magnetization transfer imaging (MTI)
MTI generates contrast by imaging the effect on signal intensity of the exchange of magnetization between protons in structural macromolecules and protons in water. By selectively saturating the signal from macromolecules, such as myelin, MTI can substantially increase tissue contrast and can improve sensitivity for the detection of disease.45, 46 MTI has been used to increase the sensitivity of lesion detection by increasing contrast for magneztic resonance angiography, for gadolinium-enhanced images, and for T2-weighted imaging to detect demyelinating disease.47, 48 The magnetization transfer ratio (MTR) is the quantitative expression of MTI which aides in both the detection and the characterization of white matter abnormalities. Use of the MTR is exemplified in imaging studies of multiple sclerosis (MS).39, 40 T2-weighted imaging alone of brain lesions in MS is insufficient to characterize the heterogeneity of plaques that may contain varying degrees of inflammation, demyelination, remyelination, axonal damage and gliosis.49 In contrast, regional MTR analysis shows differences between plaques that reflect differences in their histology49, 51 MTR has also been used to differentiate demyelination from edema,39 to measure myelin maturation,40, 53 to characterize periventricular hyperintense white matter disease in elderly patients,54 and to quantify white matter lesions in trauma55 and neurodegeneration.52, 56, 57
MTR has been used to examine Wallerian degeneration in the visual system of cats.52 MTR values in white matter of the visual system increase as a result of Wallerian degeneration within two weeks after injury, which is earlier than abnormalities could be detected using either spin-echo imaging or light microscopy.
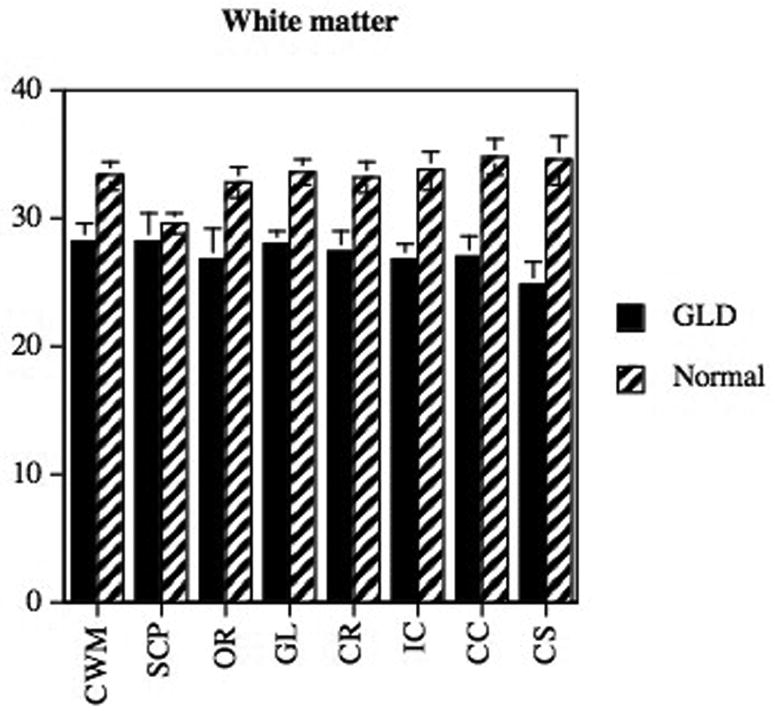
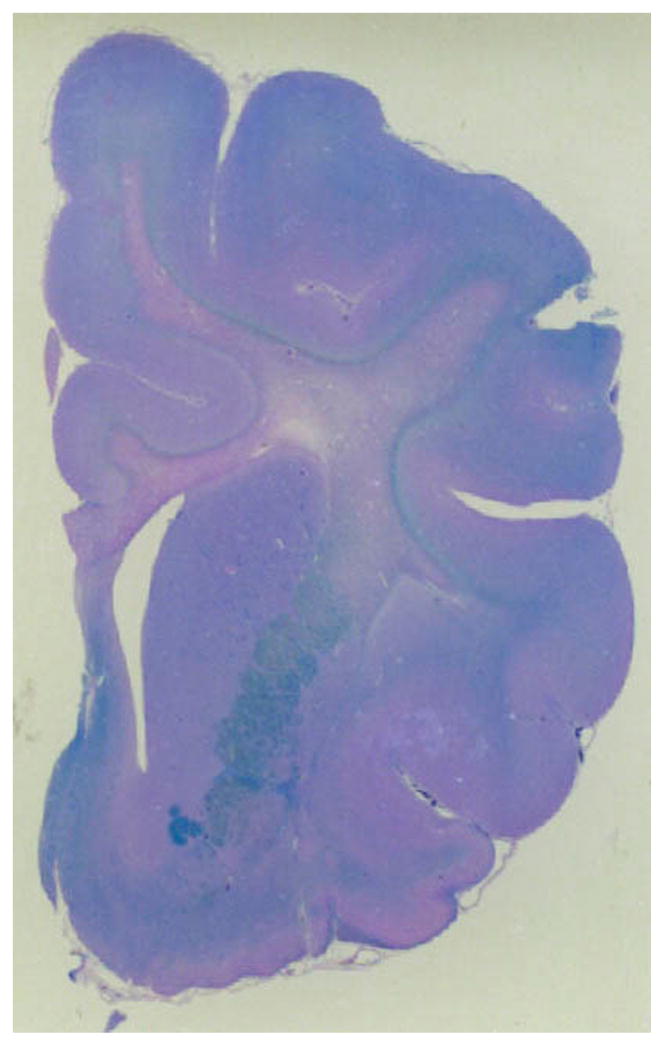
MTR has also been used to evaluate the maturation of brain myelin, the distribution and severity of abnormal myelination, and the effect of gene therapy on resolving myelination abnormalities in cats affected with the lysosomal storage disease alpha-mannosidosis.58, 59 In normal cats, regional increases in MTR of cerebral white matter are observed as myelin maturation occurs between 8 and 16 weeks of age. In contrast, cats with the dysmyelinating disease alpha-mannosidosis showed no such increase in MTR with time.58, 59 MTR has also been used in dogs to study distribution of abnormal myelination, using both region of interest analysis (Figure 5) and contour mapping.60
Figure 5.
MTR of white matter regions (A) in a dog with globoid cell leukodystrophy (GLD) compared to a normal age matched dog using previously described methods.60 Decreases in MTR were identified in the affected dog in all white matter tracts examined with the most significant differences occurring in the centrum semiovale, corpus callosum, and internal capsule (CWM, cerebellar white matter; SCP, superior cerebellar pednucle; OR, optic radiations; GL, corona radiata of gyrus lateralis; IC, internal capsule, CC, corpus callosum; CS, centrum semiovale). Changes observed on MRI are consistent with the microscopic changes seen in the white matter of the dog brain stained with Luxol fast blue (B; 25×).
The most frequent uses of MTI in clinical veterinary patients are probably following intravenous contrast administration to increase the conspicuity of enhancement of lesions or aid in performing time-of-flight angiographic studies. When using MTI in combination with gadolinium-containing contrast media, it is necessary to obtain pre-contrast magnetization transfer images in order to accurately identify enhancing lesions on post-contrast magnetization transfer images.61 Adding two sequences to a conventional protocol requires additional scan time. Similarly, acquiring MTR data to characterize brain pathology necessitates two additional imaging sequences (one with and one without saturation pulses), higher power deposition in tissue, and additional time for data analysis. The authors have used MTR data primarily to measure the severity of white matter lesions in specific genetic diseases and to develop outcome measures in therapy trials. Clinical use of MTR has been very limited.59, 60
Diffusion-weighted imaging (DWI)
DWI detects water molecule random motion, which is affected by various brain lesions, notably infarcts.41 The apparent diffusion coefficient (ADC) is a quantitative expression of water motion that is calculated from DW images generated using different gradient strengths (b-values). Free water, such as in the cerebral ventricles, has a low signal intensity on DW images and high ADC. In hyperacute infarction, cytotoxic edema appears hyperintense in DW images and hypointense on ADC.17, 62, 63 Low ADC correlates with the reduction in the extracellular volume fraction that occurs in infarction as a result of swelling of cells.64 As cell swelling resolves and necrosis occurs, ADC increases.42, 65 Similar correlations between low ADC and cellular swelling occur following toxin administration,66 status epilepticus,67 and hypoglycemia.68 ADC may also be used to differentiate cytotoxic edema, which decreases extracellular volume, from vasogenic edema, which increases it.69 In addition to cell swelling and size of the extracellular space, the mobility of extracellular water appears to be affected by its composition and the presence of cells. ADC has also been used to measure brain maturation;49 to differentiate epidermal cysts from arachnoid cysts, gliomas from abscesses, and ependymomas from oligodendrogliomas, and to determine tumor grade and cellularity.74
In dogs, DWI and ADC have been used for diagnosis and characterization of acute and chronic ischemic stroke17, 18, 70, 71 and as a marker of cytotoxic edema following status epilepticus.72 In cats, ADC has been used to detect neuronal swelling associated with experimental reversible ischemia42 and naturally-occurring alpha-mannosidosis, a lysosomal storage disease.73 In cats with alpha-mannosidosis, neuronal and glial swelling and astrogliosis occur together and all may contribute to reduced ADC.73
Diffusion tensor imaging (DTI) is a development of DWI that displays directional differences (anisotropy) in water diffusion.75, 76 DTI can be used to determine the location and orientation of white matter tracts, a technique known as diffusion tractography. This has proved useful in decreasing post-surgical morbidity,74 and characterizing abnormal myelination in multiple sclerosis.77 In cats, DTI has been used to study the development of association tracts in the cerebrum,78 and to evaluate the development of experimentally-induced vasogenic edema.79 Diffusion tractography of the feline cerebrum has also been used to examine the normal post-natal development of the subplate zone and cortical plate into mature cortical pathways.80
There are several important practical considerations when using DWI. 81,82 For example, strong gradients are necessary. Motion of the patient's head with respiration and/or the cardiac cycle may mask water diffusion in the brain and thus require further patient restraint or use of respiratory and/or cardiac gating. Patient temperature affects ADC measurements, hence the patient be maintained at a steady temperature, which for an anaesthetized animal may necessitate blowing warm air through the bore of the magnet. A limitation of diffusion tractography is that the reconstruction algorithms may not accurately display tracts that contain crossing, branching or bending fibers.81
Magnetic resonance spectroscopy
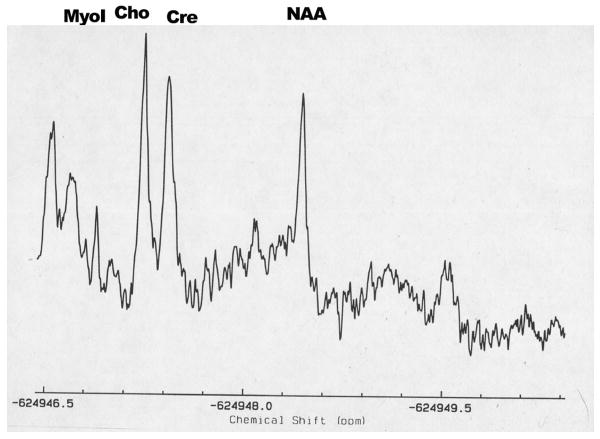
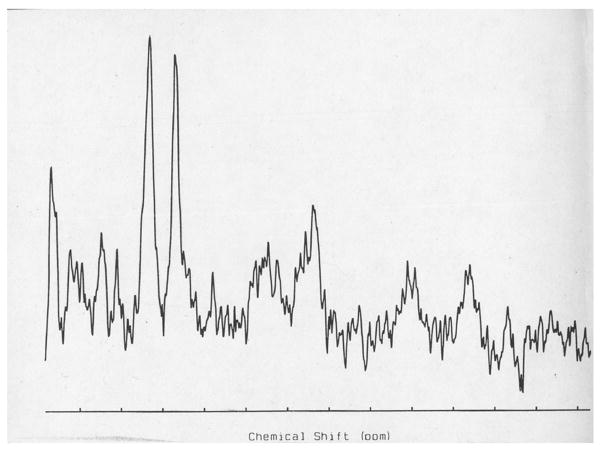
Magnetic resonance spectroscopy (MRS) may be used to non-invasively evaluate brain biochemistry by quantifying the concentrations of specific metabolites from spectra of metabolite distributions. Proton MRS can be used to detect lactate, creatine (Cr), choline (Cho), phosphocreatine, myoinositol (mI), N-acetylaspartate (NAA), glutamate, and other metabolites44 (Figure 6). These metabolites are involved in cellular energy metabolism, cell membrane synthesis, or serve as neuronal markers. For example, NAA is a marker of mature viable neurons (decreases in NAA are indicative of neuronal loss); Cho is a marker of membrane turnover (increases reflect membrane damage affecting myelin or neurons as well as gliosis); mI is a glial cell marker (increases may reflect gliosis); and lactate is a marker of anaerobic metabolism (increases may reflect metabolic abnormalities).44
Figure 6.
Proton MRS centered over the centrum semovale (A) of a dog with globoid cell leukodystrophy (GLD). Decreases in NAA (7.4 mM) and increases in choline (4.1 mM) were identified in the affected dog when compared to an unaffected dog (10.6mM and 3.1 mM respectively (B).
Concentrations of metabolites can reveal the biochemistry of specific disease processes including neoplasia,83-85 cerebral ischemia,86 metabolic encephalopathy,87 seizures88 and neurodegenerative disorders.1, 44, 89 In one study of MRS, the pattern of metabolites in a given brain volume was used to correctly classify 104 out of 105 brain tumors of 5 different types.83 MRS has been used to diagnose specific metabolic diseases such as Canavan's disease, which shows elevations in NAA, as well as to monitor response to therapy.90, 91 MRS methods have also been developed to detect administered compounds including specific anticancer agents such as fluorouracil, temozolomide and iproplatin92-94 and to noninvasively monitor the pharmacokinetics of specific anticancer agents.93-95
In cats with alpha-mannosidosis, in vivo MRS was capable of detecting increased concentrations of the oligosaccharides that are the specific intracellularly-stored substrates associated with this disease.96 In FIV-infected cats, in vivo and ex vivo MRS of the brain showed a reduction in both NAA and NAA/Cr ratio, increased trimethylamine/creatine ratio and increased glutamate concentrations in the brain.97-99 Focal brain ischemia in cats resulted in decreases in both NAA and Cr, and increase in lactate.100 Cardiac arrest in cats is associated with increased brain lactate concentrations that become elevated within five minutes of arrest and remain high for at least six hours following reperfusion.101
In dogs, MRS has also been used to characterize a number of brain diseases. Increases in glutamate/glutamine and lactate, and decreases in creatine were identified post-ictally.102 NAA and creatine were indirectly correlated with tumor volume, and lactate was directly correlated with tumor volume in an induced brain tumor study.103 Lactate concentrations were associated with intracranial hypertension during fulminant hepatic failure.104 NAA/Cho ratio was decreased in brain injury due to hypothermic circulatory arrest and the therapeutic efficacy of diazoxide was examined using this measure.105 Elevations in lactate/creatine and inositol/creatine ratios were used to evaluate cerebral tissue in studying thanatochronology.106
Practical considerations for performing MRS reflect the balance between maximizing signal-to-noise ratio by increasing voxel size versus achieving spatial accuracy in sampling, which requires a small voxel. Voxel size on 1.5 T scanners may exceed 1 cm3 and inclusion of calvaria within a large voxel cause magnetic field inhomogeneity and can lead to production of uninterpretable spectra. If it is suspected that brain pathology is regional or distributed asymmetrically throughout the brain, chemical shift imaging may be a useful alternative for comparing regional pathology.49
Correlating MR findings with clinical signs
Assessment that an MR abnormality is responsible for the clinical signs depends primarily on the degree of correspondence between the site of the lesion and the neuroanatomical localization. Proper neuroanatomical localization of a lesion is based on identification of clinical signs of dysfunction which commonly include 1) cerebral hemisphere/diencephalic dysfunction - altered mental status, circling with preservation of gait, postural reaction deficits, sensory abnormalities, loss of vision, pupillary abnormalities, and seizures, 2) brain stem dysfunction - altered mental status, vestibular and general proprioceptive ataxia, postural reaction deficits, sensory abnormalities, pupillary abnormalities, and cranial nerve dysfunction (excluding the olfactory and optic nerve), and, 3) cerebellar dysfunction – intention tremors, titubation, and cerebellar ataxia. Neurological examination lateralizing signs are also used to predict the lesion side. As a general but imperfect rule, lesions rostral to or including the midbrain are expected to cause contralateral deficits while lesions affecting the pons, medulla oblongata and / or the spinal cord result in ipsilateral deficits.
In many cases it is difficult to know whether an imaging abnormality is responsible for the clinical signs or is an incidental finding. For example, in animals with seizures, but without EEG corroboration of the seizure focus, MR studies at best identify structural or biochemical abnormalities that could result in abnormal electrical activity. Alternatively, some structural abnormalities that may result in neurological dysfunction, are frequently observed in animals without clinical signs. Examples of these include hydrocephalus, caudal occipital malformation syndrome, quadrigeminal cyst, and brain atrophy.
With regard to hydrocephalus, large variations in ventricular volume occur in many dog breeds.12 Indeed, in both human and veterinary patients hydrocephalus may occur in the absence of readily measureable clinical signs (see “Is your brain really necessary”107). In this example, which imaging criteria may be used to determine whether hydrocephalus is responsible for the identified clinical signs that may include behavioral abnormalities, altered mental status, ataxia, circling, blindness, or vestibular dysfunction?108 Although size might be expected to be an important factor, existing measures of ventriculomegaly do not correlate well with the presence of clinical signs.109 Other patient and physiological variables, including age at which hydrocephalus develops, location of the obstruction (if present), and rate at which the ventricles enlarge, probably reflect better the degree of brain damage and the likelihood of clinical signs.110 One study in children found a correlation between size (area) of the corpus callosum and motor ability and cognitive skills.111 Other studies have found some correlations between ventricular size and clinical signs; however, these findings do not enable diagnosis and do not predict outcome following shunt placement.112,113,114 Diagnosis of clinically significant, normal-pressure hydrocephalus is confirmed only by improvement in clinical signs following shunting of cerebrospinal fluid.113 A recent study concluded that NAA/Cr and NAA/Cho ratios of the periventricular white matter and phase-contrast MR imaging of cerebrospinal fluid flow at the mesencephalic aqueduct may be useful in predicting which patients could benefit from cerebrospinal fluid shunting.115 Hydrocephalus is one example of many conditions for which there is a need for MR measures that enable more specific diagnosis and prediction of therapeutic outcome.
Acknowledgments
Drs. J. McGowan and H. Poptani, Mr. N. Butler, and Mrs. A. Basatemur for assistance in acquiring NMR data.
Funding sources: Supported by NIH grant RR02512.
References
- 1.van der Knaap MS, van der Grond J, Luyten PR, den Hollander JA, Nauta JJ, Valk J. 1H and 31P magnetic resonance spectroscopy of the brain in degenerative cerebral disorders. Ann Neurol. 1992;31:202–211. doi: 10.1002/ana.410310211. [DOI] [PubMed] [Google Scholar]
- 2.Grossman RI, Hecht-Leavitt CM, Evans SM, Lenkinski RE, Holland GA, Van Winkle TJ, et al. Experimental radiation injury: combined MR imaging and spectroscopy. Radiology. 1988;169:305–309. doi: 10.1148/radiology.169.2.3174977. [DOI] [PubMed] [Google Scholar]
- 3.Kimotsuki T, Nagaoka T, Yasuda M, Tamahara S, Matsuki N, Ono K. Changes of magnetic resonance imaging on the brain in beagle dogs with aging. J Vet Med Sci. 2005;67:961–967. doi: 10.1292/jvms.67.961. [DOI] [PubMed] [Google Scholar]
- 4.Carrera I, Dennis R, Mellor DJ, Penderis J, Sullivan M. Use of magnetic resonance imaging for morphometric analysis of the caudal cranial fossa in Cavalier King Charles Spaniels. Am J Vet Res. 2009;70:340–345. doi: 10.2460/ajvr.70.3.340. [DOI] [PubMed] [Google Scholar]
- 5.Rusbridge C. Chiari-like malformation with syringomyelia in the cavalier King Charles spaniel: Long-term outcome after surgical management. Vet Surg. 2007;36:396–405. doi: 10.1111/j.1532-950X.2007.00285.x. [DOI] [PubMed] [Google Scholar]
- 6.Cross HR, Cappello R, Rusbridge C. Comparison of cerebral cranium volumes between cavalier King Charles spaniels with Chiari-like malformation, small breed dogs and Labradors. J Small Anim Pract. 2009;50:399–405. doi: 10.1111/j.1748-5827.2009.00799.x. [DOI] [PubMed] [Google Scholar]
- 7.Vernau KM, Kortz GD, Koblik PD, LeCouteur RA, Bailey CS, Pedroia V. Magnetic resonance imaging and computed tomography characteristics of intracranial intra-arachnoid cysts in 6 dogs. Vet Radiol Ultrasound. 1997;38:171–176. doi: 10.1111/j.1740-8261.1997.tb00835.x. [DOI] [PubMed] [Google Scholar]
- 8.Kitagawa M, Kanayama K, Sakai T. Quadrigeminal cisterna arachnoid cyst diagnosed by MRI in five dogs. Aust Vet J. 2003;81:340–343. doi: 10.1111/j.1751-0813.2003.tb11509.x. [DOI] [PubMed] [Google Scholar]
- 9.Matiasek LA, Platt SR, Shaw S, Dennis R. Clinical and magnetic resonance imaging characteristics of quadrigeminal cysts in dogs. J Vet Intern Med. 2007;21:1021–1026. doi: 10.1892/0891-6640(2007)21[1021:camric]2.0.co;2. [DOI] [PubMed] [Google Scholar]
- 10.Vullo T, Korenman E, Manzo RP, Gomez DG, Deck MDF, Cahill PT. Diagnosis of cerebral ventriculomegaly in normal adult beagles using quantitative MRI. Vet Radiol Ultrasound. 1997;38:277–281. doi: 10.1111/j.1740-8261.1997.tb00855.x. [DOI] [PubMed] [Google Scholar]
- 11.Vite CH, Insko EK, Schotland HM, Panckeri K, Hendricks JC. Quantification of cerebral ventricular volume in English bulldogs. Vet Radiol Ultrasound. 1997;38:437–443. doi: 10.1111/j.1740-8261.1997.tb00868.x. [DOI] [PubMed] [Google Scholar]
- 12.Vullo T, Korenman E, Manzo RP, Gomez DG, Deck MD, Cahill PT. Diagnosis of cerebral ventriculomegaly in normal adult beagles using quantitative MRI. Vet Radiol Ultrasound. 1997;38:277–281. doi: 10.1111/j.1740-8261.1997.tb00855.x. [DOI] [PubMed] [Google Scholar]
- 13.Henke D, Bottcher P, Doherr MG, Oechtering G, Flegel T. Computer-assisted magnetic resonance imaging brain morphometry in American Staffordshire Terriers with cerebellar cortical degeneration. J Vet Intern Med. 2008;22:969–975. doi: 10.1111/j.1939-1676.2008.0138.x. [DOI] [PubMed] [Google Scholar]
- 14.Thames RA, Robertson ID, Flegel T, Henke D, O'Brien DP, Coates JR, et al. Development of a morphometric magnetic resonance image parameter suitable for distinguishing between normal dogs and dogs with cerebellar atrophy. Vet Radiol Ultrasound. 2010;51:246–253. doi: 10.1111/j.1740-8261.2009.01655.x. [DOI] [PubMed] [Google Scholar]
- 15.Young BD, Levine JM, Fosgate GT, de Lahunta A, Flegel T, Matiasek K, et al. Magnetic resonance imaging characteristics of necrotizing meningoencephalitis in Pug dogs. J Vet Intern Med. 2009;23:527–535. doi: 10.1111/j.1939-1676.2009.0306.x. [DOI] [PubMed] [Google Scholar]
- 16.Cherubini GB, Platt SR, Anderson TJ, Rusbridge C, Lorenzo V, Mantis P, et al. Characteristics of magnetic resonance images of granulomatous meningoencephalomyelitis in 11 dogs. Vet Rec. 2006;159:110–115. doi: 10.1136/vr.159.4.110. [DOI] [PubMed] [Google Scholar]
- 17.Garosi L, McConnell JF, Platt SR, Barone G, Baron JC, de Lahunta A, et al. Clinical and topographic magnetic resonance characteristics of suspected brain infarction in 40 dogs. J Vet Intern Med. 2006;20:311–321. doi: 10.1892/0891-6640(2006)20[311:catmrc]2.0.co;2. [DOI] [PubMed] [Google Scholar]
- 18.McConnell JF, Garosi L, Platt SR. Magnetic resonance imaging findings of presumed cerebellar cerebrovascular accident in twelve dogs. Vet Radiol Ultrasound. 2005;46:1–10. doi: 10.1111/j.1740-8261.2005.00001.x. [DOI] [PubMed] [Google Scholar]
- 19.Auriemma E, Barthez PY, van der Vlugt-Meijer RH, Voorhout G, Meij BP. Computed tomography and low-field magnetic resonance imaging of the pituitary gland in dogs with pituitary-dependent hyperadrenocorticism: 11 cases (2001-2003) J Am Vet Med Assoc. 2009;235:409–414. doi: 10.2460/javma.235.4.409. [DOI] [PubMed] [Google Scholar]
- 20.Kent MS, Bommarito D, Feldman E, Theon AP. Survival, neurologic response, and prognostic factors in dogs with pituitary masses treated with radiation therapy and untreated dogs. J Vet Intern Med. 2007;21:1027–1033. doi: 10.1892/0891-6640(2007)21[1027:snrapf]2.0.co;2. [DOI] [PubMed] [Google Scholar]
- 21.Westworth DR, Dickinson PJ, Vernau W, Johnson EG, Bollen AW, Kass PH, et al. Choroid plexus tumors in 56 dogs (1985-2007) J Vet Intern Med. 2008;22:1157–1165. doi: 10.1111/j.1939-1676.2008.0170.x. [DOI] [PubMed] [Google Scholar]
- 22.Lipsitz D, Higgins RJ, Kortz GD, Dickinson PJ, Bollen AW, Naydan DK, et al. Glioblastoma multiforme: clinical findings, magnetic resonance imaging, and pathology in five dogs. Vet Pathol. 2003;40:659–669. doi: 10.1354/vp.40-6-659. [DOI] [PubMed] [Google Scholar]
- 23.Troxel MT, Vite CH, Massicotte C, McLear RC, Van Winkle TJ, Glass EN, et al. Magnetic resonance imaging features of feline intracranial neoplasia: retrospective analysis of 46 cats. J Vet Intern Med. 2004;18:176–189. doi: 10.1892/0891-6640(2004)18<176:mrifof>2.0.co;2. [DOI] [PubMed] [Google Scholar]
- 24.Polizopoulou ZS, Koutinas AF, Souftas VD, Kaldrymidou E, Kazakos G, Papadopoulos G. Diagnostic correlation of CT-MRI and histopathology in 10 dogs with brain neoplasms. J Vet Med A Physiol Pathol Clin Med. 2004;51:226–231. doi: 10.1111/j.1439-0442.2004.00633.x. [DOI] [PubMed] [Google Scholar]
- 25.Sturges BK, Dickinson PJ, Bollen AW, Koblik PD, Kass PH, Kortz GD, et al. Magnetic resonance imaging and histological classification of intracranial meningiomas in 112 dogs. J Vet Intern Med. 2008;22:586–595. doi: 10.1111/j.1939-1676.2008.00042.x. [DOI] [PubMed] [Google Scholar]
- 26.Kraft SL, Gavin PR, DeHaan C, Moore M, Wendling LR, Leathers CW. Retrospective review of 50 canine intracranial tumors evaluated by magnetic resonance imaging. J Vet Intern Med. 1997;11:218–225. doi: 10.1111/j.1939-1676.1997.tb00094.x. [DOI] [PubMed] [Google Scholar]
- 27.Cherubini GB, Mantis P, Martinez TA, Lamb CR, Cappello R. Utility of magnetic resonance imaging for distinguishing neoplastic from non-neoplastic brain lesions in dogs and cats. Vet Radiol Ultrasound. 2005;46:384–387. doi: 10.1111/j.1740-8261.2005.00069.x. [DOI] [PubMed] [Google Scholar]
- 28.Summers BA, Cummings JF, de Lahunta A. Veterinary Neuropathology. St Louis: Mosby-Year Book; 1995. [Google Scholar]
- 29.Koestner A, Bilzer T, Schulman FY, Summers BA, Van Winkle TJ. Histological classification of tumors of the nervous system of domestic animals. Washington DC: Armed Forces Institute of Pathology; 1999. [Google Scholar]
- 30.Snyder JM, Shofer FS, Van Winkle TJ, Massicotte C. Canine intracranial primary neoplasia: 173 cases (1986-2003) J Vet Intern Med. 2006;20:669–675. doi: 10.1892/0891-6640(2006)20[669:cipnc]2.0.co;2. [DOI] [PubMed] [Google Scholar]
- 31.Snyder JM, Lipitz L, Skorupski KA, Shofer FS, Van Winkle TJ. Secondary intracranial neoplasia in the dog: 177 cases (1986-2003) J Vet Intern Med. 2008;22:172–177. doi: 10.1111/j.1939-1676.2007.0002.x. [DOI] [PubMed] [Google Scholar]
- 32.Troxel MT, Vite CH, Van Winkle TJ, Newton AL, Tiches D, Dayrell-Hart B, et al. Feline intracranial neoplasia: retrospective review of 160 cases (1985-2001) J Vet Intern Med. 2003;17:850–859. doi: 10.1111/j.1939-1676.2003.tb02525.x. [DOI] [PubMed] [Google Scholar]
- 33.Cordy DR, Holliday TA. A necrotizing meningoencephalitis of pug dogs. Vet Pathol. 1989;26:191–194. doi: 10.1177/030098588902600301. [DOI] [PubMed] [Google Scholar]
- 34.Stalis IH, Chadwick B, Dayrell-Hart B, Summers BA, Van Winkle TJ. Necrotizing meningoencephalitis of Maltese dogs. Vet Pathol. 1995;32:230–235. doi: 10.1177/030098589503200303. [DOI] [PubMed] [Google Scholar]
- 35.Braund KG. Granulomatous meningoencephalomyelitis. J Am Vet Med Assoc. 1985;186:138–141. [PubMed] [Google Scholar]
- 36.Wenger DA, Victoria T, Rafi MA, Luzi P, Vanier MT, Vite C, et al. Globoid cell leukodystrophy in cairn and West Highland white terriers. J Hered. 1999;90:138–142. doi: 10.1093/jhered/90.1.138. [DOI] [PubMed] [Google Scholar]
- 37.Jortner BS, Jonas AM. The neuropathology of globoid-cell leucodystrophy in the dog. A report of two cases. Acta Neuropathol. 1968;10:171–182. doi: 10.1007/BF00687720. [DOI] [PubMed] [Google Scholar]
- 38.Cervera V, Mai W, Vite CH, Sanchez M, Johnson V, Dqyrell-Hart B, et al. Comparative magnetic resonance imaging findings between gliomas and presumed infarcts. Veterinary Radiology and Ultrasound. in press. [PubMed] [Google Scholar]
- 39.Dousset V, Grossman RI, Ramer KN, Schnall MD, Young LH, Gonzalez-Scarano F, et al. Experimental allergic encephalomyelitis and multiple sclerosis: lesion characterization with magnetization transfer imaging. Radiology. 1992;182:483–491. doi: 10.1148/radiology.182.2.1732968. [DOI] [PubMed] [Google Scholar]
- 40.Grossman RI. Application of magnetization transfer imaging to multiple sclerosis. Neurology. 1999;53:S8–11. [PubMed] [Google Scholar]
- 41.Le Bihan D, Turner R, Douek P, Patronas N. Diffusion MR imaging: clinical applications. Am J Roentgenol. 1992;159:591–599. doi: 10.2214/ajr.159.3.1503032. [DOI] [PubMed] [Google Scholar]
- 42.Davis D, Ulatowski J, Eleff S, Izuta M, Mori S, Shungu D, et al. Rapid monitoring of changes in water diffusion coefficients during reversible ischemia in cat and rat brain. Magn Reson Med. 1994;31:454–460. doi: 10.1002/mrm.1910310416. [DOI] [PubMed] [Google Scholar]
- 43.Dijkhuizen RM, de Graaf RA, Tulleken KA, Nicolay K. Changes in the diffusion of water and intracellular metabolites after excitotoxic injury and global ischemia in neonatal rat brain. J Cereb Blood Flow Metab. 1999;19:341–349. doi: 10.1097/00004647-199903000-00012. [DOI] [PubMed] [Google Scholar]
- 44.Lenkinski RE, Schnall MD. MR spectroscopy and the biochemical basis of neurological disease. In: Atlas SW, editor. Magnetic resonance imaging of the brain and spine. Philadelphia: Lippincott-Raven; 1996. [Google Scholar]
- 45.Hajnal JV, Baudouin CJ, Oatridge A. Design and implementation of magnetization transfer pulse sequences for clinical use. J Comput Assist Tomogr. 1992;16:7–18. doi: 10.1097/00004728-199201000-00003. [DOI] [PubMed] [Google Scholar]
- 46.Cox IH, Roberts TPL, M ME. Principles and techniques in neuroimaging. In: Kucharcyzk J, Moseley M, Barkovich AJ, editors. Magnetic Resonance Neuroimaging. Boca Raton: CRC Press; 1994. pp. 1–102. [Google Scholar]
- 47.Bagley LJ, Grossman RI, McGowan JC. Magnetization transfer contrast: its utility as a technique and its application to central nervous system pathology. Neurology. 1999;53:S49–51. [PubMed] [Google Scholar]
- 48.Runge VM, Wells JW, Williams NM, Lee C, Timoney JF, Young AB. Detectability of early brain meningitis with magnetic resonance imaging. Invest Radiol. 1995;30:484–495. doi: 10.1097/00004424-199508000-00006. [DOI] [PubMed] [Google Scholar]
- 49.Tofts P. Quantitative MRI of the brain : measuring changes caused by disease. Chichester, West Sussex ; Hoboken, NJ: Wiley; 2003. [Google Scholar]
- 50.Brochet B, Dousset V. Pathological correlates of magnetization transfer imaging abnormalities in animal models and humans with multiple sclerosis. Neurology. 1999;53:S12–17. [PubMed] [Google Scholar]
- 51.Schmierer K, Scaravilli F, Altmann DR, Barker GJ, Miller DH. Magnetization transfer ratio and myelin in postmortem multiple sclerosis brain. Ann Neurol. 2004;56:407–415. doi: 10.1002/ana.20202. [DOI] [PubMed] [Google Scholar]
- 52.Lexa FJ, Grossman RI, Rosenquist AC. Dyke Award paper. MR of wallerian degeneration in the feline visual system: characterization by magnetization transfer rate with histopathologic correlation. Am J Neuroradiol. 1994;15:201–212. [PMC free article] [PubMed] [Google Scholar]
- 53.Rademacher J, Engelbrecht V, Burgel U, Freund H, Zilles K. Measuring in vivo myelination of human white matter fiber tracts with magnetization transfer MR. Neuroimage. 1999;9:393–406. doi: 10.1006/nimg.1998.0416. [DOI] [PubMed] [Google Scholar]
- 54.Wong KT, Grossman RI, Boorstein JM, Lexa FJ, McGowan JC. Magnetization transfer imaging of periventricular hyperintense white matter in the elderly. Am J Neuroradiol. 1995;16:253–258. [PMC free article] [PubMed] [Google Scholar]
- 55.McGowan JC, McCormack TM, Grossman RI, Mendonca R, Chen XH, Berlin JA, et al. Diffuse axonal pathology detected with magnetization transfer imaging following brain injury in the pig. Magn Reson Med. 1999;41:727–733. doi: 10.1002/(sici)1522-2594(199904)41:4<727::aid-mrm11>3.0.co;2-6. [DOI] [PubMed] [Google Scholar]
- 56.Hanyu H, Asano T, Sakurai H, Imon Y, Iwamoto T, Takasaki M, et al. Diffusion-weighted and magnetization transfer imaging of the corpus callosum in Alzheimer's disease. J Neurol Sci. 1999;167:37–44. doi: 10.1016/s0022-510x(99)00135-5. [DOI] [PubMed] [Google Scholar]
- 57.Lexa FJ, Grossman RI, Rosenquist AC. Detection of early axonal degeneration in the mammalian central nervous system by magnetization transfer techniques in magnetic resonance imaging. Ann N Y Acad Sci. 1993;679:336–340. doi: 10.1111/j.1749-6632.1993.tb18318.x. [DOI] [PubMed] [Google Scholar]
- 58.Vite CH, McGowan JC, Braund KG, Drobatz KJ, Glickson JD, Wolfe JH, et al. Histopathology, electrodiagnostic testing, and magnetic resonance imaging show significant peripheral and central nervous system myelin abnormalities in the cat model of alpha-mannosidosis. J Neuropathol Exp Neurol. 2001;60:817–828. doi: 10.1093/jnen/60.8.817. [DOI] [PubMed] [Google Scholar]
- 59.Vite CH, McGowan JC, Niogi SN, Passini MA, Drobatz KJ, Haskins ME, et al. Effective gene therapy for an inherited CNS disease in a large animal model. Ann Neurol. 2005;57:355–364. doi: 10.1002/ana.20392. [DOI] [PubMed] [Google Scholar]
- 60.McGowan JC, Haskins M, Wenger DA, Vite C. Investigating demyelination in the brain in a canine model of globoid cell leukodystrophy (Krabbe disease) using magnetization transfer contrast: preliminary results. J Comput Assist Tomogr. 2000;24:316–321. doi: 10.1097/00004728-200003000-00025. [DOI] [PubMed] [Google Scholar]
- 61.Meyer JR, Androux RW, Salamon N, Rabin B, Callahan C, Parrish TB, et al. Contrast-enhanced magnetization transfer MR of the brain: importance of precontrast images. Am J Neuroradiol. 1997;18:1515–1521. [PMC free article] [PubMed] [Google Scholar]
- 62.Moseley ME, Cohen Y, Mintorovitch J, Chileuitt L, Shimizu H, Kucharczyk J, et al. Early detection of regional cerebral ischemia in cats: comparison of diffusion- and T2-weighted MRI and spectroscopy. Magn Reson Med. 1990;14:330–346. doi: 10.1002/mrm.1910140218. [DOI] [PubMed] [Google Scholar]
- 63.Grossman RI, Yousem DM. Neuroradiology: The requisites. St Louis: Mosby; 1994. [Google Scholar]
- 64.Sotak CH. Nuclear magnetic resonance (NMR) measurement of the apparent diffusion coefficient (ADC) of tissue water and its relationship to cell volume changes in pathological states. Neurochem Int. 2004;45:569–582. doi: 10.1016/j.neuint.2003.11.010. [DOI] [PubMed] [Google Scholar]
- 65.Lutsep HL, Albers GW, DeCrespigny A, Kamat GN, Marks MP, Moseley ME. Clinical utility of diffusion-weighted magnetic resonance imaging in the assessment of ischemic stroke. Ann Neurol. 1997;41:574–580. doi: 10.1002/ana.410410505. [DOI] [PubMed] [Google Scholar]
- 66.Buckley DL, Bui JD, Phillips MI, Zelles T, Inglis BA, Plant HD, et al. The effect of ouabain on water diffusion in the rat hippocampal slice measured by high resolution NMR imaging. Magn Reson Med. 1999;41:137–142. doi: 10.1002/(sici)1522-2594(199901)41:1<137::aid-mrm19>3.0.co;2-y. [DOI] [PubMed] [Google Scholar]
- 67.Zhong J, Petroff OA, Prichard JW, Gore JC. Changes in water diffusion and relaxation properties of rat cerebrum during status epilepticus. Magn Reson Med. 1993;30:241–246. doi: 10.1002/mrm.1910300214. [DOI] [PubMed] [Google Scholar]
- 68.Hasegawa Y, Formato JE, Latour LL, Gutierrez JA, Liu KF, Garcia JH, et al. Severe transient hypoglycemia causes reversible change in the apparent diffusion coefficient of water. Stroke. 1996;27:1648–1655. doi: 10.1161/01.str.27.9.1648. discussion 1655-1646. [DOI] [PubMed] [Google Scholar]
- 69.Schaefer PW, Buonanno FS, Gonzalez RG, Schwamm LH. Diffusion-weighted imaging discriminates between cytotoxic and vasogenic edema in a patient with eclampsia. Stroke. 1997;28:1082–1085. doi: 10.1161/01.str.28.5.1082. [DOI] [PubMed] [Google Scholar]
- 70.Kang BT, Jang DP, Gu SH, Lee JH, Jung DI, Lim CY, et al. MRI features in a canine model of ischemic stroke: correlation between lesion volume and neurobehavioral status during the subacute stage. Comp Med. 2009;59:459–464. [PMC free article] [PubMed] [Google Scholar]
- 71.Shaibani A, Khawar S, Shin W, Cashen TA, Schirf B, Rohany M, et al. First results in an MR imaging--compatible canine model of acute stroke. Am J Neuroradiol. 2006;27:1788–1793. [PMC free article] [PubMed] [Google Scholar]
- 72.Hasegawa D, Orima H, Fujita M, Nakamura S, Takahashi K, Ohkubo S, et al. Diffusion-weighted imaging in kainic acid-induced complex partial status epilepticus in dogs. Brain Res. 2003;983:115–127. doi: 10.1016/s0006-8993(03)03041-5. [DOI] [PubMed] [Google Scholar]
- 73.Vite CH, Magnitsky S, Aleman D, O'Donnell P, Cullen K, Ding W, et al. Apparent diffusion coefficient reveals gray and white matter disease, and T2 mapping detects white matter disease in the brain in feline alpha-mannosidosis. Am J Neuroradiol. 2008;29:308–313. doi: 10.3174/ajnr.A0791. [DOI] [PMC free article] [PubMed] [Google Scholar]
- 74.Mechtler L. Neuroimaging in neuro-oncology. Neurol Clin. 2009;27:171–201. ix. doi: 10.1016/j.ncl.2008.09.015. [DOI] [PubMed] [Google Scholar]
- 75.Taylor WD, Payne ME, Krishnan KR, Wagner HR, Provenzale JM, Steffens DC, et al. Evidence of white matter tract disruption in MRI hyperintensities. Biol Psychiatry. 2001;50:179–183. doi: 10.1016/s0006-3223(01)01160-x. [DOI] [PubMed] [Google Scholar]
- 76.Werring DJ, Brassat D, Droogan AG, Clark CA, Symms MR, Barker GJ, et al. The pathogenesis of lesions and normal-appearing white matter changes in multiple sclerosis: a serial diffusion MRI study. Brain. 2000;123(8):1667–1676. doi: 10.1093/brain/123.8.1667. [DOI] [PubMed] [Google Scholar]
- 77.Werring DJ, Clark CA, Barker GJ, Thompson AJ, Miller DH. Diffusion tensor imaging of lesions and normal-appearing white matter in multiple sclerosis. Neurology. 1999;52:1626–1632. doi: 10.1212/wnl.52.8.1626. [DOI] [PubMed] [Google Scholar]
- 78.Takahashi E, Dai G, Wang R, Ohki K, Rosen GD, Galaburda AM, et al. Development of cerebral fiber pathways in cats revealed by diffusion spectrum imaging. Neuroimage. 2010;49:1231–1240. doi: 10.1016/j.neuroimage.2009.09.002. [DOI] [PMC free article] [PubMed] [Google Scholar]
- 79.Zhao FY, Kuroiwa T, Miyasakai N, Tanabe F, Nagaoka T, Akimoto H, et al. Diffusion tensor feature in vasogenic brain edema in cats. Acta Neurochir Suppl. 2006;96:168–170. doi: 10.1007/3-211-30714-1_37. [DOI] [PubMed] [Google Scholar]
- 80.Takahashi E, Dai G, Rosen GD, Wang R, Ohki K, Folkerth RD, et al. Developing neocortex organization and connectivity in cats revealed by direct correlation of diffusion tractography and histology. Cereb Cortex. doi: 10.1093/cercor/bhq084. Epub 2010 May 21. [DOI] [PMC free article] [PubMed] [Google Scholar]
- 81.Le Bihan D, Poupon C, Amadon A, Lethimonnier F. Artifacts and pitfalls in diffusion MRI. J Magn Reson Imaging. 2006;24:478–488. doi: 10.1002/jmri.20683. [DOI] [PubMed] [Google Scholar]
- 82.Gass A, Niendorf T, Hirsch JG. Acute and chronic changes of the apparent diffusion coefficient in neurological disorders--biophysical mechanisms and possible underlying histopathology. J Neurol Sci. 2001;186 1:S15–23. doi: 10.1016/s0022-510x(01)00487-7. [DOI] [PubMed] [Google Scholar]
- 83.Preul MC, Caramanos Z, Collins DL, Villemure JG, Leblanc R, Olivier A, et al. Accurate, noninvasive diagnosis of human brain tumors by using proton magnetic resonance spectroscopy. Nat Med. 1996;2:323–325. doi: 10.1038/nm0396-323. [DOI] [PubMed] [Google Scholar]
- 84.Kinoshita Y, Kajiwara H, Yokota A, Koga Y. Proton magnetic resonance spectroscopy of brain tumors: an in vitro study. Neurosurgery. 1994;35:606–613. doi: 10.1227/00006123-199410000-00005. discussion 613-604. [DOI] [PubMed] [Google Scholar]
- 85.Negendank WG, Sauter R, Brown TR, Evelhoch JL, Falini A, Gotsis ED, et al. Proton magnetic resonance spectroscopy in patients with glial tumors: a multicenter study. J Neurosurg. 1996;84:449–458. doi: 10.3171/jns.1996.84.3.0449. [DOI] [PubMed] [Google Scholar]
- 86.Barker PB, Gillard JH, van Zijl PC, Soher BJ, Hanley DF, Agildere AM, et al. Acute stroke: evaluation with serial proton MR spectroscopic imaging. Radiology. 1994;192:723–732. doi: 10.1148/radiology.192.3.8058940. [DOI] [PubMed] [Google Scholar]
- 87.Ross BD, Jacobson S, Villamil F, Korula J, Kreis R, Ernst T, et al. Subclinical hepatic encephalopathy: proton MR spectroscopic abnormalities. Radiology. 1994;193:457–463. doi: 10.1148/radiology.193.2.7972763. [DOI] [PubMed] [Google Scholar]
- 88.Ng TC, Comair YG, Xue M, So N, Majors A, Kolem H, et al. Temporal lobe epilepsy: presurgical localization with proton chemical shift imaging. Radiology. 1994;193:465–472. doi: 10.1148/radiology.193.2.7972764. [DOI] [PubMed] [Google Scholar]
- 89.Tzika AA, Ball WS, Jr, Vigneron DB, Dunn RS, Kirks DR. Clinical proton MR spectroscopy of neurodegenerative disease in childhood. Am J Neuroradiol. 1993;14:1267–1281. discussion 1282-1264. [PMC free article] [PubMed] [Google Scholar]
- 90.Grodd W, Krageloh-Mann I, Petersen D, Trefz FK, Harzer K. In vivo assessment of N-acetylaspartate in brain in spongy degeneration (Canavan's disease) by proton spectroscopy. Lancet. 1990;336:437–438. doi: 10.1016/0140-6736(90)91982-g. [DOI] [PubMed] [Google Scholar]
- 91.Krageloh-Mann I, Grodd W, Niemann G, Haas G, Ruitenbeek W. Assessment and therapy monitoring of Leigh disease by MRI and proton spectroscopy. Pediatr Neurol. 1992;8:60–64. doi: 10.1016/0887-8994(92)90055-4. [DOI] [PubMed] [Google Scholar]
- 92.Presant CA, Wolf W, Waluch V, Wiseman C, Kennedy P, Blayney D, et al. Association of intratumoral pharmacokinetics of fluorouracil with clinical response. Lancet. 1994;343:1184–1187. doi: 10.1016/s0140-6736(94)92399-x. [DOI] [PubMed] [Google Scholar]
- 93.Artemov D, Bhujwalla ZM, Maxwell RJ, Griffiths JR, Judson IR, Leach MO, et al. Pharmacokinetics of the 13C labeled anticancer agent temozolomide detected in vivo by selective cross-polarization transfer. Magn Reson Med. 1995;34:338–342. doi: 10.1002/mrm.1910340310. [DOI] [PubMed] [Google Scholar]
- 94.He Q, Bhujwalla ZM, Maxwell RJ, Griffiths JR, Glickson JD. Proton NMR observation of the antineoplastic agent Iproplatin in vivo by selective multiple quantum coherence transfer (Sel-MQC) Magn Reson Med. 1995;33:414–416. doi: 10.1002/mrm.1910330315. [DOI] [PubMed] [Google Scholar]
- 95.Newell DR, Maxwell RJ, Golding BT. In vivo and ex vivo magnetic resonance spectroscopy as applied to pharmacokinetic studies with anticancer agents: a review. NMR in Biomed. 1992;5:273–278. doi: 10.1002/nbm.1940050514. [DOI] [PubMed] [Google Scholar]
- 96.Magnitsky S, Vite CH, Delikatny EJ, Pickup S, Wehrli S, Wolfe JH, et al. Magnetic resonance spectroscopy of the occipital cortex and the cerebellar vermis distinguishes individual cats affected with alpha-mannosidosis from normal cats. NMR Biomed. 2010;23:74–79. doi: 10.1002/nbm.1430. [DOI] [PMC free article] [PubMed] [Google Scholar]
- 97.Johnston JB, Silva C, Hiebert T, Buist R, Dawood MR, Peeling J, et al. Neurovirulence depends on virus input titer in brain in feline immunodeficiency virus infection: evidence for activation of innate immunity and neuronal injury. J Neurovirol. 2002;8:420–431. doi: 10.1080/13550280260422721. [DOI] [PubMed] [Google Scholar]
- 98.Podell M, Maruyama K, Smith M, Hayes KA, Buck WR, Ruehlmann DS, et al. Frontal lobe neuronal injury correlates to altered function in FIV-infected cats. J Acquir Immune Defic Syndr. 1999;22:10–18. doi: 10.1097/00042560-199909010-00002. [DOI] [PubMed] [Google Scholar]
- 99.Power C, Moench T, Peeling J, Kong PA, Langelier T. Feline immunodeficiency virus causes increased glutamate levels and neuronal loss in brain. Neuroscience. 1997;77:1175–1185. doi: 10.1016/s0306-4522(96)00531-3. [DOI] [PubMed] [Google Scholar]
- 100.van der Toorn A, Verheul HB, Berkelbach van der Sprenkel JW, Tulleken CA, Nicolay K. Changes in metabolites and tissue water status after focal ischemia in cat brain assessed with localized proton MR spectroscopy. Magn Reson Med. 1994;32:685–691. doi: 10.1002/mrm.1910320602. [DOI] [PubMed] [Google Scholar]
- 101.Krep H, Bottiger BW, Bock C, Kerskens CM, Radermacher B, Fischer M, et al. Time course of circulatory and metabolic recovery of cat brain after cardiac arrest assessed by perfusion- and diffusion-weighted imaging and MR-spectroscopy. Resuscitation. 2003;58:337–348. doi: 10.1016/s0300-9572(03)00151-5. [DOI] [PubMed] [Google Scholar]
- 102.Neppl R, Nguyen CM, Bowen W, Al-Saadi T, Pallagi J, Morris G, et al. In vivo detection of postictal perturbations of cerebral metabolism by use of proton MR spectroscopy: preliminary results in a canine model of prolonged generalized seizures. Am J Neuroradiol. 2001;22:1933–1943. [PMC free article] [PubMed] [Google Scholar]
- 103.Anderson JH, Strandberg JD, Wong DF, Conti PS, Barker PB, Blackband SJ, et al. Multimodality correlative study of canine brain tumors. Proton magnetic resonance spectroscopy, positron emission tomography, and histology. Invest Radiol. 1994;29:597–605. doi: 10.1097/00004424-199406000-00001. [DOI] [PubMed] [Google Scholar]
- 104.Nyberg SL, Cerra FB, Gruetter R. Brain lactate by magnetic resonance spectroscopy during fulminant hepatic failure in the dog. Liver Transpl Surg. 1998;4:158–165. doi: 10.1002/lt.500040203. [DOI] [PubMed] [Google Scholar]
- 105.Barreiro CJ, Williams JA, Fitton TP, Lange MS, Blue ME, Kratz L, et al. Noninvasive assessment of brain injury in a canine model of hypothermic circulatory arrest using magnetic resonance spectroscopy. Ann Thorac Surg. 2006;81:1593–1598. doi: 10.1016/j.athoracsur.2006.01.011. [DOI] [PubMed] [Google Scholar]
- 106.Choe BY, Gil HJ, Suh TS, Shinn KS. Postmortem metabolic and morphologic alterations of the dog brain thalamus with use of in vivo 1H magnetic resonance spectroscopy and electron microscopy. Invest Radiol. 1995;30:269–274. doi: 10.1097/00004424-199505000-00001. [DOI] [PubMed] [Google Scholar]
- 107.Lewin R. Is your brain really necessary? Science. 1980;210:1232–1234. doi: 10.1126/science.7434023. [DOI] [PubMed] [Google Scholar]
- 108.Thomas WB. Hydrocephalus in dogs and cats. Vet Clin North Am: Small Anim Pract. 2010;40:143–149. doi: 10.1016/j.cvsm.2009.09.008. [DOI] [PubMed] [Google Scholar]
- 109.O'Hayon BB, Drake JM, Ossip MG, Tuli S, Clarke M. Frontal and occipital horn ratio: A linear estimate of ventricular size for multiple imaging modalities in pediatric hydrocephalus. Pediatr Neurosurg. 1998;29:245–249. doi: 10.1159/000028730. [DOI] [PubMed] [Google Scholar]
- 110.Del Bigio MR, Crook CR, Buist R. Magnetic resonance imaging and behavioral analysis of immature rats with kaolin-induced hydrocephalus: pre- and postshunting observations. Exp Neurol. 1997;148:256–264. doi: 10.1006/exnr.1997.6644. [DOI] [PubMed] [Google Scholar]
- 111.Fletcher JM, Bohan TP, Brandt ME, Kramer LA, Brookshire BL, Thorstad K, et al. Morphometric evaluation of the hydrocephalic brain: relationships with cognitive development. Childs Nerv Syst. 1996;12:192–199. doi: 10.1007/BF00301250. [DOI] [PubMed] [Google Scholar]
- 112.Fletcher JM, McCauley SR, Brandt ME, Bohan TP, Kramer LA, Francis DJ, et al. Regional brain tissue composition in children with hydrocephalus. Relationships with cognitive development. Arch Neurol. 1996;53:549–557. doi: 10.1001/archneur.1996.00550060093022. [DOI] [PubMed] [Google Scholar]
- 113.Shprecher D, Schwalb J, Kurlan R. Normal pressure hydrocephalus: diagnosis and treatment. Curr Neurol Neurosci Rep. 2008;8:371–376. doi: 10.1007/s11910-008-0058-2. [DOI] [PMC free article] [PubMed] [Google Scholar]
- 114.Palm WM, Walchenbach R, Bruinsma B, Admiraal-Behloul F, Middelkoop HA, Launer LJ, et al. Intracranial compartment volumes in normal pressure hydrocephalus: volumetric assessment versus outcome. Am J Neuroradiol. 2006;27:76–79. [PMC free article] [PubMed] [Google Scholar]
- 115.Tarnaris A, Kitchen ND, Watkins LD. Noninvasive biomarkers in normal pressure hydrocephalus: evidence for the role of neuroimaging. J Neurosurg. 2009;110:837–851. doi: 10.3171/2007.9.17572. [DOI] [PubMed] [Google Scholar]


