Abstract
Epac2, a guanine nucleotide exchange factor, regulates a wide variety of intracellular processes in response to second messenger cAMP. In this study, we have used peptide amide hydrogen/deuterium exchange mass spectrometry to probe the solution structural and conformational dynamics of full-length Epac2 in the presence and absence of cAMP. The results support a mechanism in which cAMP-induced Epac2 activation is mediated by a major hinge motion centered on the C terminus of the second cAMP binding domain. This conformational change realigns the regulatory components of Epac2 away from the catalytic core, making the later available for effector binding. Furthermore, the interface between the first and second cAMP binding domains is highly dynamic, providing an explanation of how cAMP gains access to the ligand binding sites that, in the crystal structure, are seen to be mutually occluded by the other cAMP binding domain. Moreover, cAMP also induces conformational changes at the ionic latch/hairpin structure, which is directly involved in RAP1 binding. These results suggest that in addition to relieving the steric hindrance imposed upon the catalytic lobe by the regulatory lobe, cAMP may also be an allosteric modulator directly affecting the interaction between Epac2 and RAP1. Finally, cAMP binding also induces significant conformational changes in the dishevelled/Egl/pleckstrin (DEP) domain, a conserved structural motif that, although missing from the active Epac2 crystal structure, is important for Epac subcellular targeting and in vivo functions.
Keywords: Cyclic AMP (cAMP), Isotope Exchange, Mass Spectrometry (MS), Protein Conformation, Signal Transduction, Epac (Exchange Protein Directly Activated by cAMP), Hydrogen/Deuterium Exchange
Introduction
Exchange proteins directly activated by cAMP (Epacs)4 are a family of novel guanine nucleotide exchange factors (GEFs) specific for downstream effectors, RAP1 and RAP2 (1, 2). In mammals, there are two major isoforms of Epac, Epac1 and Epac2, encoded by two independent genes with distinct tissue distributions. At the cellular level, Epac1 and Epac2 are known to reside in various discrete subcellular compartments, where they mediate a wide range of cellular functions including cell adhesion, exocytosis, secretion, differentiation, proliferation, and apoptosis (3, 4). Accumulating evidence also suggests that the abilities of Epac to participate in diverse multiprotein complexes may dictate their subcellular destinations and in vivo functions (5–10).
At the molecular level, Epac1 and Epac2 are multidomain proteins with extensive sequence homology. Epac1 and Epac2 share a C-terminal catalytic core with an identical domain organization that consists of a RAS exchange (REM) domain, a RAS association (RA) domain, and a CDC25 homology GEF domain. The activity of both Epacs is modulated by the N-terminal regulatory lobe that contains a dishevelled/Egl/pleckstrin (DEP) domain and one or two cAMP binding (CBD) domains in Epac1 or Epac2, respectively.
Since the initial discovery of the Epac family of proteins in 1998 (1, 2), significant progress has been made toward elucidating the molecular mechanism of Epac activation using a variety of structural and molecular biophysical approaches, including the x-ray crystal structure determinations of the apo-full-length Epac2 protein in 2006 and the ternary complex of an Epac2 deletion construct in-complex with a cAMP analog and RAP1 in 2008 (11, 12). These two crystal structures have provided a clear “before and after” snapshot of the cAMP-induced activation process in atomic detail. In the apo-Epac2 protein, the access of downstream effector to the catalytic lobe is sterically blocked by the regulatory lobe. cAMP binding triggers a chain of structural reorganizations that includes a localized “hinge” motion that reorients the autoinhibitory regulatory lobe away from the catalytic core and leads to the eventual activation of Epac.
Despite these advances, our understanding of the mechanism of Epac activation remains incomplete. For example, extensive studies have revealed that Epac proteins exist, in solution, as a dynamic ensemble of multiple conformations (13, 14). X-ray crystal structures usually capture only one of the many possible low energy conformations that is compatible with the crystal lattice. Although the apo-Epac2 crystal structure is based on the full-length protein, the Epac2 protein in the active complex lacks the first CBD and DEP domains that are critical for Epac functions in vivo (15–18). In addition, the electron density for several flexible regions in Epac2 is missing in both the autoinhibitory and the active structures. It is generally believed that structurally dynamic and flexible regions in proteins often play critical roles in function. To address these gaps in our understanding, we have probed the cAMP-induced Epac2 activation using peptide amide hydrogen/deuterium exchange mass spectrometry (DXMS), an approach complementary to x-ray crystallography, capable of providing solution structural information about regions of the full-length Epac2 in both its apo and its cAMP-bound states, which may be too dynamic to be stabilized and visualized in homogeneous crystals.
EXPERIMENTAL PROCEDURES
Protein Expression and Purification
Recombinant full-length Epac2 was expressed and purified as described previously (14). All proteins were at least 95% pure, as judged by SDS-polyacrylamide gel electrophoresis.
Optimization of Protease Digestion Conditions for DXMS Analysis
To optimize peptide probe coverage, the concentration of denaturing guanidine hydrochloride (GuHCl) was systematically varied prior to acid proteolysis. 5 μl of stock solution of Epac2 (12.5 mg/ml in 10 mm Tris-HCl, pH 7.5, 5 mm DTT, 1 mm EDTA, 150 mm NaCl) was diluted with 15 μl of water and then quenched with 30 μl of 0.8% (v/v) formic acid containing various concentrations of GuHCl (0.8, 1.6, 3.2, 6.4 m) at 0 °C and frozen at −80 °C as described previously (19). The frozen quenched samples were automatically thawed (20) and then immediately passed over tandem protease columns (porcine pepsin, 66-μl bed volume, followed by Aspergillus saitoi fungal protease type XIII, 66-μl bed volume) (21), with 0.05% trifluoroacetic acid (TFA) in water (Solvent A) at a flow rate of 100 μl/min for 4 min. The proteolytic products were directly collected by a reverse phase C18 guard column (Vydac catalog number 218GD51MS) and then desalted by flushing for 1 min with 0.05% TFA at a flow rate of 100 μl/min. The chromatographic separation was achieved on a Vydac C18 column (C18, 50 × 1.0 mm inner diameter, 5 μm) with a linear gradient of 8–48% Solvent B (80% acetonitrile and 0.01% TFA) over 30 min at 50 μl/min. The eluant was directed to a Finnigan LCQ Classic mass spectrometer with electrospray mass ionization voltage set at 5 kV, capillary temperature at 200 °C, and data acquisition in either MS1 profile mode or data-dependent MS/MS mode. The SEQUEST software program was used to identify the sequence of the protease-generated peptide ions. Tentative identifications were confirmed using specialized data reduction software (DXMS Explorer, Sierra Analytics Inc., Modesto, CA) (19). Optimal peptide coverage maps were obtained employing a final concentration of 2.0 m GuHCl in 0.5% formic acid.
DXMS Analysis
Deuterated samples were prepared at 0 °C by diluting 5 μl of Epac2 stock solution with 15 μl of deuterated buffer (8.3 mm Tris, pD 7.2, 1 mm DTT, 150 mm NaCl) followed by on-exchange incubation for varying times (10, 30, 100, 1,000, 10,000, and 100,000 s) prior to exchange quenching by the addition of 30 μl of quench buffer (0.8% formic acid, 3.2 m GuHCl) at 0 °C and then stored frozen at −80 °C. Deuterated samples were then automatically thawed at 0 °C and subjected to proteolysis and LC/MS analysis as described above, along with control samples of non-deuterated and equilibrium-deuterated Epac2 (prepared by incubation of protein in 0.5% formic acid in 100% D2O for 12 h at room temperature). The centroids of isotopic envelopes of non-deuterated, partially deuterated and equilibrium-deuterated peptides were measured using DXMS Explorer and then converted to deuteration levels with corrections for back-exchange by the equation: D = MaxD × (m(P) − m(N))/(m(E) − m(N)), where m(P), m(N), and m(E) are the centroid value of partially deuterated, non-deuterated, and equilibrium deuterated peptides, respectively (22). MaxD is the calculated maximum deuterium incorporation to the given peptide (23). The deuteron incorporation within the sequence of Epac2 was further sublocalized using differences between overlapping peptides as described previously (24). The H/D exchange experiments performed with our automated apparatus typically produce measurements of deuteron incorporation where the standard deviation is less than 2% of the mean of triplicate determinations (25, 26). In the present work, as in our previous studies, only changes in deuteration level greater than 10% are considered as significant (23, 27).
RESULTS
Protease Fragmentation of Epac2 and Peptide Identification
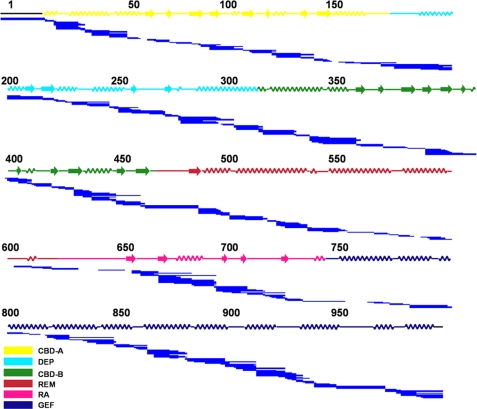
To maximize the resolution and sequence coverage for Epac2 DXMS analysis, tandem protease digestion using pepsin and A. saitoi fungal protease type XIII was employed (21). Protease digestion and HPLC separation conditions that produced Epac2 fragments of optimal size and distribution for exchange analysis were established prior to H/D exchange experiments. Optimal pepsin digestion for Epac2 was obtained by quenching deuterated samples to a final concentration of 2.0 m GuHCl in 0.5% formic acid). These conditions generated 278 unique peptides covering 96% of the Epac2 sequence (Fig. 1).
FIGURE 1.
Pepsin digestion maps of Epac2. The peptide fragmentation pattern (indicated by the solid lines) of cAMP-free Epac2 is shown. The secondary structures of Epac2 are shown above the peptide fragments and colored by domain: yellow, CBD-A; cyan, DEP; green, CBD-B; brown, REM; pink, RA; blue, GEF domain. The same domain color scheme is used for Figs. 3–5 unless indicated otherwise, as indicated by color-coded legends in the bottom right corners of the figures.
DXMS Analysis of Epac2 in the cAMP-free State
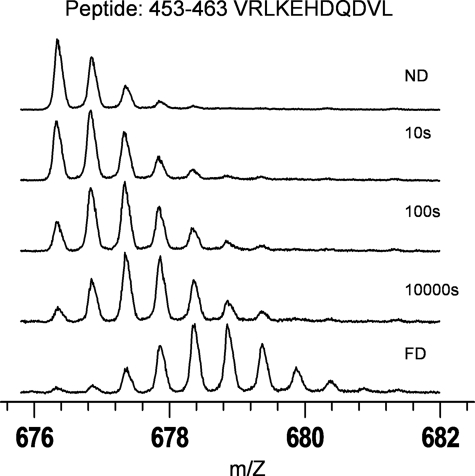
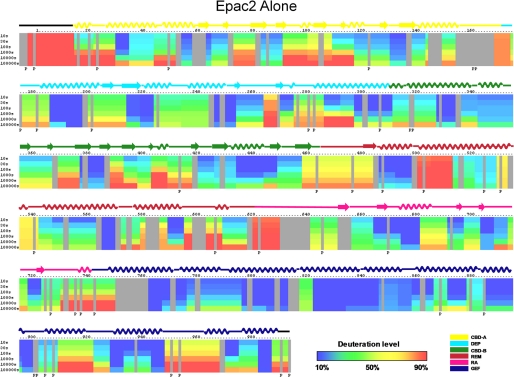
Exchange of full-length apo-Epac2 was performed at 0 °C for various time intervals ranging from 10 to 100,000 s. The MS isotopic envelopes of one specific peptide fragment, Val447–Leu457, prior and subsequent to functional deuteration are shown in Fig. 2. Incorporation of deuterium was clearly evident from the increase in overall mass and complexity of the peptide mass peaks as a function of deuteration time. The deuteration levels of cAMP-free Epac2 peptide fragments were determined as a function of time to generate the DXMS profile of apo-Epac2. When there were two or more overlapping peptide fragments in the same region, it was possible to sublocalize the deuterium by subtraction to provide a DXMS profile with improved resolution as illustrated in Fig. 3. Six regions of Epac2, 1–14, 168–173, 458–483, 498–512, 529–541, and 618–629, were found to be more than 70% deuterated at the earliest time point examined, indicative of a highly dynamic region whose amides are readily exposed to solvent water. On the other hand, regions 186–197, 563–570, 762–775, 796–812, 822–857, 896–899, 928–932, 943–947, and 982–986 showed very low deuteration levels, less than 20% even at the longest time point. These peptides with very slow exchange rates are in the core of DEP, REM, and CDC25 homology domains and represent very stable regions of the protein.
FIGURE 2.
Mass spectra of an Epac2 peptide fragment as a function of deuteration time. Shown is an isotopic envelope for peptide fragment Val447–Leu457 before deuteration (ND), at various time points of deuteration, and after full deuteration (FD), displaying increased backbone amide deuteron incorporation as indicated by the shifting of the isotopic envelope to a higher m/z ratio.
FIGURE 3.
Amide H/D exchange profiles of apo-Epac2. The percentages of deuteration levels of each peptide fragment at various time points are shown as a heat map color-coded from blue (<10%) to red (>90%), as indicated at the bottom right of the figure. Each block represents a peptide segment analyzed at each of the six time points (from top to bottom: 10, 30, 100, 1,000, 10,000, and 100,000 s). Proline residues, and regions with no amide exchange data available are colored in gray. Three independent DXMS analyses were performed. Standard deviations of deuterium incorporation were 2.5% or less between replicates.
Effect of cAMP Binding on Epac2 Hydrogen Exchange
To elucidate the conformational changes associated with Epac2 activation, the time-dependent amide H/D exchange patterns of Epac2 in the presence and absence of 2 mm cAMP were measured and compared. For many of the peptide fragments, the binding of cAMP had no effect on the time-dependent incorporation of deuterium. On the other hand, the rates and/or the extent of the exchange of several peptides changed, either increasing or decreasing, respectively, in response to cAMP binding over the experimental time course, indicating that local environments of these peptide fragments are perturbed by the binding of cAMP.
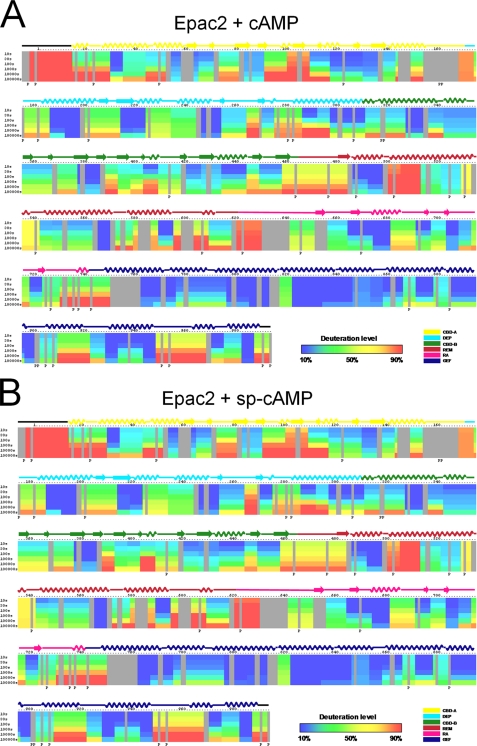
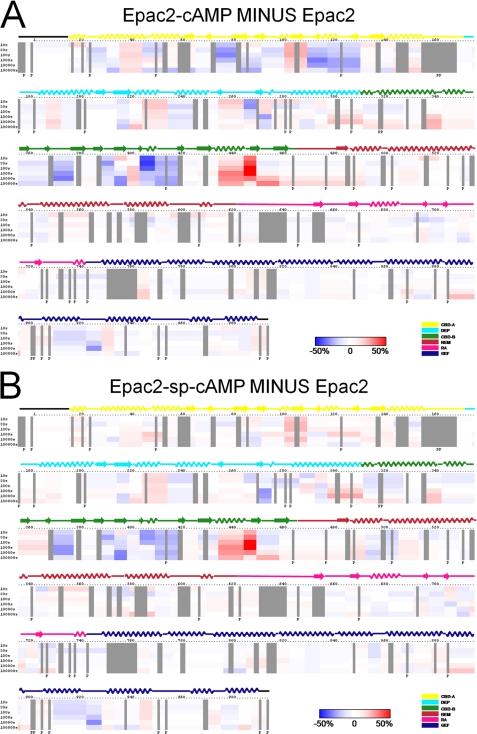
The exchange difference plot between active and inactive Epac2 was generated by subtracting the DXMS profile of apo-Epac2 from that of Epac2·cAMP (Fig. 4A) and presented in Fig. 5A, which allows ready visualization of the regions in Epac2 that underwent changes in exchange in response to the binding of cAMP. Among the peptides with different rates of deuterium exchange in the presence and absence of cAMP, a group of them showed a decreased exchange rate in the presence of cAMP, as evidenced by peptides 71–80, 109–116, 117–129, 367–376, and 403–417. These regions mostly overlap with the cAMP binding pockets A and B in Epac2. The apparent decrease in exchange at the cAMP binding pockets upon cAMP binding is consistent with the notion that ligand binding in general decreases local protein dynamics and/or provides steric protection of residues directly involved in binding. Although our DXMS analysis could not distinguish between these possibilities, the coincidence between the observed major region of solvent protection and the cAMP binding pocket provides an independent validation for our DXMS analysis. Changes in deuterium exchange rate in response to cAMP binding were also observed for several peptide fragments located outside the cAMP binding sites. The majority of these peptide fragments, as represented by peptides 35–43, 224–233, 301–310, 434–448, and 928–932, displayed increased exchange upon cAMP binding, whereas a few peptide fragments, such as 910–925 and 920–927, showed a decreased exchange rate. These observed changes in solvent accessibility are at regions outside the cAMP binding pocket.
FIGURE 4.
Summary of hydrogen/deuterium exchange rates of Epac2 in the presence of ligand. A and B, deuteration levels of representative peptide fragments of Epac2·cAMP complex (A) and Epac2·(Sp)-cAMP complex (B) at various time points (from top to bottom: 10, 30, 100, 1,000, 10,000, and 100,000 s) are shown as a pseudo color scale. The percentages of deuteration levels of each peptide fragment at various time points are shown as a heat map color-coded from blue (<10%) to red (>90%), as indicated at the bottom right of the figure.
FIGURE 5.
Changes in hydrogen/deuterium exchange rates of Epac2 induced by binding of cAMP or (Sp)-cAMP. A and B, differences in deuteration levels in the free and cAMP-bound Epac2 (A) or in the free and (Sp)-cAMP-bound Epac2 (B) at various time points (from top to bottom: 10, 30, 100, 1,000, 10,000, and 100,000 s) are shown in a color-coded bar ranging from blue (−50%) to red (50%), as indicated at the bottom right of the figure.
Comparative DXMS Analyses of Epac2 in the Presence of cAMP and (Sp)-cAMP
To help interpret the observed potential cAMP-induced conformational changes revealed by DXMS analysis, we also determined the amide H/D exchange profile of Epac2 in the presence of 500 μm (Sp)-cAMP (Fig. 4B) as the crystal structure of active Epac2 was recently solved as the Epac2Δ305·(Sp)-cAMP·RAP1 ternary complex. The exchange difference plot between Epac2·(Sp)-cAMP and apo-Epac2 was essentially identical to that between Epac2·cAMP and apo-Epac2 except within a region of the first N-terminal 130 amino acids, which corresponds to the cAMP binding domain A (CBD-A) of Epac2 (Fig. 5B). The apparent lack of protection of the CBD-A domain by (Sp)-cAMP suggests either that (Sp)-cAMP is not capable of binding to CBD-A in Epac2 or that the binding affinity is too weak under the experimental conditions employed in this study. This differential binding of cAMP and (Sp)-cAMP provided a window of opportunity to further dissect the characteristics of the two cAMP binding sites in Epac2. The crystal structure of the full-length apo-Epac2 shows that cAMP binding to CBD-A and CBD-B is mutually exclusive (11), suggesting that the events of cAMP binding are interdependent and sequential, i.e. the binding of the first cAMP leads to a conformational change that allows the binding of a second cAMP. This observation is further supported by our earlier isothermal titration calorimetry analysis in which the binding isotherm for cAMP derived from the integrated heat data can be fit best by a model of two sequential binding sites, but not by a model with two independent sites (28). However, the exact order of cAMP binding (A site first or B site first) has not been established. Our current DXMS analyses reveal a condition in which only the CBD-B site is protected by cAMP. This observation suggests that cAMP binding to CBD-B does not require the occupancy of the CBD-A, which rules out the A site first binding sequence. Taken together, our data suggest that cAMP binding to Epac2 follows a sequential model with binding at the B site proceeding that of the A site. In addition, our results further confirm that cAMP binding to CBD-A is not required for biochemical activation of Epac2 in vitro because (Sp)-cAMP, at 500 μm, is capable of fully activating Epac2.
DISCUSSION
DXMS has proven to be a powerful approach for studying protein dynamics and conformational changes, providing information complementary to high-resolution structural techniques. Although x-ray crystallography is capable of providing exquisite structural detail at the atomic level, attempts to understand protein dynamics and conformational changes relying solely on crystallography data are limited by constraints placed upon protein conformation by the crystal lattice and/or the fact that highly flexible/dynamic regions of protein are often refractory to crystallization. In this study, we have used DXMS to probe the protein dynamics and conformational changes associated with Epac2 activation upon binding of cAMP.
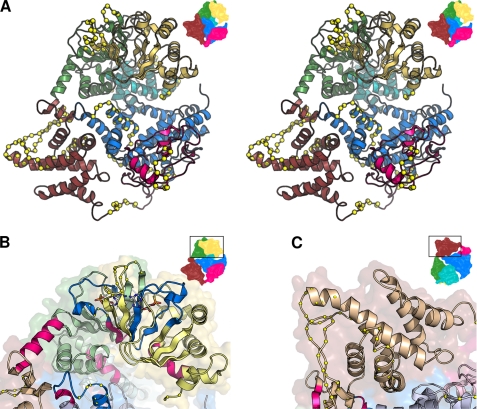
Monitoring amide hydrogen exchange rates provides a direct measurement of relative backbone solvent accessibilities, which in turn allow assessment of local conformational flexibility or dynamics. Several Epac2 peptides exhibited fast H/D exchange rates as defined as more than 75% deuteration after 100 s of exposure in D2O at 0 °C (Fig. 3), indicative of disordered or highly dynamic regions with solvent-exposed amides. When we mapped these peptide segments onto the x-ray crystal structure of apo-Epac2, most of these fragments were located in the loop and turn regions (Fig. 6A). This is consistent with the fact that loops and turns are usually exposed to solvent and are more flexible. Moreover, three of the fastest exchanging fragments, peptides 1–14, 458–483, and 618–629, as revealed by DXMS, match to three out of the four regions in the Epac2 structure that lack significant electron density, a sign of high flexibility associated with structural disorder.
FIGURE 6.
Highly dynamic and flexible regions in Epac2 revealed by DXMS. A, stereo view of the apo-Epac2 model. The yellow Cα spheres denote dynamic regions that exchange rapidly. The domains are colored as follows: yellow, CBD-A; cyan, DEP; green, CBD-B; brown, REM; pink, RA; blue, GEF domain. This figure is based on the apo structure (Protein Data Bank (PDB) ID 2BYV) with missing disordered loops modeled using Swiss-Model. Insets show the orientation of the view relative to the complete structure. Regions colored bright blue or red show decreased or increased H/D exchange, respectively, upon cAMP binding. The modeled cAMP molecules are shown as Corey-Pauling-Koltun-colored sticks. C, close-up of the dynamic loops in the apo-REM domain.
Most of the fast-exchanging peptides of Epac2 are clustered in discrete regions of the Epac2 surface. These dynamic regions of Epac2 are most likely to have important functional implications. For example, in the autoinhibitory apo-Epac2 structure, the first and second CBDs are arranged in a face-to-face configuration so that each blocks the entry of the ligand into the binding site of the other (11). It is not clear how cAMP gains access to the cAMP binding pocket, particularly in the second CBD, where it must bind to induce activation of Epac2. Our DXMS analyses show that the interface between CBD-A and CBD-B is highly dynamic (Fig. 6B). Therefore, it is conceivable that a highly dynamic/flexible domain interface may lead to a transient opening of the two CBDs or a local structural unfolding, which allows cAMP to access both of the cAMP binding pockets. Another highly dynamic region in Epac2 is located at the hinge/switchboard and the REM domain (Fig. 6C). This region undergoes major conformational changes in response to cAMP-induced Epac2 activation that include a bending of the hinge toward the β-core of CBD-B, a capping of the cAMP binding pocket with the lid formed by the C-terminal β-strands of CBD-B and the first helix of the REM domain, and the formation of a new interface between the CBD-B and REM domains (12). The observed high flexibility at this region is probably required to accommodate these dramatic conformational changes.
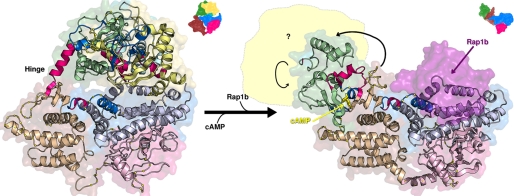
When we mapped the changes in the rates of amide hydrogen exchange in response to cAMP binding along the primary sequence (Fig. 5A) or three-dimensional structures of Epac2 (Fig. 7), respectively, two patterns emerged. First, almost all the changes in solvent accessibility induced by cAMP are located in the N-terminal half of the protein that spans the regulatory lobe of Epac2, including both the CBDs, the DEP domain, and the hinge switchboard. The catalytic lobe, except for a small region near the C terminus, remains relatively unaffected by cAMP binding. Second, the majority of cAMP-induced changes in the amide hydrogen exchange rates are located within or immediately adjacent to the highly dynamic regions of Epac2. This close proximity between regions of high flexibility and areas of conformational change suggests that protein dynamics may play an important role in cAMP-induced Epac2 activation.
FIGURE 7.
cAMP-induced conformational changes in Epac2 revealed by DXMS. Left and right panels, graphic representation of x-ray crystal structures of the full-length apo-Epac2 (PDB ID: 2BYV; left panel) and Epac2Δ305·(Sp)-cAMP·RAP1B complex (PDB ID: 3CF6; right panel). Regions with significantly enhanced or reduced amide H/D exchanges as a result of cAMP binding are highlighted in bright red or blue, respectively. The domains are colored as follows: yellow, CBD-A; cyan, DEP; green, CBD-B; brown, REM; pink, RA; blue, GEF domain. The deleted N-terminal domains in the active structure (right) are indicated by the pale yellow area. The RAP1B molecule is shown as a semitransparent purple surface. Small arrows show the domain motions in passing from the apo to complex form.
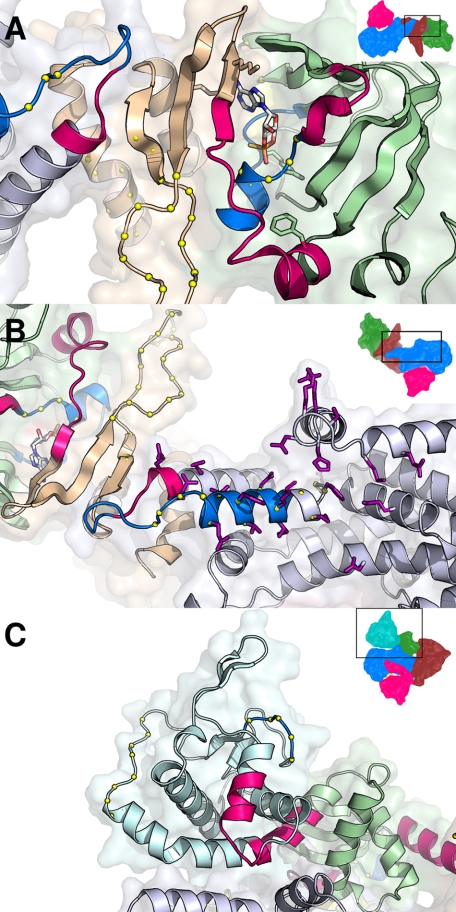
The largest observed changes in the rates of exchange induced by binding of cAMP are centered precisely at residues 444–448, the hinge of Epac2 (Fig. 5A). This is not surprising as extensive structural and biochemical studies have demonstrated that the hinge/switchboard region is the most crucial structural component required for Epac activation (11–15, 19). Structural comparison between the crystal structures of apo-Epac2 and the Epac2Δ305·(Sp)-cAMP·RAP1B complex reveals that the hinge helix swings closer to the core of the CBD-B domain. During this process, the last two turns of the hinge helix dissolve into an extended loop between the hinge helix and the C-terminal β-strands that allows the C-terminal β-strands and the whole catalytic region to rotate about 90° sideways (11, 12). The apparent increased amide hydrogen exchange rate at the hinge region in response to the binding of cAMP is consistent with the structural observation of a partial melting of the hinge helix (Fig. 8A). In addition to the conformational changes at the hinge that lead to the exposure of the RAP1 binding surface, the binding of cAMP also produces significant alterations in solvent accessibility at regions in Epac2 that interact directly with RAP1. As shown in Fig. 8B, one helix of the helical hairpin, to which the switch II of RAP1 region is packed, is highly dynamic in the inactive, apo-Epac2 state. This helix and part of the ionic latch loop show decreased amide exchange upon cAMP binding. This cAMP-induced decrease in protein dynamics at the RAP1 binding surface may produce a favorable entropic contribution to RAP1 binding, providing a fine-tuning mechanism for regulating the Epac2-RAP1 interaction. The observation of cAMP-induced conformational changes right at the RAP1B binding interface suggests that cAMP, in addition to relieving the steric hindrance imposed upon the catalytic lobe by the regulatory lobe, may also directly regulate the interaction between Epac2 and RAP1 as an allosteric modulator.
FIGURE 8.
Details of the cAMP-induced conformational changes in Epac2 revealed by DXMS. A, structure of the hinge/switchboard in the (Sp)-cAMP-bound Epac2. The regions highlighted in bright red or blue become respectively more or less exposed upon cAMP binding. The domains are colored as follows: yellow, CBD-A; cyan, DEP; green, CBD-B; brown, REM; pink, RA; blue, GEF. B, the RAP1B binding site. Residues involved in RAP1B binding to the active Epac2 molecule are shown as purple sticks. The RAP1B molecule was removed for clarity. C, the DEP domain of apo-Epac2 with regions of increased solvent accessibility due to cAMP binding colored in red.
Changes in amide hydrogen exchange in response to cAMP binding have also been observed within the DEP domain (Fig. 8C) including a part of the long helix at the interface between the DEP and CBD-B domains and a nearby short helix loop. Both of these regions became more solvent-exposed in the presence of cAMP. On the other hand, one exposed loop in the DEP domain became less solvent-accessible upon cAMP binding. These observations suggest that the DEP domain most likely undergoes a significant conformational change during Epac activation, which may include a domain rearrangement between the DEP and CBD-B domains. The DEP domain, initially identified in disheveled, EGL-10, and pleckstrin protein (29), is a highly homologous structural motif found in a number of proteins involved in signal transduction, such as regulators of G-protein signaling (RGS) and Epac. Consistent with the notion that DEP domains function as a membrane anchor via interactions with phospholipids and/or membrane proteins (30, 31), the DEP domain is known to be necessary for the membrane targeting of Epac1 (32). Recently published data show that in addition to the temporal control of Epac1 GEF activity, cAMP also induces the translocation of Epac1 toward the plasma membrane. Importantly, the DEP domain is a necessary determinant of plasma membrane translocation that is required for the proper cellular function of Epac1 (17). Although it has been shown that the first CBD of Epac2 is required for protein localization to the plasma membrane (16), whether the DEP domain and the observed conformational changes in the DEP domain induced by cAMP play a role in Epac2 cellular targeting and translocation, respectively, requires further investigation.
This work was supported, in whole or in part, by National Institutes of Health Grants GM066170 (to X. C. and V. L. W.) and GM020501, NS070899 GM093325 and RR029388 (V. L. W.) and NIEHS Center Grant ES06676 (to X. C.).
This article was selected as a Paper of the Week.
- Epac
- exchange protein directly activated by cAMP
- CBD
- cAMP binding domain
- DXMS
- deuterium exchange mass spectrometry
- DEP
- dishevelled, Egl-10, pleckstrin domain
- GEF
- guanine nucleotide exchange factor
- H/D
- hydrogen/deuterium
- RA
- RAS association
- RAP
- RAS-proximate
- REM
- RAS exchange motif
- (Sp)-cAMP
- adenosine-3′, 5′-cyclic monophosphorothioate, (Sp) isomer
- GuHCl
- guanidine hydrochloride.
REFERENCES
- 1. de Rooij J., Zwartkruis F. J., Verheijen M. H., Cool R. H., Nijman S. M., Wittinghofer A., Bos J. L. (1998) Nature 396, 474–477 [DOI] [PubMed] [Google Scholar]
- 2. Kawasaki H., Springett G. M., Mochizuki N., Toki S., Nakaya M., Matsuda M., Housman D. E., Graybiel A. M. (1998) Science 282, 2275–2279 [DOI] [PubMed] [Google Scholar]
- 3. Gloerich M., Bos J. L. (2010) Annu. Rev. Pharmacol. Toxicol. 50, 355–375 [DOI] [PubMed] [Google Scholar]
- 4. Cheng X., Ji Z., Tsalkova T., Mei F. (2008) Acta Biochim. Biophys. Sin. 40, 651–662 [DOI] [PMC free article] [PubMed] [Google Scholar]
- 5. Dodge-Kafka K. L., Soughayer J., Pare G. C., Carlisle Michel J. J., Langeberg L. K., Kapiloff M. S., Scott J. D. (2005) Nature 437, 574–578 [DOI] [PMC free article] [PubMed] [Google Scholar]
- 6. Mei F. C., Cheng X. D. (2005) Mol. Biosyst. 1, 325–331 [DOI] [PubMed] [Google Scholar]
- 7. Nijholt I. M., Dolga A. M., Ostroveanu A., Luiten P. G., Schmidt M., Eisel U. L. (2008) Cell. Signal. 20, 1715–1724 [DOI] [PubMed] [Google Scholar]
- 8. Ozaki N., Shibasaki T., Kashima Y., Miki T., Takahashi K., Ueno H., Sunaga Y., Yano H., Matsuura Y., Iwanaga T., Takai Y., Seino S. (2000) Nat. Cell Biol. 2, 805–811 [DOI] [PubMed] [Google Scholar]
- 9. Shibasaki T., Sunaga Y., Fujimoto K., Kashima Y., Seino S. (2004) J. Biol. Chem. 279, 7956–7961 [DOI] [PubMed] [Google Scholar]
- 10. Liu C., Takahashi M., Li Y., Dillon T. J., Kaech S., Stork P. J. (2010) Mol. Cell Biol. 30, 3956–3969 [DOI] [PMC free article] [PubMed] [Google Scholar]
- 11. Rehmann H., Das J., Knipscheer P., Wittinghofer A., Bos J. L. (2006) Nature 439, 625–628 [DOI] [PubMed] [Google Scholar]
- 12. Rehmann H., Arias-Palomo E., Hadders M. A., Schwede F., Llorca O., Bos J. L. (2008) Nature 455, 124–127 [DOI] [PubMed] [Google Scholar]
- 13. Rehmann H., Rueppel A., Bos J. L., Wittinghofer A. (2003) J. Biol. Chem. 278, 23508–23514 [DOI] [PubMed] [Google Scholar]
- 14. Tsalkova T., Blumenthal D. K., Mei F. C., White M. A., Cheng X. (2009) J. Biol. Chem. 284, 23644–23651 [DOI] [PMC free article] [PubMed] [Google Scholar]
- 15. de Rooij J., Rehmann H., van Triest M., Cool R. H., Wittinghofer A., Bos J. L. (2000) J. Biol. Chem. 275, 20829–20836 [DOI] [PubMed] [Google Scholar]
- 16. Niimura M., Miki T., Shibasaki T., Fujimoto W., Iwanaga T., Seino S. (2009) J. Cell Physiol. 219, 652–658 [DOI] [PubMed] [Google Scholar]
- 17. Ponsioen B., Gloerich M., Ritsma L., Rehmann H., Bos J. L., Jalink K. (2009) Mol. Cell Biol. 29, 2521–2531 [DOI] [PMC free article] [PubMed] [Google Scholar]
- 18. Mei F. C., Qiao J., Tsygankova O. M., Meinkoth J. L., Quilliam L. A., Cheng X. (2002) J. Biol. Chem. 277, 11497–11504 [DOI] [PubMed] [Google Scholar]
- 19. Brock M., Fan F., Mei F. C., Li S., Gessner C., Woods V. L., Jr., Cheng X. (2007) J. Biol. Chem. 282, 32256–32263 [DOI] [PubMed] [Google Scholar]
- 20. Wong L., Lieser S., Chie-Leon B., Miyashita O., Aubol B., Shaffer J., Onuchic J. N., Jennings P. A., Woods V. L., Jr., Adams J. A. (2004) J. Mol. Biol. 341, 93–106 [DOI] [PubMed] [Google Scholar]
- 21. Englander J. J., Del Mar C., Li W., Englander S. W., Kim J. S., Stranz D. D., Hamuro Y., Woods V. L., Jr. (2003) Proc. Natl. Acad. Sci. U.S.A. 100, 7057–7062 [DOI] [PMC free article] [PubMed] [Google Scholar]
- 22. Zhang Z., Smith D. L. (1993) Protein Sci. 2, 522–531 [DOI] [PMC free article] [PubMed] [Google Scholar]
- 23. Hamuro Y., Anand G. S., Kim J. S., Juliano C., Stranz D. D., Taylor S. S., Woods V. L., Jr. (2004) J. Mol. Biol. 340, 1185–1196 [DOI] [PubMed] [Google Scholar]
- 24. Burns-Hamuro L. L., Hamuro Y., Kim J. S., Sigala P., Fayos R., Stranz D. D., Jennings P. A., Taylor S. S., Woods V. L., Jr. (2005) Protein Sci. 14, 2982–2992 [DOI] [PMC free article] [PubMed] [Google Scholar]
- 25. Hsu S., Kim Y., Li S., Durrant E. S., Pace R. M., Woods V. L., Jr., Gentry M. S. (2009) Biochemistry 48, 9891–9902 [DOI] [PMC free article] [PubMed] [Google Scholar]
- 26. Hsu Y. H., Burke J. E., Stephens D. L., Deems R. A., Li S., Asmus K. M., Woods V. L., Jr., Dennis E. A. (2008) J. Biol. Chem. 283, 9820–9827 [DOI] [PMC free article] [PubMed] [Google Scholar]
- 27. Burke J. E., Babakhani A., Gorfe A. A., Kokotos G., Li S., Woods V. L., Jr., McCammon J. A., Dennis E. A. (2009) J. Am. Chem. Soc. 131, 8083–8091 [DOI] [PMC free article] [PubMed] [Google Scholar]
- 28. Tsalkova T., Gribenko A. V., Cheng X. (2011) Assay Drug Dev. Technol. 9, 88–91 [DOI] [PMC free article] [PubMed] [Google Scholar]
- 29. Ponting C. P., Bork P. (1996) Trends Biochem. Sci. 21, 245–246 [PubMed] [Google Scholar]
- 30. Wong H. C., Mao J., Nguyen J. T., Srinivas S., Zhang W., Liu B., Li L., Wu D., Zheng J. (2000) Nat. Struct. Biol. 7, 1178–1184 [DOI] [PMC free article] [PubMed] [Google Scholar]
- 31. Simons M., Gault W. J., Gotthardt D., Rohatgi R., Klein T. J., Shao Y., Lee H. J., Wu A. L., Fang Y., Satlin L. M., Dow J. T., Chen J., Zheng J., Boutros M., Mlodzik M. (2009) Nat. Cell Biol. 11, 286–294 [DOI] [PMC free article] [PubMed] [Google Scholar]
- 32. Qiao J., Mei F. C., Popov V. L., Vergara L. A., Cheng X. (2002) J. Biol. Chem. 277, 26581–26586 [DOI] [PubMed] [Google Scholar]


