Abstract
Anterior Gradient Homolog 2 (AGR2) is expressed by the normal intestine and by most human adenocarcinomas, including those derived from the esophagus, pancreas, lung, breast, ovary, and prostate. Xenografts of human adenocarcinoma cell lines in nude mice previously demonstrated that AGR2 supports tumor growth. In addition, AGR2 is able to induce in vitro a transformed phenotype in fibroblast and epithelial cell lines. The mechanism underlying the growth promoting effects of AGR2 is unknown. The present study shows that AGR2 induces expression of amphiregulin (AREG), a growth promoting EGFR ligand. Induced AREG expression in adenocarcinoma cells is able to rescue the transformed phenotype that is lost when AGR2 expression is reduced. Additional experiments demonstrate that AGR2 induction of AREG is mediated by activation of the Hippo signaling pathway co-activator, YAP1. Thus AGR2 promotes growth by regulating the Hippo and EGF receptor signaling pathways.
Keywords: Carcinogenesis, Cellular Regulation, Gene Expression, Growth Factors, Signal Transduction, Transformation
Introduction
Anterior Gradient Homolog 2 (AGR2)2 encodes a 17 kDa protein that is highly conserved in vertebrates. AGR2 was first described in Xenopus laevis, where its expression is responsible for the development of a glandular organ called the cement gland (1). A significant role in tissue regeneration was established for AGR2 in salamanders where it functions in nerve-dependent limb regeneration (2). AGR2 is also expressed by secretory cells in the normal murine intestine (3). In humans, enhanced AGR2 expression was first described in breast cancer, which was followed by similar observations in most human adenocarcinomas, including those derived from the esophagus, pancreas, lung, ovary, and prostate (4–11). Both in vitro and in vivo studies demonstrated that AGR2 promotes tumor growth and metastasis (3, 6, 12). In adenocarcinoma cell lines and nontransformed fibroblasts, AGR2 induces cell proliferation and anchorage-independent growth in soft agar. Human adenocarcinoma cell lines grown in vivo as mouse xenografts result in smaller tumors when AGR2 expression is reduced (3, 6). In vitro studies examining cell migration suggested that AGR2 may function in a non-cell autonomous fashion (3).
The mechanisms responsible for AGR2 effects on growth and transformation are unknown. AGR2 expression in humans is restricted to epithelial cells, for which the EGF signaling pathway serves a regulatory role in controlling cell growth. The present study tested the hypothesis that AGR2 affects cell signaling, and potentially that of the EGFR pathway, which has established significance in epithelial cancers.
EXPERIMENTAL PROCEDURES
Cell Lines
H460 lung adenocarcinoma cells obtained from Dr. David Beer (University of Michigan, Ann Arbor, MI) were previously known as SEG-1 and was the focus of a previous publication (3). A recent report revealed that SEG-1 cells are actually H460 lung adenocarcinoma cells (13). The H460 cells used in this study were reassessed by Winand Dinjens, Erasmus Medical Center, Rotterdam, the Netherlands using the Powerplex 16TM system (Promega Corp., Madison, WI) to characterize 16 short tandem repeat markers. The resultant data matched for all 16 markers of H460 cells (supplemental data S1). H460 cells (14) were grown in DMEM containing 4.5 g/liter glucose and l-glutamine, and supplemented with 10% fetal bovine serum, 50 units/ml penicillin, and 50 μg/ml streptomycin. The esophageal adenocarcinoma cell lines JH-EsoAd1 and OE33 were also used. JH-EsoAd1 cells (15) were graciously provided by James R. Eshleman (Johns Hopkins University) and cultured in RPMI1640 with 20% FBS. OE33 cells (13, 16) were obtained from Sigma-Aldrich and cultured in RPMI 1640 with 10% FBS.
Cells infected with retroviral vectors containing shRNAmir constructs were grown in media containing 2 μg/ml puromycin. Cells transfected with full-length cDNA constructs of human AREG or AGR2 used the pcDNA3.1 expression vector (Invitrogen) and were selected in media containing 0.8 mg/ml G418.
Antibodies
Primary antibodies used included: β-actin (A2066, Sigma-Aldrich Inc.), AKT (9272, Cell Signaling Technology, Danvers, MA), pAKT (4058, Cell Signaling), Erk1/2 (9102, Cell Signaling), pErk1/2 (9106, Cell Signaling), pYAP (4911, Cell Signaling), pEGFR (2236, Cell Signaling), YAP (sc-15407, Santa Cruz Biotechnology, Santa Cruz, CA), EGFR (E12020, Transduction Laboratories, Lexington, KY), and a neutralization antibody for AREG (AF262, R&D Systems, Minneapolis, MN). Anti-human AREG antibody used for immunocytochemistry was obtained from ThermoScientific and was generated against amino acids 8–26 of secreted AREG (RB-257P, Thermo Scientific). The characterization of the anti-AREG antibody in immunocytochemistry can be found in the following references (17–19). Rabbit anti-human AGR2 specific polyclonal antisera was generated against a peptide containing the sequence NH2-RDTTVKPGAKKDTKDSRPK-COOH representing amino acids 21–39 of human AGR2 (NP_006399), and showed no cross-reactivity for AGR3.
RNA Interference
RNA interference was achieved using microRNA-adapted shRNAmir (20). Specific shRNAmir sequences for AGR2 (OpenBiosystems, Irvine, CA) were subcloned into the MSCV-LTRmiR30-PIG (LMP) retroviral vector as previously described (3). RNA interference for YAP1 was achieved using shRNAmir sequences incorporated into pGIPZ Lentiviral vectors (OpenBiosystems, Clone ID V3LHS_306099), which were packaged using the TransLenti Viral GIPZ packaging system. 72 h after infection with lentivirus shRNAmir specific for YAP1, the cells were harvested and processed by FACS sorting for GFP fluorescence (FACSVantage cell sorter, BD Biosciences, San Jose, CA). FACS sorting was employed because only 30% of cells expressed high GFP, which served as a surrogate marker for shRNAmir expression.
As a control, an RNA interference resistant construct was produced using cDNA representing the AGR2 coding sequence and truncated right after the stop codon, but before the sequence complementary to the sequence bound by the interference construct. The cDNA was amplified by PCR using the primers: 5′-TCCGCTAGCCCACCATGGAGAAAATTCCAGT-3′; 5′-TAAGAATTCTTACAATTCAGTCTTCAGC-3′. The resultant PCR product was cloned into the NheI/EcoRI sites of pcDNA3.1 (Invitrogen).
Quantitative PCR
RNA levels were quantified using real-time PCR. qPCR primer pairs included: AREG-F, 5′-GTGGTGCTGTCGCTCTTGATA-3′; AREG-R, 5′-ACTCACAGGGGAAATCTCACT-3′; AGR2-F, 5′-ATGAGTGCCCACACAGTCAA-3′; AGR2-R, 5′-GGACATACTGGCCATCAGGA-3′; EGFR-F, 5′-TGCGTCTCTTGCCGGAAT-3′; EGFR-R, 5′-GGCTCACCCTCCAGAAGGTT-3′; β-actin-F, 5′-GAGCGCGGCTACAGCTT-3′; β-actin-R, TCCTTAATGTCACGCACGATTT-3′; EGF-F, 5′-AAGGTACTCTCGCAGGAAATGG-3′; EGF-R, 5′-ACATACTCTCTCTTGCCTTGACC-3′; TGFα-F, 5′-GGCCCTGGCTGTCCTTATC-3′; TGFα-R, 5′-AGCAAGCGGTTCTTCCCTTC-3′; HBEGF-F, CCCTCCCACTGTATCCACG-3′; HBEGF-R, 5′-AGTGACTCTCAAAAGGTCCAGA-3′; YAP-F, 5′-CCTTCTTCAAGCCGCCGGAG-3′; YAP-R, 5′-CAGTGTCCCAGGAGAAACAGC-3′; CTGF-F, 5′-GCAGAGCCGCCTGTGCATGG-3′; CTGF-R, 5′-GGTATGTCTTCATGCTGG-3′; COL8A1-F, 5′-CAGAAACCAGCCCCAGAGGTGTCAC-3′; COL8A1-R, 5′-GAAATGGTAAGCAGCACTCCCAGCAG-3′. Total RNA was isolated from cells using TRIzol® reagent (Invitrogen). First-strand cDNAs were synthesized from total RNA using Superscript II reverse transcriptase (Invitrogen) with random hexamer primers. Quantitative PCR reactions were performed using IQ SYBR Green Supermix and the iCycler iQTM detection system (Bio-Rad).
Protein Immunoblotting
Protein concentration of cell lysates was determined using a spectrophotometer (NanoDrop 2000, Thermo Fisher Scientific, Wilmington, DE). Protein samples were resolved using a 4–12% Bis-Tris gel (Invitrogen) and transferred to PVDF membranes (Millipore Corp., Bedford, MA). Membranes were blocked in 5% nonfat skim milk in TBS-Tween (20 mm Tris, 137 mm NaCl, 0.1% Tween 20, pH 7.6) for 1 h and incubated with primary antibodies. Detection was achieved with the appropriate secondary antibodies and enhanced chemiluminescence (GE Healthcare, Piscataway, NJ). For Peptide blocking experiments, the primary anti-AGR2 antibody was first diluted in blocking buffer and incubated with the immunizing peptide (final concentration of peptide in blocking buffer was 127 ng/ml) at room temperature for 1 h with gentle rocking. Immunoblots were quantified using a flatbed scanner (Hewlett-Packard Scanjet, Palo Alto, CA) and ImageJ software.
Assays for Cell Proliferation and Anchorage-independent Growth
Cell proliferation was determined by plating 1 × 10⁴ cells in a 24-well tissue culture plate in 0.5 ml of DMEM supplemented with 0.5% FBS. The cells were harvested at different time points, mixed with an equal volume of trypan blue, and manually counted using a hemacytometer. Each time point is represented by the mean of 3 wells.
Anchorage-independent growth was assessed by colony formation in soft agar (3, 21). Cells were plated in DMEM supplemented with 10% FBS and 0.33% (w/v) Bacto-Agar (Difco, Detroit, MI) on top of a 0.6% agar bottom layer. The cells were fed weekly with DMEM supplemented with 10% FBS. After 2 weeks, the colony number was visually determined with a microscope.
Immunohistochemistry
Immunohistochemistry was performed using paraffin-embedded formaldehyde-fixed tissues sections. Antigen retrieval was enhanced by microwave heating in 10 mm citrate buffer (pH 6.0) for 12 min. Endogenous peroxidase was quenched using 1.5% H2O2, followed by blocking with 5% normal goat serum diluted in PBS. The primary antibodies are as previously noted and used at 1:200 in blocking serum. Sections were later treated with biotinylated secondary antibody for 30 min and ABC reagent for 45 min (PK-6101, Vector Labs, Burlingame, CA). Visualization was achieved using the horseradish peroxidase substrate (DAKO, Carpinteria, CA). Imaging was achieved using a Nikon E600 microscope. For immunofluorescence imaging, an anti-rabbit IgG conjugated to Alexa594 (Invitrogen) was used as a secondary antibody. The immunofluorescence for Fig. 2 was performed at the same time and under identical conditions for all samples, which also included consistent digital imaging exposures for the red channel. Imaging was performed with a Nikon TS-1 microscope equipped for confocal laser scanning fluorescence microscopy. Fluorescence intensities were determined with ImageJ.
FIGURE 2.
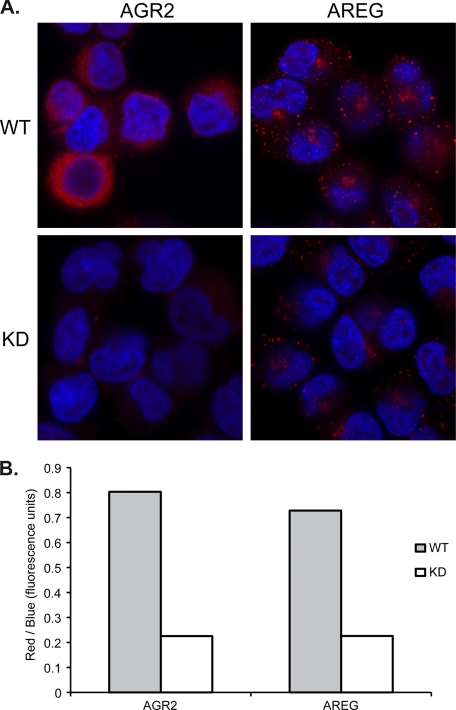
Clonal H460 cells express both AGR2 and AREG. Reduction of AGR2 expression results in decreased AREG protein. Immunofluorescence studies for AGR2 and AREG protein in vector control WT or AGR2 RNAi KD H460 cells. The cells were all processed for immunofluorescence at the same time under identical conditions. The images were acquired under identical conditions for each antibody (AGR2 or AREG) with no post-image processing performed. The fluorescence intensity for AGR2 and AREG (red) was measured using ImageJ and normalized for cell number using the blue (DAPI) fluorescence.
Statistical Analysis
When indicated, statistical differences were calculated using a nonparametric test (unpaired t test, 2-tailed) for unpaired samples, and differences between groups were compared using ANOVA (GraphPad Software, San Diego, CA).
Miscellaneous Methods
Secreted AREG was measured using the Amphiregulin Duo-set ELISA kit (DY262, R&D Systems, Minneapolis, MN).
For the ligand blocking studies, goat anti-human AREG antibody (AF262, R&D Systems) was resuspended in PBS at 100 μg/ml and applied to cells serum starved for 48 h at a concentration of 1 μg/ml antibody. Cells were incubated with the antibodies for 2 h before lysis for protein immunoblotting.
RESULTS
AGR2 and AREG Are Co-expressed in Human Adenocarcinoma Cells
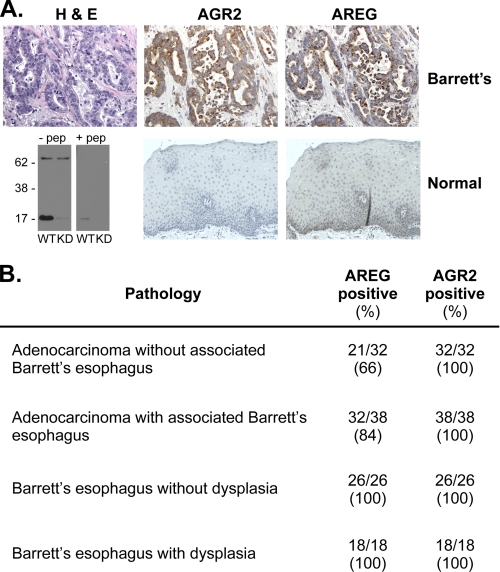
The expression of AGR2 and the EGFR ligand, AREG, has been described in many human adenocarcinomas of similar origin (4–11, 22–28). Our previous gene expression studies using DNA microarrays established that AGR2 is expressed in all esophageal adenocarcinomas and its premalignant precursor, Barrett's esophagus (4). AGR2 and AREG co-expression in human cancer was explored using immunohistochemistry of surgically resected esophageal adenocarcinomas. Anti-human AGR2 antisera was generated against the first 19 N-terminal amino acids after the signal peptide. The antisera detected a 17-kDa band consistent with AGR2. A 72-kDa band of unknown identity that is 23% of the intensity of AGR2 is also observed, which does not change in intensity when AGR2 expression is reduced by RNAi (Fig. 1A).
FIGURE 1.
AGR2 and AREG protein are expressed in esophageal adenocarcinoma cells. A, serial sections of esophageal adenocarcinoma (top row) stained with hematoxylin and eosin, or immunoperoxidase after probing with AGR2 or AREG specific antisera. (second row) Immunohistochemistry of normal esophageal tissues and a protein immunoblot of JH-EsoAd1 esophageal adenocarcinoma cells to characterize the anti-AGR2 antisera. The blots consisted of WT and AGR2 RNAi KD JH-EsoAd1 cells in the absence or presence of the antigenic peptide. There is a 72-kDa cross-reactive band that does not change in the knockdown cells. B, results of staining serial sections derived from a tissue microarray containing human Barrett's esophagus and esophageal adenocarcinomas. The images may be viewed at Stanford Tissue Microarray Consortium Web Portal (array block TA-304 and TA-305). See supplement S2 for scoring of the staining intensity.
Serial sections of surgically resected esophageal adenocarcinomas revealed co-expression of AGR2 and AREG proteins by neoplastic cells (Fig. 1A). Tissue microarrays were then used to determine the prevalence of co-expression for the two genes. All premalignant Barrett's esophagus cases expressed both AGR2 and AREG protein. AGR2 protein was also detected in all cases of esophageal adenocarcinomas, and AREG was similarly detected in 76% of samples (Fig. 1B). In addition, immunofluorescence of clonal H460 adenocarcinoma cells revealed co-expression of AGR2 and AREG protein. When AGR2 expression is reduced by RNA interference, the immunofluorescence emission of both AGR2 and AREG is reduced, suggesting a regulatory role for AGR2 (Fig. 2).
AGR2 Expression Induces AREG RNA and Protein Expression in Adenocarcinoma Cells
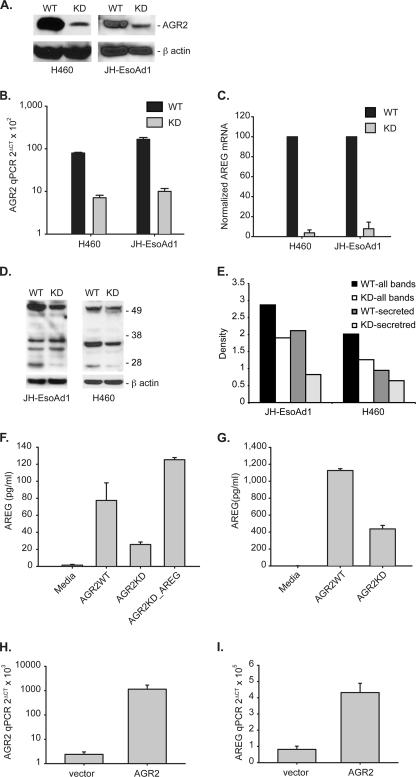
The relationship between AGR2 and AREG was further evaluated with cells in which AGR2 expression was reduced by RNA interference. Using H460 lung and JH-EsoAd1 esophageal cells in which AGR2 is highly expressed, RNA interference reduced AGR2 RNA by 11.2- and 16.6-fold and protein by 9.1- and 3.5-fold in H460-AGR2KD and JH-EsoAd1-AGR2KD cells, respectively (Fig. 3, A and B).
FIGURE 3.
AGR2 regulates AREG RNA and protein expression. A, protein immunoblots for AGR2 of cell lysates derived from H460 and JH-EsoAd1 cells after AGR2 knockdown yielding H460-AGR2KD and JH-EsoAd1-AGR2KD cells. β-Actin served as a loading control. WT, infected with the vector alone. B, log plot of AGR2 mRNA qPCR in AGR2 WT and KD H460 and JH-EsoAd1 cells. Values are normalized to β-actin mRNA. H460-AGR2WT versus H460-AGR2KD, p < 0.0001; JH-EsoAd1-AGR2WT versus JH-EsoAd1-AGR2KD, p = 0.0001. C, AREG mRNA expression in AGR2 wild type and knockdown cells. Mean qPCR values (n = 3) were adjusted such that WT cells equaled 100. H460-AGR2WT versus H460-AGR2KD, p < 0.0001; JH-EsoAd1-AGR2WT versus JH-EsoAd1-AGR2KD, p < 0.0001. D, immunoblots of whole cell lysates for cell-associated AREG in H460 cells and JH-EsoAd1 cells. The dominant immunoreactive bands include proAREG at 50 kDa and the processed form at 26kDa, both of which are secreted. The remaining bands between 26–50 kDa represent intracellular intermediates of AREG protein (18, 51, 52). E, scanning densitometry was performed for all AREG immunoreactive bands for H460 and JH-EsoAd1 cells and quantified using ImageJ. The results were normalized with β-actin. Shown in E are the densitometric results using all immunoreactive bands, or only the secreted 50 and 26 kDa bands. F and G, ELISA assay for secreted AREG in the culture media for WT and KD H460 (F) (p < 0.0001) and JH-EsoAd1 cells (G) (p < 0.0001). Statistical comparisons between the values utilized one-way ANOVA. Also shown is the effect of induced AREG expression by transfection in H460_AGR2KD cells (F, column 4). Values represent the mean of three independent experiments. AREG levels in the culture media alone were assayed as a control. H and I, controls where AGR2 expression is restored in H460_AGR2KD cells through transfection with AGR2 cDNA in which the 3′-untranslated region is truncated before the binding site for the shRNAi. Both AGR2 (H) and AREG (I) mRNA were assessed with qPCR in H460_AGR2KD cells transfected with vector or AGR2 cDNA.
The H460-AGR2KD and JH-EsoAd1-AGR2KD cells were then used to explore AGR2 effects on the EGF pathway by determining the expression of EGFR and its ligands AREG, epidermal growth factor (EGF), transformin growth factor α (TGFα), heparin-binding epidermal growth factor (HBEGF), betacellulin (BTC), epiregulin (EREG), and epigen (EPGN). Real-time quantitative PCR (qPCR) for AREG revealed a 27.0- and 12.8-fold decrease in mRNA levels in H460-AGR2KD and JH-EsoAd1-AGR2KD cells, respectively, compared with wild-type controls infected with the empty vector (Fig. 3C). The decrease in AREG mRNA was associated with a 1.5- and 1.6-fold decrease in cell-associated AREG protein in H460-AGR2KD and JH-EsoAd1-AGR2KD cell lysates, respectively, and a 2.6- and 1.5-fold reduction in cell associated AREG destined for secretion (Fig. 3, D and E). AREG protein is first synthesized as a transmembrane protein that is subsequently released from the plasma membrane by ADAM17 before binding to the EGF receptor (29). An ELISA for AREG released into the culture media showed a 3.1- and 2.6-fold decrease by H460-AGR2KD and JH-EsoAd1-AGR2KD cells, respectively (Fig. 3, F and G).
Controls were also performed to ensure that the reduction in AREG expression was specifically due to reduced AGR2 expression and not an off target effect of the RNA interference. AGR2 expression was rescued in the H460_AGR2KD cells through transfection of an AGR2 cDNA construct that encodes the entire AGR2 open reading frame, but not the 3′-untranslated region of the RNA to which the RNA interference sequence binds. Induction of AGR2 expression in the H460_AGR2KD cells resulted in a concomitant increase in AREG expression (Fig. 3, H and I).
Complementary experiments were performed to show that AGR2 overexpression also influences AREG expression. AGR2 expression in OE33 esophageal adenocarcinoma cells is 29.2-fold lower than H460 cells as determined by qPCR (Fig. 4A). Transfection of OE33 cells with AGR2 cDNA increased AGR2 mRNA by 42-fold, and resulted in a 7-fold increase in AREG mRNA (Fig. 4B, second column). Transfection of OE33 cells with AREG cDNA resulted in a 32-fold increase in AREG mRNA, but no significant change in AGR2 expression (Fig. 4A). Secreted AREG in the culture media from OE33 cells transfected with AGR2 increased by 3.7-fold compared with cells transfected with vector control (Fig. 4C). Thus AREG expression parallels that of AGR2.
FIGURE 4.
AGR2 overexpression induces AREG, but AREG expression does not affect AGR2 in OE33 esophageal adenocarcinoma cells. A, log scale plot of qPCR for AGR2; B, qPCR for AREG; WT, wild-type; AGR2, AGR2 overexpression; AREG, AREG overexpression in OE33 cells. C, ELISA of AREG in the culture media. Error bars represent ± 1 S. D. (n = 3).
AGR2 Does Not Induce Expression of Other EGF Ligands
The impact of AGR2 expression on the other known EGFR ligands and EGFR was also evaluated in H460 and JH-EsoAd1 cells. EGF, TGFα, and HBEGF expression was detected at low levels and was not significantly affected after reducing AGR2 expression (Fig. 5, A and B). The EGF ligands BTC, EREG, and EPGN were not expressed (not shown). Thus only AREG was highly expressed and affected by AGR2 expression.
FIGURE 5.
Effects of AGR2 expression on EGFR and other EGFR ligands. RNA quantification by qPCR of EGF, TGFα, HBEGF, and EGFR in H460 (A) and JH-EsoAd1 (B) cells with (WT) and without (KD) reduced AGR2 expression. C, AREG, EGF, TGFα, HBEGF, and EGFR mRNA levels after AGR2 overexpression in OE33 cells. BTC, EPREG, and EPNG were not detectable and are not shown. Control OE33 cells were transfected with pcDNA3.1-GFP. The insets contain an expanded image for EGF, TGFα, HBEGF, and EGFR. All values in the figure were normalized to β-actin. Error bars represent ± 1 S. D. (n = 3).
Changes in EGFR mRNA were detected only in H460-AGR2KD cells where a 5.6-fold reduction compared with wide-type control was observed. AGR2 expression did not affect EGFR expression in JH-EsoAd1 cells (Fig. 5, A and B). Corresponding results were obtained after AGR2 overexpression in OE33 cells where AREG expression increased, but no significant change in EGF, TGFα, HBEGF, or EGFR expression was observed (Fig. 5C).
AGR2 Expression Stimulates EGF Receptor Signaling
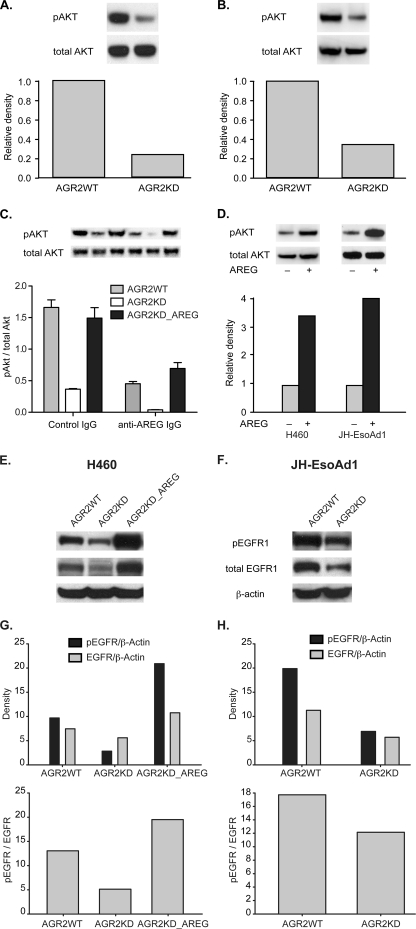
AREG protein binding to EGFR results in receptor phosphorylation and pathway activation (30). The phosphatidylinositol 3-kinase/AKT pathway is a downstream mediator of EGFR signaling (31). Protein immunoblotting of H460-AGR2KD and JH-EsoAd1-AGR2KD cell lysates revealed a 3.5- and 2.3-fold reduction, respectively, in AKT protein phosphorylation after AGR2 expression was reduced by RNA interference (Fig. 6, A and B).
FIGURE 6.
AGR2 regulates EGFR and AKT phosphorylation through AREG. A and B, immunoblots of total and phosphorylated AKT in H460 (A) and JH-EsoAd1 (B) cell lysates (8 μg). Cell lysates were derived from control (WT) and AGR2 KD cells. Shown is one representative blot of three independent experiments. The quantified relative densities are shown below the blots and represent the pAKT/total AKT ratio normalized to wild-type cells, which is set at 1.0. C, pAKT/total AKT ratio as determined by protein immunoblotting of H460 cells as noted. Cells were serum starved for 48 h followed by treatment with either 1 μg/ml of anti-AREG IgG or control rabbit IgG for 2 h. The values represent the mean ± 1 S. D. of three independent experiments. Statistical significance between the presence of anti-AREG antibodies and the cell line used (WT, KD, or AREG overexpression) were analyzed by two-way ANOVA (p = 0.0090). D, AREG rescue of AGR2 knockdown. Immunoblots of total and phosphorylated AKT without (−) and with (+) AREG overexpression by cDNA transfection of H460-AGR2KD (left) and JH-EsoAd1-AGR2KD (right) cells. E and F, protein immunoblots of WT and KD H460 (E) and JH-EsoAd1 (F) cell lysates for phosphorylated and total EGFR. Also included are H460-AGR2KD cells in which AREG was overexpressed by transfection (E). The immunoblots were probed with anti-phosphorylated EGFR, total EGFR, and β-actin antibodies. Shown below the immunoblots are graphs depicting the quantified bands normalized to β-actin. The top graphs represent the density of phosphorylated EGFR and total EGFR normalized to β-actin for H460 (G) and JH-EsoAd1 (H) cells. The bottom graphs represent the pEGFR/total EGFR ratio for the same cells.
AGR2 Effect on the EGFR Signaling Pathway Is Specifically Mediated by AREG
Whether EGFR signaling induced by AGR2 expression is specifically mediated by AREG was evaluated using an antibody-blocking experiment performed in the absence of serum. AKT phosphorylation was reduced when AREG mediated signaling was blocked in wild-type H460 or H460-AGR2KD cells with anti-AREG antibodies (Fig. 6C). Although phosphorylated AKT is low in H460-AGR2KD cells, an additional reduction was observed with AREG blocking antibodies. AREG is capable of rescuing the effects of AGR2 knockdown as AKT phosphorylation increased 3.4-fold in H460-AGR2KD cells and 4.0-fold in JH-EsoAd1-AGR2KD cells after transfection with AREG cDNA (Fig. 6D). The effect, however, is blocked in the presence of AREG blocking antibodies (Fig. 6C, column 6). The absence of AGR2 effects on the other EGF ligands and the results of the antibody blocking experiments indicate that AREG expression represents the major means of EGF pathway stimulation in response to AGR2 expression.
With respect to EGFR protein, AREG binding to the EGF receptor is known to result in receptor recycling in lieu of receptor degradation (32, 33). H460_AGR2KD and JH-EsoAd1_AGR2KD cells showed lower total and phosphorylated EGFR levels than their wild-type controls (Fig. 6, E--H). Lower ratios of phosphorylated to total EGFR was also observed in H460_AGR2KD and JH-EsoAd1_AGR2KD cells (Fig. 6, G and H). AREG overexpression in H460-AGR2KD cells increased total and phosphorylated EGFR as well as the phosphorylated EGFR/total EGFR ratio (Fig. 6, E and G).
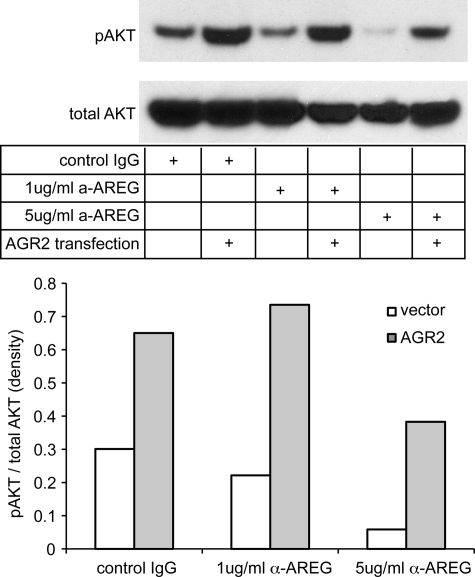
As an additional control, the converse experiment was performed in which AGR2 overexpression followed by antibody blocking of AREG was used to establish its specific effects on AKT phosphorylation. An increase in anti-AREG antibody concentration resulted in a greater reduction in AKT phosphorylation in wild-type OE33 cells (Fig. 7). Similar to Fig. 6D, OE33 cells exhibited an increase in AKT phosphorylation with AGR2 overexpression (Fig. 7), which was reduced at higher concentrations of antibody.
FIGURE 7.
AGR2 overexpression results in AKT phosphorylation via enhanced AREG expression. Blocking antibodies were used to determine whether AREG mediated the AGR2-induced AKT phosphorylation in OE33 cells. Two different concentrations of anti-AREG antibodies were applied to OE33 cells with (AGR2) or without (vector) AGR2 overexpression. Protein immunoblotting was then performed on the resultant cell lysates with antisera for either phosphorylated or total AKT. Densitometry was performed of the immunoblots and depicted on the graph as the pAKT/total AKT ratio.
AREG Rescues the Transformed Phenotype Associated with AGR2 Knockdown
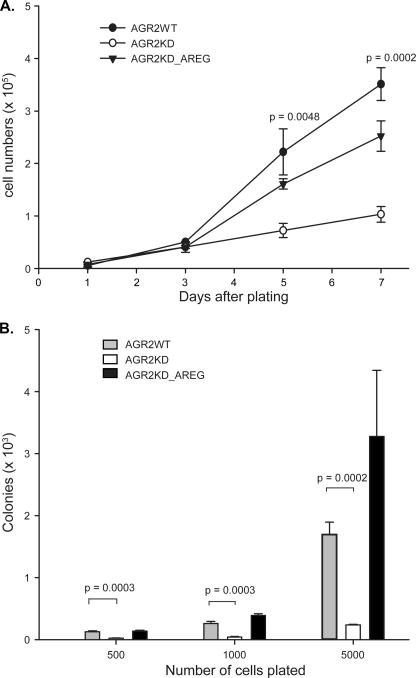
Previous in vitro work established that AGR2 induces a transformed phenotype based on cell proliferation and anchorage-independent growth (3, 6). AREG role in transformation was evaluated by evaluating whether it could rescue the phenotype after AGR2 expression was reduced. H460-AGR2KD cells grown in 0.5% fetal bovine serum showed a 3.1- and 3.4-fold reduction in proliferation rate 5 and 7 days after initial plating, respectively (Fig. 8A). Transfection of H460-AGR2KD cells with AREG cDNA partially rescued the decrease in cell proliferation (Fig. 8A). Previous work also demonstrated that reduced AGR2 expression in H460 cells decreases anchorage-independent growth in soft agar, a common feature of transformed cells (3). Induced AREG expression in H460-AGR2KD cells also rescued the prior reduction in anchorage-independent growth due to decreased AGR2 expression (Fig. 8B). These results, along with the antibody-blocking experiments (Figs. 6C and 7) establish AREG-EGFR signaling as the major signaling pathway mediating AGR2 effects on cell proliferation and anchorage-independent growth in H460 cells (Fig. 8).
FIGURE 8.
AREG mediates the AGR2 induced transformed phenotype. A, cell proliferation assay of H460 cells AGR2WT, AGR2KD, and AGR2KD_AREG that were cultured in 24-well plates (1 × 10⁴ cells/well) in 0.5 ml of DMEM supplemented with 0.5% FBS. The cells were harvested at the specified time points and manually counted. Each data point represents the mean of three wells; error bars = ± 1 S. D. B, assay of anchorage-independent growth of the same cells as above. Cells are plated in soft agar at different initial densities and assessed for colony number after 2 weeks. Column height represents the mean colony number from three different dishes; error bars, ±1 S.D.
AGR2 Activates the Hippo Pathway Co-activator, YAP1
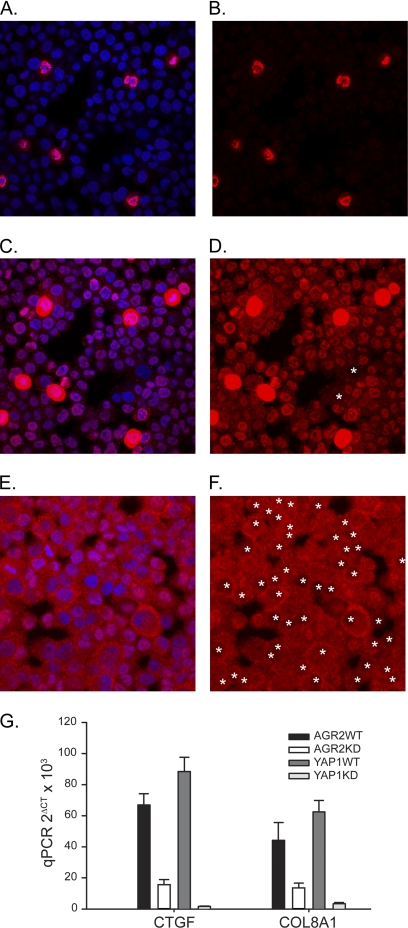
A recent study identified the Yes-associated protein (YAP1), a co-activator of transcription in the Hippo pathway, as responsible for AREG expression in a breast epithelial cell line, MCF10A (34). Whether YAP1 also mediates AGR2-induced AREG expression was evaluated. Decrease Hippo pathway activity results in YAP1 dephosphorylation, which results in its transport from the cytosol to the nucleus where it induces transcription as a co-activator with other DNA-binding proteins (35). Phosphorylated YAP1 remains in the cytosol bound to 14-3-3 and has no co-activator activity. Immunofluorescent imaging was performed for YAP1 protein in H460_AGR2WT and H460_AGR2KD cells in which AGR2 expression was reduced with RNA interference. A subpopulation (5%) of intensely staining nuclear YAP1 cells was observed in wild-type H460_AGR2WT cells (Fig. 9, A and B). When the gain in the red channel was increased to detect YAP1 in the remaining cells, the majority of cells (99%) clearly exhibited nuclear staining (Fig. 9, C and D). In contrast, none of the H460_AGR2KD cells exhibited the high intensity nuclear YAP1 fluorescence seen in the wild-type cells. Most of the cells exhibited much lower total YAP1 fluorescence. including a much lower proportion (67%) with nuclear predominant YAP1 localization (Fig. 9, E and F).
FIGURE 9.
AGR2 expression induces YAP1 nuclear localization and the expression of YAP1 targets. Wild-type H460 (A–D) and H460_AGR2KD (E and F) cells labeled with anti-YAP1 antibodies (red) or DAPI nuclear stain (blue). Panels A, C, and E display both the red and blue channels, whereas panels B, D, and F display only the red channel. Panels A–D all represent the same cells except that the images acquired for panels C and D were obtained at a higher gain in the red channel to reveal subcellular YAP1 distribution in cells with lower expression. Panels E and F represent H460_AGR2KD cells with reduced AGR2 expression. The contrast was enhanced in panels E and F to facilitate determination of the YAP1 subcellular distribution. The white asterisks in panels D and F denote cells with predominant cytoplasmic YAP1 localization. There are 190 cells as determined by DAPI nuclear staining in panels A–D and 159 cells in panels E and F. G, qPCR of YAP1 targets in H460 cells with (KD) or without (WT) AGR2 knockdown or in control cells without (YAP1WT) or with YAP1 knockdown (YAP1KD).
Recent studies of breast epithelial MCF10A and MDA-MB-231 cells, which express AREG, have demonstrated that the YAP target genes, CTGF and COL8A1 are also affected (36). The expression of these potential YAP1 targets was evaluated in response to changes in AGR2 expression. Reduced AGR2 expression in H460 cells resulted in significant reduction in CTGF and COL8A1 expression. As a control, reduction of YAP1 expression with RNA interference resulted in reduced expression in both genes.
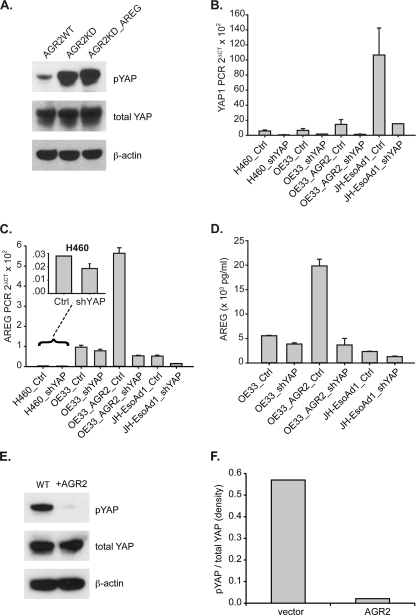
Additional evidence of AGR2 impact on YAP1 activation included a determination of YAP1 phosphorylation status. The ratio phosphorylated to total YAP1 increased 5.8-fold in H460-AGR2KD cells (Fig. 10A). The change in YAP1 phosphorylation is not due to reduced AREG expression because AREG overexpression in H460-AGR2KD cells did not affect YAP1 phosphorylation (Fig. 10A). Thus AGR2 expression results in YAP1 dephosphorylation.
FIGURE 10.
AGR2 induces AREG expression through YAP1. A, immunoblotting with isoform-specific antibodies for phosphorylated and total YAP1 protein in H460 cells. The H460 cells shown include controls (WT), AGR2 KD, and AGR2-KD_AREG cells where AREG is overexpressed after transfection. B, qPCR of YAP1 after expression of YAP1-specific shRNAmir in H460, OE33, and JH-EsoAd1 cells. Before qPCR was performed, the cells were FACS sorted for high GFP expression. OE33_AGR2 represent cells transfected with AGR2 cDNA. C, qPCR of AREG using the same cells as in panel B. D, ELISA for AREG protein in the tissue culture media of OE33 and JH-EsoAd1 cells. H460, OE33, and JH-EsoAd1 cells were FACS-sorted for GFP expression 72 h after RNAi exposure followed by another 48 h in culture before the media was collected for the AREG ELISA assay. E, protein immunoblotting of OE33 cell lysates for phosphorylated and total YAP1, and β-actin with and without AGR2 overexpression. F, plots derived from densitometry of the protein immunoblots (E) quantified with ImageJ.
YAP1 Activation Is Necessary for AGR2 Induction of AREG Expression
Knockdown of YAP1 expression with RNA interference was performed in H460, OE33, and JH-EsoAd1 cells to evaluate whether reduced YAP1 expression affects AGR2 induced AREG expression. Because decrease YAP1 expression impairs cell growth that precludes drug selection, green fluorescent protein (GFP) was coexpressed with YAP1 RNA interference, which permitted cell sorting of high GFP-expressing cells for further analysis. Isolated cells from all three cell lines exhibited reduced YAP1 expression (Fig. 10B), which was also associated with lower AREG mRNA levels (Fig. 10C) and secreted AREG protein (Fig. 10D). AGR2 overexpression in OE33 cells resulted a 2.2-fold increase in YAP1 mRNA (Fig. 10B, column 5), as well as a 27-fold decrease in phosphorylated YAP1 (Fig. 10, E and F). YAP1 knockdown in OE33 cells that overexpress AGR2 (OE33_AGR2_shYAP) resulted in a 11.2-fold decrease in YAP1 RNA (Fig. 10B, column 6), a 10.6-fold decrease in AREG RNA (Fig. 10C, column 6), and a 5.4-fold decrease in secreted AREG (Fig. 10D, column 4). The loss of AREG expression after YAP1 knockdown was not rescued by AGR2 overexpression (Fig. 10D, column 4). Thus YAP1 is necessary for AGR2 induction of AREG expression.
DISCUSSION
AREG protein is an EGFR ligand that is expressed in higher vertebrates. A significant role for AREG has been established in development and neoplasia (19, 37, 38). Similar to AGR2, AREG expression has also been detected in esophageal, gastric, breast, lung, stomach, colon, prostate, ovarian, and pancreatic cancers (4, 5, 22–28). AREG has also been demonstrated to support the growth of tumor cell lines in vitro and xenografts in vivo (22, 39).
The present study functionally links AGR2 and AREG and supports a significant role for AGR2 in adenocarcinomas and the regulation of cell growth. The present study establishes that AREG is the major EGFR ligand impacted by AGR2 expression. Although the affinity of AREG for the EGFR receptor is 60% lower than that of EGF (30), AREG mRNA expression is much higher (16- and 200-fold higher than EGF in H460 and JHesoAd1 cells, respectively) and dramatically affected by AGR2 expression (Fig. 5). As a result of AGR2 expression, AREG stimulates the EGFR signaling pathway and is responsible for the increased cell proliferation and anchorage-independent growth observed in transformed cells (3, 6).
The Hippo pathway serves to regulate cell proliferation and apoptosis, and functions in regulating organ size (40). Recent studies have also implicated YAP1 in regulating stem cell division (41–43). Repression of the Hippo pathway results in YAP1 dephosphorylation followed by transport to the nucleus where it inhibits apoptosis and promotes cell division. Nuclear YAP1 protein is associated with neoplasia and has been observed in lung, colon, ovarian, and breast adenocarcinomas (44, 45). In the normal intestine, YAP1 expression is restricted to progenitor cells in the intestinal crypt, and its overexpression in mouse intestinal cells results in features similar to those observed in colon cancer (46). The spectrum of cancers associated with nuclear YAP1 is also coincident with reports concerning AGR2 expression. The present study demonstrates that AGR2 induces AREG expression through YAP1 dephosphorylation and identifies an additional mechanism of action for AGR2 in adenocarcinomas.
The specific molecular mechanism by which AGR2 achieves its effects is unknown. Analysis of AGR2 amino acid sequence reveals a homology to the thioredoxin family, although it lacks the second cysteine residue usually present in the active site (47). Other studies have proposed a role as a secretory protein with binding to potential receptors (8). Recruitment of the Hippo and EGF signaling pathways by AGR2 represents the major finding of this study. The identification of the participating signaling pathways in this study will facilitate identification of candidate targets for AGR2.
A relationship between tissue regeneration and cancer is supported by the study findings. AGR2 is expressed in the early stages of limb regeneration in salamanders. Transgenic AGR2 expression in the severed salamander limb is able to rescue nerve-dependent regeneration (2). Likewise, Yorkie, the drosophila homolog of YAP1, serves an essential role in stimulating intestinal stem cell proliferation and subsequent tissue regeneration in response to chemotherapy-induced damage of the Drosophila midgut or DSS induce colitis in the mouse (41, 48). AREG-null mice also exhibit defects in intestinal and liver regeneration after induced damage (49, 50). Thus all three major components identified in this study have been implicated in cancer and tissue regeneration. The present study establishes a linkage between AGR2 and the Hippo and EGF signaling pathways, and supports a potential relationship in tissue regeneration and growth control. AGR2-restricted distribution and upstream position in the signaling cascade of the Hippo and EGF pathways provides a novel target for further exploration, including the development of new therapies for cancer.
Supplementary Material
Acknowledgments
We thank Shirley Kwok and Kelli Montgomery for technical assistance of processing the tissue microarrays and Dr. Winand Dinjens (Erasmus Medical Center, Rotterdam, the Netherlands) who provided the genotype characterization of the H460 cell line.
This work was supported, in whole or in part, by National Institutes of Health Grant DK063624 (to A. W. L.), DK56339 (Stanford University Digestive Disease Center), and the Stanford Cancer Center.

The on-line version of this article (available at http://www.jbc.org) contains supplemental Figs. S1 and S2.
- AGR2
- Anterior Gradient Homolog 2
- KD
- knockdown
- AREG
- amphiregulin
- YAP
- Yes-associated protein.
REFERENCES
- 1. Aberger F., Weidinger G., Grunz H., Richter K. (1998) Mech. Dev. 72, 115–130 [DOI] [PubMed] [Google Scholar]
- 2. Kumar A., Godwin J. W., Gates P. B., Garza-Garcia A. A., Brockes J. P. (2007) Science 318, 772–777 [DOI] [PMC free article] [PubMed] [Google Scholar]
- 3. Wang Z., Hao Y., Lowe A. W. (2008) Cancer Res. 68, 492–497 [DOI] [PubMed] [Google Scholar]
- 4. Hao Y., Triadafilopoulos G., Sahbaie P., Young H. S., Omary M. B., Lowe A. W. (2006) Gastroenterology 131, 925–933 [DOI] [PMC free article] [PubMed] [Google Scholar]
- 5. Lowe A. W., Olsen M., Hao Y., Lee S. P., Taek Lee K., Chen X., van de Rijn M., Brown P. O. (2007) PLoS ONE 2, e323. [DOI] [PMC free article] [PubMed] [Google Scholar]
- 6. Ramachandran V., Arumugam T., Wang H., Logsdon C. D. (2008) Cancer Res. 68, 7811–7818 [DOI] [PMC free article] [PubMed] [Google Scholar]
- 7. Thompson D. A., Weigel R. J. (1998) Biochem. Biophys. Res. Commun. 251, 111–116 [DOI] [PubMed] [Google Scholar]
- 8. Zhang J. S., Gong A., Cheville J. C., Smith D. I., Young C. Y. (2005) Genes Chromosomes Cancer 43, 249–259 [DOI] [PubMed] [Google Scholar]
- 9. Fritzsche F. R., Dahl E., Dankof A., Burkhardt M., Pahl S., Petersen I., Dietel M., Kristiansen G. (2007) Histology and histopathology 22, 703–708 [DOI] [PubMed] [Google Scholar]
- 10. Zhu H., Lam D. C., Han K. C., Tin V. P., Suen W. S., Wang E., Lam W. K., Cai W. W., Chung L. P., Wong M. P. (2007) Cancer Lett. 245, 303–314 [DOI] [PubMed] [Google Scholar]
- 11. Edgell T. A., Barraclough D. L., Rajic A., Dhulia J., Lewis K. J., Armes J. E., Barraclough R., Rudland P. S., Rice G. E., Autelitano D. J. (2010) Clin. Sci. 118, 717–725 [DOI] [PubMed] [Google Scholar]
- 12. Liu D., Rudland P. S., Sibson D. R., Platt-Higgins A., Barraclough R. (2005) Cancer Res. 65, 3796–3805 [DOI] [PubMed] [Google Scholar]
- 13. Boonstra J. J., van Marion R., Beer D. G., Lin L., Chaves P., Ribeiro C., Pereira A. D., Roque L., Darnton S. J., Altorki N. K., Schrump D. S., Klimstra D. S., Tang L. H., Eshleman J. R., Alvarez H., Shimada Y., van Dekken H., Tilanus H. W., Dinjens W. N. (2010) J. Natl. Cancer Inst. 102, 271–274 [DOI] [PMC free article] [PubMed] [Google Scholar]
- 14. Banks-Schlegel S. P., Gazdar A. F., Harris C. C. (1985) Cancer Res. 45, 1187–1197 [PubMed] [Google Scholar]
- 15. Alvarez H., Koorstra J. B., Hong S. M., Boonstra J. J., Dinjens W. N., Foratiere A. A., Wu T. T., Montgomery E., Eshleman J. R., Maitra A. (2008) Cancer Biol. Ther. 7, 1753–1755 [DOI] [PMC free article] [PubMed] [Google Scholar]
- 16. Rockett J. C., Larkin K., Darnton S. J., Morris A. G., Matthews H. R. (1997) Br. J. Cancer 75, 258–263 [DOI] [PMC free article] [PubMed] [Google Scholar]
- 17. Johnson G. R., Saeki T., Gordon A. W., Shoyab M., Salomon D. S., Stromberg K. (1992) J. Cell Biol. 118, 741–751 [DOI] [PMC free article] [PubMed] [Google Scholar]
- 18. Martinez-Lacaci I., Johnson G. R., Salomon D. S., Dickson R. B. (1996) J. Cell. Physiol. 169, 497–508 [DOI] [PubMed] [Google Scholar]
- 19. Schuger L., Johnson G. R., Gilbride K., Plowman G. D., Mandel R. (1996) Development 122, 1759–1767 [DOI] [PubMed] [Google Scholar]
- 20. Silva J. M., Li M. Z., Chang K., Ge W., Golding M. C., Rickles R. J., Siolas D., Hu G., Paddison P. J., Schlabach M. R., Sheth N., Bradshaw J., Burchard J., Kulkarni A., Cavet G., Sachidanandam R., McCombie W. R., Cleary M. A., Elledge S. J., Hannon G. J. (2005) Nat. Genet. 37, 1281–1288 [DOI] [PubMed] [Google Scholar]
- 21. Cox A. D., Der C. J. (1994) Methods Enzymol. 238, 277–294 [DOI] [PubMed] [Google Scholar]
- 22. Willmarth N. E., Ethier S. P. (2006) J. Biol. Chem. 281, 37728–37737 [DOI] [PubMed] [Google Scholar]
- 23. Castillo J., Erroba E., Perugorría M. J., Santamaria M., Lee D. C., Prieto J., Avila M. A., Berasain C. (2006) Cancer Res. 66, 6129–6138 [DOI] [PubMed] [Google Scholar]
- 24. Ebert M., Yokoyama M., Kobrin M. S., Friess H., Lopez M. E., Büchler M. W., Johnson G. R., Korc M. (1994) Cancer Res. 54, 3959–3962 [PubMed] [Google Scholar]
- 25. Saeki T., Stromberg K., Qi C. F., Gullick W. J., Tahara E., Normanno N., Ciardiello F., Kenney N., Johnson G. R., Salomon D. S. (1992) Cancer Res. 52, 3467–3473 [PubMed] [Google Scholar]
- 26. Akagi M., Yokozaki H., Kitadai Y., Ito R., Yasui W., Haruma K., Kajiyama G., Tahara E. (1995) Cancer 75, 1460–1466 [PubMed] [Google Scholar]
- 27. Bostwick D. G., Qian J., Maihle N. J. (2004) Prostate 58, 164–168 [DOI] [PubMed] [Google Scholar]
- 28. D'Antonio A., Losito S., Pignata S., Grassi M., Perrone F., De Luca A., Tambaro R., Bianco C., Gullick W. J., Johnson G. R., Iaffaioli V. R., Salomon D. S., Normanno N. (2002) Int. J. Oncol. 21, 941–948 [PubMed] [Google Scholar]
- 29. Blobel C. P. (2005) Nat. Rev. Mol. Cell Biol. 6, 32–43 [DOI] [PubMed] [Google Scholar]
- 30. Shoyab M., Plowman G. D., McDonald V. L., Bradley J. G., Todaro G. J. (1989) Science 243, 1074–1076 [DOI] [PubMed] [Google Scholar]
- 31. Gan Y., Shi C., Inge L., Hibner M., Balducci J., Huang Y. (2010) Oncogene 29, 4947–4958 [DOI] [PubMed] [Google Scholar]
- 32. Stern K. A., Place T. L., Lill N. L. (2008) Biochem. J. 410, 585–594 [DOI] [PMC free article] [PubMed] [Google Scholar]
- 33. Baldys A., Göoz M., Morinelli T. A., Lee M. H., Raymond J. R., Jr., Luttrell L. M., Raymond J. R., Sr. (2009) Biochemistry 48, 1462–1473 [DOI] [PMC free article] [PubMed] [Google Scholar]
- 34. Zhang J., Ji J. Y., Yu M., Overholtzer M., Smolen G. A., Wang R., Brugge J. S., Dyson N. J., Haber D. A. (2009) Nat. Cell Biol. 11, 1444–1450 [DOI] [PMC free article] [PubMed] [Google Scholar]
- 35. Zhao B., Li L., Lei Q., Guan K. L. (2010) Genes Dev. 24, 862–874 [DOI] [PMC free article] [PubMed] [Google Scholar]
- 36. Zhang J., Smolen G. A., Haber D. A. (2008) Cancer Res. 68, 2789–2794 [DOI] [PubMed] [Google Scholar]
- 37. Sternlicht M. D., Sunnarborg S. W., Kouros-Mehr H., Yu Y., Lee D. C., Werb Z. (2005) Development 132, 3923–3933 [DOI] [PMC free article] [PubMed] [Google Scholar]
- 38. Yotsumoto F., Yagi H., Suzuki S. O., Oki E., Tsujioka H., Hachisuga T., Sonoda K., Kawarabayashi T., Mekada E., Miyamoto S. (2008) Biochem. Biophys. Res. Commun. 365, 555–561 [DOI] [PubMed] [Google Scholar]
- 39. Ma L., Gauvillé C., Berthois Y., Millot G., Johnson G. R., Calvo F. (1999) Oncogene 18, 6513–6520 [DOI] [PubMed] [Google Scholar]
- 40. Zeng Q., Hong W. (2008) Cancer Cell 13, 188–192 [DOI] [PubMed] [Google Scholar]
- 41. Staley B. K., Irvine K. D. (2010) Curr. Biol. 20, 1–8 [DOI] [PMC free article] [PubMed] [Google Scholar]
- 42. Ren F., Wang B., Yue T., Yun E. Y., Ip Y. T., Jiang J. (2010) Proc. Natl. Acad. Sci. U.S.A. 107, 21064–21069 [DOI] [PMC free article] [PubMed] [Google Scholar]
- 43. Lian I., Kim J., Okazawa H., Zhao J., Zhao B., Yu J., Chinnaiyan A., Israel M. A., Goldstein L. S., Abujarour R., Ding S., Guan K. L. (2010) Genes Dev. 24, 1106–1118 [DOI] [PMC free article] [PubMed] [Google Scholar]
- 44. Steinhardt A. A., Gayyed M. F., Klein A. P., Dong J., Maitra A., Pan D., Montgomery E. A., Anders R. A. (2008) Hum. Pathol. 39, 1582–1589 [DOI] [PMC free article] [PubMed] [Google Scholar]
- 45. Dong J., Feldmann G., Huang J., Wu S., Zhang N., Comerford S. A., Gayyed M. F., Anders R. A., Maitra A., Pan D. (2007) Cell 130, 1120–1133 [DOI] [PMC free article] [PubMed] [Google Scholar]
- 46. Camargo F. D., Gokhale S., Johnnidis J. B., Fu D., Bell G. W., Jaenisch R., Brummelkamp T. R. (2007) Curr. Biol. 17, 2054–2060 [DOI] [PubMed] [Google Scholar]
- 47. Persson S., Rosenquist M., Knoblach B., Khosravi-Far R., Sommarin M., Michalak M. (2005) Mol. Phylogenet. Evol. 36, 734–740 [DOI] [PubMed] [Google Scholar]
- 48. Cai J., Zhang N., Zheng Y., de Wilde R. F., Maitra A., Pan D. (2010) Genes Dev. 24, 2383–2388 [DOI] [PMC free article] [PubMed] [Google Scholar]
- 49. Berasain C., García-Trevijano E. R., Castillo J., Erroba E., Lee D. C., Prieto J., Avila M. A. (2005) Gastroenterology 128, 424–432 [DOI] [PubMed] [Google Scholar]
- 50. Shao J., Sheng H. (2010) Endocrinology 151, 3728–3737 [DOI] [PMC free article] [PubMed] [Google Scholar]
- 51. Brown C. L., Coffey R. J., Dempsey P. J. (2001) J. Biol. Chem. 276, 29538–29549 [DOI] [PubMed] [Google Scholar]
- 52. Brown C. L., Meise K. S., Plowman G. D., Coffey R. J., Dempsey P. J. (1998) J. Biol. Chem. 273, 17258–17268 [DOI] [PubMed] [Google Scholar]
Associated Data
This section collects any data citations, data availability statements, or supplementary materials included in this article.


