

In bacterial chemotaxis, several types of receptors form mixed clusters. Receptor adaptation is shown to depend on the receptor's own conformational state rather than on the cluster's global activity, enabling cells to differentiate stimuli in complex environments.
Keywords: bacterial chemotaxis, high sensitivity to multiple signals, methylation crosstalk, mixed receptor cluster, sensory adaptation
Abstract
In bacterial chemotaxis, several types of ligand-specific receptors form mixed clusters, wherein receptor–receptor interactions lead to signal amplification and integration. However, it remains unclear how a mixed receptor cluster adapts to individual stimuli and whether it can differentiate between different types of ligands. Here, we combine theoretical modeling with experiments to reveal the adaptation dynamics of the mixed chemoreceptor cluster in Escherichia coli. We show that adaptation occurs locally and is ligand-specific: only the receptor that binds the external ligand changes its methylation level when the system adapts, whereas other types of receptors change methylation levels transiently. Permanent methylation crosstalk occurs when the system fails to adapt accurately. This local adaptation mechanism enables cells to differentiate individual stimuli by encoding them into the methylation levels of corresponding types of chemoreceptors. It tunes each receptor to its most responsive state to maintain high sensitivity in complex environments and prevents saturation of the cluster by one signal.
Introduction
In environments with multiple cues, organisms need to sense different signals and process the complex information in order to make decisions to enhance their chances of survival; e.g., to move toward nutrients and away from toxins. Two-component sensory kinase systems are used ubiquitously in the prokaryotic world and in plant and yeast cells to sense environmental stress and mediate appropriate cellular responses (Hoch and Silhavy, 1995; Stock et al, 2000). One of the best studied two-component systems is the bacterial chemosensory pathway, which also serves as a model system for understanding general principles of sensory signal transduction in biology (Adler, 1976; Falke et al, 1997; Falke and Hazelbauer, 2001; Laub and Goulian, 2007; Hazelbauer et al, 2008). In Escherichia coli, extracellular chemical information is sensed by several types of transmembrane chemoreceptors, each binding to a different set of chemical ligands and converting this binding into the regulation of intracellular pathway activity. Tar and Tsr receptors are the two most abundant chemoreceptors in E. coli, specific for aspartate and serine, respectively (Grebe and Stock, 1998). Experiments showed that the receptors form hetero-trimers of homo-dimers in bacterial cytoplasmic membrane (Kim et al, 1999; Ames et al, 2002; Studdert and Parkinson, 2005), and these receptor trimers-of-dimers associate to form clusters together with the cytoplasmic adaptor protein CheW and the histidine kinase CheA (Maddock and Shapiro, 1993; Kentner et al, 2006). Ligand binding to receptors changes the autophosphorylation activity of the attached CheA, which in turn affects phosphorylation of the response regulator protein CheY and eventually regulates cell swimming.
To explain the large signal amplification and high sensitivity in bacterial chemotaxis, receptor cooperativity in the cluster was first proposed by Bray and coworkers (Bray et al, 1998; Duke and Bray, 1999). This important insight has been confirmed by in vitro (Bornhorst and Falke, 2000; Li and Weis, 2000) and in vivo experiments (Sourjik and Berg, 2002, 2004) as well as by subsequent quantitative modeling (Mello and Tu, 2003b, 2005; Mello et al, 2004; Endres and Wingreen, 2006; Keymer et al, 2006). In particular, in vivo measurements of pathway activity using fluorescence resonance energy transfer (FRET; Sourjik and Berg, 2002; Vaknin and Berg, 2007) and the corresponding modeling work (Mello and Tu, 2003b) demonstrated strong interactions between different types of chemoreceptors, such as Tar and Tsr. Cooperativity among different types of receptors allows them to act together (globally) in the mixed cluster to amplify the response to any specific signal.
Sensory adaptation in E. coli chemotaxis is carried out by receptor methylation and demethylation, mediated by two cytoplasmic enzymes: methyltransferase (CheR) and methylesterase (CheB), which add and remove methyl group (CH3+) at specific methylation sites on the receptor, respectively. This covalent modification of the receptor modulates the activity of the attached histidine kinase CheA, which phosphorylates not only CheY but also CheB. As CheB methylesterase activity dramatically increases on phosphorylation (Djordjevic et al, 1998), the overall (global) kinase activity can control the methylation process through CheB phosphorylation. In addition, receptors undergo reversible conformational changes upon ligand binding and methylation, e.g., in their HAMP domain (a linkage domain underneath the plasma membrane) as shown by recent cryoelectron microscopy experiments for E. coli Tsr receptor (Khursigara et al, 2008). Studies on ubiquitin receptors have shown that conformational changes in the linkage domain can affect the selectivity and affinity of enzyme binding and catalysis processes (Sims and Cohen, 2009; Sims et al, 2009), and the observed conformational change in MCP receptors can, in principle, also directly affect methylation kinetics, providing a possible local feedback mechanism, in which the adaptation of an individual receptor is controlled by its own ‘local’ activity. Besides evidences from structural studies, a recent systematic study of receptor modification kinetics (Amin and Hazelbauer, 2010) has clearly confirmed that the receptor methylation rate is modulated by the receptor's ligand occupancy and methylation level, which are related to its activity/conformation.
Despite our understanding of the heterogeneous receptor cooperativity, little is known about its effects on the adaptation process in the mixed receptor clusters. To explain the observed accurate adaptation to external stimuli, Barkai and Leibler (1997) first proposed that the receptor methylation/demethylation in bacterial chemotaxis depends on the activity of receptor–kinase complexes. This integral feedback mechanism (Yi et al, 2000) maintains the overall kinase activity of the cell within the narrow operational range of the ultrasensitive flagellar motor (Cluzel et al, 2000). However, as illustrated in Figure 1A, if the overall kinase activity controls the methylation/demethlayion dynamics of the individual receptors and if the receptors are strongly coupled in the cluster, there will be severe methylation crosstalk between different types of receptors; e.g., the Tsr receptors will be methylated to the same degree as the Tar receptors even when the cell only experiences a change in the aspartate concentration. As receptor methylation serves as the cell's memory of the external chemical environment (Webre et al, 2003), such severe methylation crosstalk would limit the ability of a cell to ‘remember’ multiple stimuli distinctively and consequently decrease the cell's ability to detect different signals. The key question is therefore whether different chemoreceptors can avoid methylation crosstalk (memory ‘contamination’) in the presence of strong heterogeneous receptor–receptor interactions by adapting locally as illustrated in Figure 1B.
Figure 1.

Illustration of the different models of receptor adaptation and receptor cooperativity. (A) The global adaptation model, in which the overall integrated activity a controls the methylation dynamics of individual receptor. [L]1(2) represents MeAsp (serine) concentration; m1(2) and a1(2) represent Tar (Tsr) methylation level and its local activity (conformational state). (B) The local adaptation model, in which the methytlation of individual receptor is controlled by its own conformational changes. (C) The MWC-type model for receptor cooperativity. The extended receptor cluster is divided into tightly coupled functional complex (large dashed circle), within which the receptors, Tar (blue circle) and Tsr (red circle), are synchronized to be either active (filled) or inactive (hollow). (D) The Ising-type model, in which neighboring receptors interact with a finite coupling strength to favor (but not absolutely enforce) same activities.
The receptor cooperativity has been described recently using classical Monod–Wyman–Changeux (MWC) allosteric model (Monod et al, 1965), in which receptors behave in an all-or-none manner in a functional cluster (activity of receptors in a functional cluster can be either all on or all off), as illustrated in Figure 1C. The MWC model has been successfully used to describe the regulation of kinase activity in mixed receptor cluster in responses to stimuli (Sourjik and Berg, 2004; Mello and Tu, 2005; Keymer et al, 2006). However, because of the all-or-none assumption, the MWC-type model would predict the same methylation pattern for Tar and Tsr within a heterogeneous receptor cluster independent of the signal (Endres and Wingreen, 2006), which is inconsistent with the ligand-specific adaptation reported previously (Silverman and Simon, 1977; Sanders and Koshland, 1988; Antommattei et al, 2004).
On the basis of ‘conformational spread’ concept put forth by Bray et al (1998), the E. coli chemoreceptor cluster was first modeled using an Ising-type model by Duke and Bray (1999) (see also a review by Bray and Duke, 2004). Although the Duke and Bray model successfully demonstrated the heightened sensitivity due to receptor–receptor interaction, it was too simplistic, with only one type of receptor and two methylation levels (m=0, 1), to describe the adaptation dynamics of the mixed receptor cluster. Around the same time, a detailed free-energy-based stochastic model (Morton-Firth et al, 1999) was developed to study the adaptation dynamics of the chemoreceptors in response to addition of aspartate. However, without considering the receptor–receptor interaction, this model predicted a decrease in Tsr methylation level in response to aspartate addition, which disagrees with the experimental observations (Sanders and Koshland, 1988). Later, Shimizu et al (2003) incorporated receptor–receptor coupling into this model and generally established the connection between receptor–receptor coupling strength and signal amplification. However, only one type of receptor was considered in Shimizu et al (2003). An Ising-type model for mixed receptor cluster was first proposed by Mello and Tu (2003b). Direct comparison between this mixed receptor Ising-type model and FRET experiments (Sourjik and Berg, 2002) was able to show a strong interaction between different types of chemoreceptors in the cluster. However, the adaptation dynamics of the mixed receptor cluster was not addressed in Mello and Tu (2003b). Goldman et al (2009) has recently proposed an alternative Ising-type model to explain the selective methylation in mixed receptor system. In this model, there is no direct receptor–receptor interaction. Instead, cooperative CheA–CheA interactions within an extended CheA lattice (Goldman et al, 2009). The absence of direct receptor–receptor interaction eliminates methylation crosstalk. As shown in Goldman et al (2009), the Tsr methylation level does not change at all in response to aspartate, not even transiently. This is inconsistent with the previous experiments (Sanders and Koshland, 1988) and the new experimental data to be presented later in this paper, which clearly shows the existence of transient methylation crosstalk. Moreover, direct interactions between receptor dimers within the basic trimer-of-dimer receptor unit has been observed in FRET experiments (Vaknin and Berg, 2007; Kentner and Sourjik, 2009), even in the absence of CheW and CheA. In addition, there has been no direct experimental evidence in support of the cooperative CheA–CheA interaction in the cluster as assumed in the Goldman model.
Here, we develop a theory (model) for the mixed chemoreceptor cluster in which receptors interact directly between nearest neighbors (nn) as illustrated in Figure 1D, and a local adaptation (LA) scheme is used to describe the methylation kinetics of individual receptors as shown in Figure 1B. Predictions made by this model were tested by direct measurements of the receptor methylation dynamics for both Tar and Tsr in response to ligands sensed by either receptor. Combining theory and experiments, we address the two basic questions of whether bacteria can differentiate different stimuli and how such information can be used to enhance sensitivity in complex environment with multiple cues.
Results
Modeling framework and mathematical procedures
The LA model for a mixed receptor network with nn interactions is illustrated in Figure 1B and D. There are two types of chemoreceptors in the cluster: Tar that binds aspartate and α-methyl-D,L-aspartate (MeAsp), and Tsr that binds serine. Each individual receptor, Rqlam, is characterized by four state variables (written as subscripts). q represents the type of receptor with q=1 for Tar and q=2 for Tsr. l=0, 1 indicates ligand binding state of the receptor to be either vacant or occupied. a=0, 1 represents inactive or active conformation of the receptor. m is the receptor methyl level. Tar and Tsr receptors can have up to 4 and 5 methyl groups, respectively. For simplicity, we use m∈[0, 4] for both receptors. This simplification does not affect our results and conclusions. Neighboring receptors in the connected network, which does not have to be an ordered lattice, can interact and affect each other's conformational states (Vaknin and Berg, 2007). The free energy of a given receptor in a particular state (q,l,a,m) can be written as
where μq=ln(KqI/[L]q) and μq+EqL=ln(KqA/[L]q) are the chemical potentials of the inactive and active ligand-bound receptors, respectively, Eq,mM is the receptor methylation-dependent free energy contribution, and EqC is the coupling interaction strength between neighboring receptors. KqI and KqA are the dissociation constants for the inactive and active type-q receptors, and [L]q is the concentration of ligand that binds with type-q receptor. All energies in this paper are written in units of the thermal energy kBT.
The energy parameters μq, EqL, Eq,mM for individual receptors can have complicated dependence on the state variables q and m. For simplicity, we assume that chemical potential terms μq and EqL are constants for each type of ligand, independent of receptor methylation levels. We further assume methylation energy Eq,mM is linearly proportional to methylation level m (Shimizu et al, 2010):
where αq quantifies the energy change by adding one methyl group to a type-q receptor (αq<0), and mq,0 sets the average methylation level in the absence of any stimuli for a type-q receptor. By analogy to the Ising-type model used in describing collective behaviors in physical systems, such as ferromagnetism (Bozorth, 1993), the receptor–receptor coupling energy EqC is assumed to depend linearly on the activity of its neighbors:
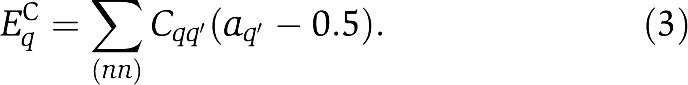 |
Equation (3) shows that activity of a receptor (a=0 or 1) in the cluster is influenced by its neighbors' activities with a coupling constant (strength) Cqq′. The overall coupling effect of a given receptor is obtained by summing over all its nn. In this paper, we assume symmetric coupling strength (Cqq′=Cq′q). We set Cqq′<0 to represent cooperative receptor–receptor interactions. The 0.5 in the formula is for preserving symmetry between active and inactive state. It does not affect the general behavior of the model.
For bacterial chemotaxis, the time scales for ligand binding and activity switching are much faster than that of receptor methylation/demethylation. Therefore, a given individual receptor is at quasi-equilibrium among its four (a, l) states: (0, 0), (0, 1), (1, 0) or (1, 1). The probabilities in these four states are given by the Boltzmann distribution function with their free energies given by Equation (1). The average ‘local’ activity of an individual type-q receptor depends on its methylation level m and is denoted as 〈a〉q,m. In the mean-field approximation, 〈a〉q,m can be taken as the mean activity of all type-q receptors with methylation level m in the cluster. The properties of the whole cooperative receptor cluster can be determined by direct Monte Carlo simulations (Supplementary Figure S8) or the mean-field-theory approximation (see Supplementary Information for detailed descriptions of these two methods). Both methods give consistent results. In particular, 〈a〉q,m and the population Pq,m of type-q receptors with methylation level m can be computed from our model. From 〈a〉q,m and P(q,m), we can obtain the average activity of type-q receptor 〈a〉q=∑mPq,m〈a〉q,m. The average global activity of the entire mixed receptor cluster can be described as 〈a〉q=∑qfq〈a〉q, where fq is the fraction of type-q receptor in the cluster (∑qfq=1). Note that the average in 〈a〉 is over all the receptors in the mixed cluster. Detailed equations and solutions are discussed in the Supplementary Information.
To complete the description of the pathway dynamics, we need to describe the (slow) adaptation process, characterized by the dynamics of receptor population in different methylation levels Pq,m. Previous studies have shown that the methylation process has to depend on the receptor activity in order to explain the observed accurate adaptation (Barkai and Leibler, 1997). However, the origin of the receptor activity dependence in methylation/demethylation kinetics remains unclear. One obvious way of receptor activity dependence comes from the fact that the methylesterase protein CheB is phosphorylated to its active form CheB-P (Djordjevic et al, 1998) by the histidine kinase CheA, which is controlled by the integrated global activity of all the chemoreceptors. However, accurate adaptation occurs even in the absence of CheB phosphorylation (Alon et al, 1999). A more subtle but perhaps more important way of receptor activity dependence comes from individual receptor's conformational changes (local activity), which can control the accessibility of its methylation sites and/or affinity of the enzymes to the receptor (Sims and Cohen, 2009; Sims et al, 2009). One focus of this paper is to understand and distinguish the general consequences of the local and global activity dependence in methylation/demthylation dynamics.
We can study the local and global activity dependence within a simple and general model framework by assuming that the methylation rate decreases with an effective receptor activity a and the demethylation rate increases with a, both in a linear manner. The effective receptor activity a can be either the ‘local’ single receptor activity 〈a〉q,m or the ‘global’ mixed receptor cluster activity 〈a〉. Thus, the dynamics of the receptor population Pq,m can be written as
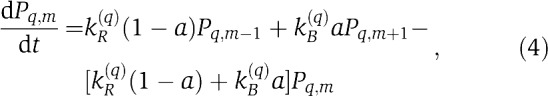 |
where kR(q) and kB(q) are rates of methylation and demethylation for receptor type-q and are set to be the same for Tar and Tsr: kR,B(q)=kR,B unless otherwise stated. Within this general modeling construct, different choices of the effective receptor activity a in the above equation correspond to different adaptation models: a=〈a〉q,m is the LA model and a=〈a〉 is the global adaptation (GA) model. The difference between these two adaptation schemes (models) is the focus of this paper. All the parameters used in this study (Equations (1, 2, 3, 4)) are summarized in Table I. The qualitative behavior of our models does not depend on the quantitative choices of the parameters (see Supplementary Figure S2 for results using another parameter set).
Table 1. Parameters used in the LA model.
| Item | Value or formula | Item | Value or formula |
|---|---|---|---|
| fq are chosen within the measured range of Tar/Tsr ratio (Kalinin et al, 2010); EqL are chosen to reflect the estimated Kd differences between active and inactive receptors binding with ligand (Mello et al, 2004; Mello and Tu, 2005); αq are from previous experimental measurements and estimates (Shimizu et al, 2010); mq,0 are estimated from our experiments shown in Figure 4C and D, E1,0M is set to be 3.75 to further suppress the activity of Tar for the m=0 state; CJ is designed to be symmetric, meanwhile provide high sensitivity (Mello and Tu, 2003b; Mello et al, 2004); kR(q) and kB(q) are set to be the same for Tar and Tsr receptors for convenience; all the energy parameters are in the unit of kBT, and the timescale is set by having kR(1)=1. | |||
| f 1 | 1/2 | f 2 | 1/2 |
| E 1 L | 8 | E 2 L | 3 |
| m 1,0 | 1 | m 2,0 | 2.5 |
| α1 | −1.875 | α2 | −1.0 |
| C 1,1 J | −5.5 | C 1,2 J | −6.0 |
| C 2,1 J | −6.0 | C 2,2 J | −6.0 |
| k R (1) | 1 | k B (1) | 2 |
| k R (2) | 1 | k B (2) | 2 |
| K I 1 | 18.1 μM | K I 2 | 6.0 μM |
Conceptually, the MWC-type models (Mello and Tu, 2005; Endres and Wingreen, 2006; Keymer et al, 2006) can be considered as a special case of the general Ising model with infinite coupling strength within (finite-sized) functional clusters. All the receptors within an MWC functional cluster (see Figure 1C) switch between their active and inactive states synchronously (‘all-or-none’), regardless of their types (Tar, Tsr) or methylation levels. As a result, the local activities of individual receptors are exactly the same as that of the whole cluster (〈a〉q,m=〈a〉). Therefore, in terms of adaptation, the methylation/demethylation process in an MWC-type model is effectively only determined by the global activity, the same as the GA model studied here.
Before studying the two simplified adaptation models (GA and LA), it should be noted that in wild-type E. coli cells, the activation (phosphorylation) of the demethylation enzyme CheB depends on the global activity of the receptor cluster. Thus, the global and local activities can combine in a complex ‘hybrid’ manner to affect the adaptation dynamics. However, including this detail in the demethylation dynamics does not change the general results and conclusions of this paper as long as LA effects exist (see Supplementary Information and Supplementary Figure S5 for details).
Adaptation dynamics for mixed receptor cluster: local adaptation prevents permanent methylation crosstalk
Using the local adaptation (LA) model described in the last section, we study and predict the adaptation dynamics of Tar and Tsr in a mixed cluster. As shown in Figure 2A, in response to a step increase of the chemo-attractant MeAsp, the activity of Tar is suppressed immediately by ligand binding. Owing to the heterogeneous receptor–receptor interactions (EC), the activity of Tsr in the mixed receptor cluster also decrease quickly. After the initial activity drop, the system starts to recover (adapt) by increasing the receptor methylation levels, which restores the receptor activities to their initial pre-stimulus levels. In the GA models (such as the MWC-type model), the methylation levels of both types of receptors increase monotonically to higher levels as they are both controlled by the (same) global kinase activity. However, in the LA model used here, only the average methylation level 〈m〉1 of Tar receptors, which directly bind the external ligand (MeAsp), increases monotonically and reaches a higher methylation level in the final adapted state (blue line in Figure 2B). The average methylation level 〈m〉2 of the Tsr receptors increases only transiently before returning back to its pre-stimulus level when the system reaches its adapted steady state (red line in Figure 2B). Thus the LA model predicts only transient methylation interference (crosstalk) but no permanent (steady state) methylation crosstalk. The activities of Tar and Tsr also show distinct behaviors. The average Tar activity 〈a〉1 shows a monotonic recovery to its pre-stimulus level (blue line in Figure 2A). The average Tsr activity 〈a〉2 shows a characteristic overshoot above its pre-stimulus level before returning back when the system adapts (red line in Figure 2A). Similar results are obtained in response to moderate amounts of serine, to which the system can adapt accurately.
Figure 2.

The adaptation dynamics of a mixed receptor cluster in response to addition of ligand. (A) Adding modest amount (180 μM) of MeAsp induces immediate activity drops for both Tar and Tsr receptors. Afterwards, Tar activity recovers monotonically (blue line), whereas Tsr activity (red line) first increases to a higher level (overshoot) and then returns back to its initial level. Black line is the averaged activity recovery trajectory of the entire heterogenous receptor cluster. (B) Tar and Tsr exhibit different methylation dynamics after MeAsp addition: Tar increases its methylation level monotonically to a higher level (blue line), whereas Tsr is first methylated then demethylated, and returns to its pre-stimulus state (red line). (C, D) The dynamics of the receptor populations in each methylation level for Tar and Tsr, respectively, after adding 1 mM MeAsp. (E) Schematic illustration of methylation dynamics after MeAsp addition under local (upper row) and global (bottom row) adaptation schemes. The blue color represents the Tar-related components and red color are the Tsr-related components. The water level inside each receptor represents activity of that particular receptor.
The transient dynamics of Tsr in the mixed cluster in response to MeAsp is an important prediction of the LA model and can be understood intuitively as follows. As Tsr does not bind to MeAsp (except for extremely high MeAsp level), the only driving force for Tsr methylation is its coupling to Tar, which makes Tsr activity dependent on the Tar activity. Therefore, even though the Tsr methylation level increases initially right after the MeAsp addition due to the initial Tar activity drop, it should recover to its pre-stimulus level as Tar adapts, and hence the driving force for Tsr methylation disappears. The initial rise of the Tsr methylation level, 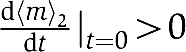 , and its final recovery 〈m〉2∣t=∞=〈m〉2∣t=0, imply that there exists a time point t* when the Tsr methylation level reaches its maximum:
|
For LA model, since 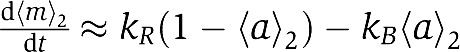 (see Equation (5) and corresponding descriptions), the first equation above shows that the Tsr activity crosses its steady-state value a0(2)=kR/(kR+kB) at time t*, and the inequality leads to d2〈m〉2/dt2=−(kR+kB) × d〈a〉2/dt<0 so that d〈a〉2/dt>0 at t*. Therefore, exactly when Tsr methylation level reaches its maximum level at time t*, the Tsr activity 〈a〉2 crosses its steady-state value with a positive changing rate, as it overshoots to a higher value before it finally recovers to 〈a〉0(2) in steady state. This explains the overshoot seen in Figure 2A (see Supplementary Figure S1A for more details).
Another interesting prediction from the LA model is that the averaged kinase activity does not always stay below the adapted value and recover monotonically as it would do in the global (MWC-type) adaptation model. If Tsr is more abundant than Tar and Tsr adapts slower than Tar, the transient nonmonotonic Tsr activity recovery dynamics in response to addition of aspartate or MeAsp (Figure 2A and Supplementary Figure S1A) can bring the overall kinase activity above its adapted level (i.e., an overshoot) before the system reaches its final steady state. For example, with the same energy and coupling strength parameters listed in Table I, but f1/f2=1:4 and kR(1)/kR(2)=2:1, the overall kinase activity undergoes a 10% overshoot in response to addition of 180 μM of MeAsp, as shown in Supplementary Figure S1B. This predicted behavior from the LA model is consistent with the overshoot in the transient response (in terms of the rotational bias of the flagellar motor) of E. coli to a large step chemotactic stimuli observed by Berg and Brown (1972). This agreement strongly supports the LA model. Our model also predicts that such overshoot will be absent without the mixed receptor cluster. This prediction may be tested in cells with only one type of chemoreceptors.
Theoretical modeling also allows us to study the detailed dynamics of receptor population Pq,m in each individual methylation state (m=0, 1,…, 4) and for different types of receptors (q=1, 2). When there is no MeAsp present, the Tar receptors mostly populate the low-methylation states (m=0, 1; see below and also Supplementary Figure S9 in Neumann et al, 2010). After adding 1 mM MeAsp, the Tar population shifts from low-methylation states to high-methylation states with monotonic decreases of P1,0 and P1,1, and monotonic increases of P1,2, P1,3 and P1,4 as shown in Figure 2C. However, for the Tsr receptors that do not bind MeAsp, methylation level distributions remain unchanged upon adaptation to MeAsp. Transiently, we observe a decrease-then-increase trend of the low-methylation state probabilities P2,0, P2,1 and P2,2 for Tsr, whereas the probabilities of the high-methylation states P2,3 and P2,4 show opposite transient behaviors due to the conservation of the total receptor population (Figure 2D). Similar changes in methylation level distribution for Tsr are observed when 1 mM serine is added (Supplementary Figure S1C and S1D). However, the adapted methylation levels of Tar receptors in response to 1 mM of serine have increased from their pre-stimulus levels (Supplementary Figure S1C). This permanent methylation crosstalk is related to the mixed receptor cluster's inability to maintain perfect adaptation to high concentrations of serine, which we will study next.
Methylation crosstalk and adaptation accuracy: imperfect adaptation leads to permanent methylation crosstalk
A receptor can adapt to a certain range of ligand concentrations by adjusting its methylation level (Mesibov et al, 1973; Mao et al, 2003). A mixed receptor cluster made of Tar and Tsr has the ability of adapting to both MeAsp and serine stimuli, but with different accuracies. Adaptation to MeAsp (or aspartate) is known to be relatively accurate (perfect) in a wide range of MeAsp concentrations, whereas the adaptation to serine is much less accurate, in other words, imperfect (Berg and Brown, 1972; Neumann et al, 2010). This is demonstrated in Figure 3, in which properties of the adapted (steady) state of the mixed receptor cluster are shown for different levels of MeAsp and serine. As can be easily seen from Figure 3A and B, for a high MeAsp concentration (e.g., 1 mM, ∼50 K1I), the activity can still adapt accurately and there is no permanent methylation crosstalk (see also Figure 2D). However, the same level of serine (1 mM, ∼200 K2I) leads to inaccurate adaptation (Figure 3C), and it also triggers methylation increase for the (non-binding) Tar receptors (Figure 3D, see also Supplementary Figure S1C); i.e, permanent methylation crosstalk. These observations suggest a close relationship between permanent methylation crosstalk and adaptation accuracy.
Figure 3.

The steady-state activities, receptor methylation levels and their relationship in different (MeAsp or serine) backgrounds. (A, B) Show the steady-state kinase activities and the receptor methylation levels for different background MeAsp levels. The system can adapt perfectly to very high concentrations of MeAsp (up to [L]1=102K1I). As the Tar methylation level approaches its maximum (boundary) value of 4, adaptation becomes inaccurate (labeled by the dotted line), and the Tsr methylation level starts to increase. (C, D) Show the steady-state kinase activities and the receptor methylation levels for different background serine levels. The perfect adaptation range for serine is much smaller than that for MeAsp, but the general relationship between kinase activity and receptor methylation still holds. As the adaptation becomes inaccurate (labeled by the dotted line), the Tar methylation level starts to increase. (E) Shows the relationship between permanent methylation crosstalk and adaptation accuracy. The blue line is calculated from panels A, B for MeAsp responses, and red line from panels C, D for serine response. The near-linear curves demonstrate strong correlation between permanent methylation crosstalk and adaptation error.
To directly demonstrate the correlation between permanent methylation crosstalk and adaptation accuracy, we plot the degree of methylation crosstalk Δm, defined as the permanent methylation level increase for the non-binding receptor, versus the adaptation error (Δa), defined as the steady-state cluster activity change, for different amounts of ligand additions (Figure 3E). With the parameter set used here (Table I), the correlations between Δm and Δa are nearly linear for both MeAsp (blue line) and serine (red line) addition, which confirms the strong dependence of permanent methylation crosstalk on adaptation accuracy. Changing model parameters only affects the dependence quantitatively, and the strong correlation between permanent methylation crosstalk and the adaptation accuracy exists for all parameter sets tested.
The causal relation between methylation crosstalk and adaptation accuracy can also be understood analytically from our model. For high ligand concentrations, the effect of ligand binding may not longer be balanced by the covalent modification (methylation) of its corresponding receptor; therefore, the system fails to adapt accurately. This permanent change in activity (imperfect adaptation) is felt by the other receptors in the mixed cluster through receptor–receptor interaction  , which depends on the activity. The changes in receptor–receptor interaction strength drive the methylation of the non-binding receptors and eventually leads to the permanent changes of their methylation levels, i.e., methylation crosstalk.
What causes inaccurate adaptation? We can answer this question by deriving the dynamical equation for the average methylation level 〈m〉q(≡∑m=04Pq,mm) by summing over the dynamical equations (Equation (4)) for receptor populations Pq,m in different methylation levels:
 |
The last two terms in the above equation represent the contributions from the boundary methylation values m=0 and 4. If the receptor population at these boundary methylation levels are small, i.e., Pq,0,Pq,4≪1, these boundary terms can be neglected from Equation (5), which will lead to 〈a〉0q=kR/(kR+kB) in steady state independent of ligand concentration, i.e., perfect adaptation. Otherwise, as first pointed out in Mello and Tu (2003a), these two ‘boundary terms’ are responsible for imperfect adaptation of the system. There are two factors causing imperfect adaptation: finite receptor population at the methylation boundaries (Pm=0≠0 or Pm=4≠0), and the existence of activity ‘gap’ at these methylation boundaries (defined as Δ〈a〉q,0≡〈a〉q,0 and Δ〈a〉q,4≡1−〈a〉q,4, see Supplementary Figure S6A and B for details). If the activity gaps are not closed, i.e., Δ〈a〉q,0≠0 or Δ〈a〉q,4≠0, CheB or CheR would still attempt to demethylating or methylating MCP receptors at the methylation boundaries (m=0) or (m=4) in order to achieve perfect adaptation. However, the finite range of receptor methylation levels (boundaries) prevent the proper enzymatic reaction from continuing. Therefore, the two boundary activity gaps affect the adaptation accuracy by controlling the catalytic deficiency at the two boundaries. As the receptor activity ‘gap’ is normally very small (Δ〈a〉q,0∼0) at m=0, the dominant contribution for imperfect adaptation comes from the receptor population at the highest methylation level m=4. The dynamics of the Tar and Tsr population distributions in different methylation levels after additions of 1 mM MeAsp is shown in Figure 2C and D. Even though adding 1 mM MeAsp brings Tar methylation levels up from m=0, 1, 2 to m=1, 2, 3, P1,4 is still small, so the system adapts to 1 mM MeAsp accurately and the steady-state distribution of Tsr methylation levels remain unchanged, i.e., no permanent methylation crosstalk as shown in Figure 2D. However, adding 1 mM serine shifts most of the Tsr population to the boundary level m=4 (Supplementary Figure S1D), which leads to imperfect adaptation and consequently a observable shift in Tar methylation population distribution toward higher methylation level (Supplementary Figure S1C).
Experimental measurements and comparison with theoretical predictions
To test the predictions from the LA model, we have measured the Tar and Tsr populations in different methylation states at different time points after addition of 1 mM of either MeAsp or serine. For experiments, we used E. coli strain RP2893 deleted for genomic copies of cheR and cheB and expressing CheR and CheBc, a constitutively active truncated version of CheB, from inducible plasmids. This setup enables us to focus on studying the adaptation control by the local activity while decoupling it from the known regulation of the global activity through CheB phosphorylation. Tar and Tsr receptors with different levels of glutamate methylation were separated using the effects of methylation or similarly neutralizing replacement of glutamate by glutamine on protein mobility on the SDS–PAGE gel (images shown in Figure 4A and B). Mobility of individual modification states was calibrated using samples prepared from cells expressing Tar or Tsr receptors with zero to four (for Tar) or five (for Tsr) glutamines in place of glutamates, as shown in the inset in Figure 4C. Thus, determined mobilities of individual methylation levels are shown as vertical lines in Figure 4C and D. Generally, Tsr mobility on the gel is lower and Tar mobility is higher, but there is also an overlap in mobilities of high-modified Tsr receptors and low-modified Tar receptors. Note that the peaks of methylated receptors do not migrate exactly at the same positions as the standards, presumably due to small differences between the effects of methylation and glutamine replacement and/or between modifications at different sites. The two shaded regions in Figure 4C and D mark the clearly distinguishable methylation levels for Tsr (left region, m=0−3) and Tar (right region, m=2−4). Figure 4C and D shows the detailed experimental results for the time dependence of the receptor methylation profiles (up to 600 s) after adding 1 mM of MeAsp (Figure 4C) and serine (Figure 4D). For MeAsp addition, the measured methylation level profile shows significant changes for Tar. In contrast, changes in the Tsr methylation are very subtle and only transient before relaxing to their original levels (Figure 4C). Although Tsr may directly bind MeAsp at very high concentrations (∼100 mM; Sourjik and Berg, 2002), no Tsr methylation was observed in the tar-strain stimulated by 1 mM MeAsp (data not shown), ruling out direct effect of MeAsp binding on Tsr methylation. Furthermore, the observed transient methylation crosstalk is not likely due to the direct nonspecific binding of MeAsp ligand to Tsr receptors, because the methylation crosstalk would otherwise be permanent after the system adapts. Distinctly, for addition of 1 mM serine, not only the methylation levels of the Tsr receptor increases (as seen by the drastic decrease in the low-methylation level population of Tsr), but the methylation level of the Tar receptor also increases (as seen by the increase in the high-methylation level populations of Tar, Figure 4D). Both of these observations are in agreement with the LA model and confirms the predicted connection between methylation crosstalk and adaptation accuracy. Again, no methylation of Tar receptor was observed in the tsr-strain stimulated by serine (data not shown), confirming that Tar methylation is due to crosstalk and not the direct binding of serine to Tar.
Figure 4.
Direct measurements of receptor methylation dynamics. (A, B) Mobility images of the Tar–Tsr two receptor system on the SDS–PAGE gel after addition of 1 mM MeAsp and serine, respectively. In the images, different columns show the results at specified time points after ligand addition: t=0 s (dark), t=30 s (red), t=60 s (orange), t=180 s (yellow), t=360 s (light blue) and t=600 s (blue). Results from pure Tar and pure Tsr receptors in fixed modification (amidation) states on the same gel are shown in the first two columns of each panel for calibration purpose. (C, D) Curves present relative mobility profiles of receptors on the SDS–PAGE gel measured from panels A, B, respectively: each colored curve corresponds to the column labeled with the same color. Receptors were detected using immunoblotting as described in Materials and methods. Because serine is rapidly metabolized, 1 mM serine was added every minute during incubation. The inset in panel C shows calibration profiles of mixtures of Tar (green) and Tsr (black) receptors. Numbers 0, 1, 2, 3 and 4+5 under the panel boxes (in black) show the positions of Tsr receptor with corresponding number of modifications, and numbers 0, 1, 2+3 and 4 above the panel boxes (in green) are the positions of Tar receptor with corresponding number of modifications. Source data is available for this figure at http://www.nature.com/msb.

Quantitatively, the measured methylation profiles can be analyzed by adding up the two shaded regions underneath each profile curve, corresponding to the non-overlapping methylation levels of Tar and Tsr, at each time point. In Figure 5, the Tsr population in low-methylation levels (m=1−3) and the Tar population in high-methylation levels (m=2−4) in response to 1 mM MeAsp (Figure 5A) and 1 mM serine (Figure 5B) are shown. The blues lines are predictions from the LA model. In response to the 1 mM MeAsp addition, the high-methylation population of Tar increases monotonically consistent with our theoretical prediction (blue line). Although the time trajectories for each individual methylation levels of Tsr are dynamic (see Figure 5C), their sum is rather flat in agreement with the LA model results (blue line). This is due to the fact that P2,3 changes in opposite trend with respect to P2,1 and P2,2 (as shown both in model prediction Figure 2D and in experiment Figure 5C), which neutralize the overall change of their sum. The unchanged overall methylation profile at t=600 s in comparison with that at t=0 indicates that there is no permanent methylation crosstalk between Tar and Tsr upon 1 mM MeAsp addition. For the response to 1 mM serine, Figure 5B shows a significant decrease of the low-methylation level population for Tsr as the Tsr receptors move to higher methylation level in response to serine binding. However, the high-methylation level populations for Tar also show a significant increase, indicating an increased Tar methylation level even though Tar does not bind serine directly. This observed methylation crosstalk in response to serine confirms the LA model prediction (Supplementary Figure S1C) and is caused by the inaccurate adaption to serine as explained earlier. Parameter set in Table I is used for the theoretical simulations without parameter fitting, although better quantitative agreement with experimental data can be achieved by decreasing the adaptation rate for Tar (see Supplementary information and Supplementary Figure S3).
Figure 5.

Quantitative comparisons of modeling predictions and experimental measurements. (A, B) Show the relative change of the population of a subset of receptor methylation levels (shadowed areas in Figure 4C and D) at different time points after addition of 1 mM MeAsp and serine. The black dots are for Tsr methylation level from 1 to 3, and the green dots are for Tar methylation levels from 2 to 4. Error bars show the standard deviations from different measurements. Solid blue lines are simulation results from the local adaptation model. (C) Shows the comparison of theoretical predictions and experimental observations of the dynamic of Tsr receptor populations in m=1, 2 and 3 states after addition of 1 mM MeAsp. The LA model predicts non-monotonic transient behaviors for P2,m, which always return back to the pre-stimulus level (solid blue lines). The LA model is confirmed by experiments (red dots). In comparison, the GA model leads to permanent changes of the Tsr population in different methylation levels (dotted blue lines), in clear disagreement with the experiments. The comparison indicates that the mixed receptor system adapts locally. The experimental values of P2,m are determined from the data in Figure 4C by local averaging (3 points) around the calibrated receptor methylation levels for m=1, 2, and 3. All receptor populations shown are normalized to their values at t=0.
Dynamics of the receptor populations for individual methylation levels in the non-overlapping regions of the gel can also be studied for the lower methylation levels of Tsr (m=1–3) and the higher methylation levels of Tar (m=2–4). The dynamics of Tsr lower methylation states in response to addition of 1 mM MeAsp are shown in Figure 5C, in which the red dots are from experimental measurement and the solid blue curves are from the LA model prediction, the methylation rate kR is set to be 5 × 10⁻³ s−1 for temporal comparison (better quantitative agreement can be achieved by requiring different methylation rates kR for Tar and Tsr in our model). The LA model agrees well with the experiments. The non-monotonic nature of the Tsr population dynamic in different methylation levels confirms the transient methylation crosstalk predicted by the LA model. In comparison, the GA model leads to permanent changes of the Tsr population in different methylation levels (dotted blue lines in Figure 5C) in response to MeAsp, in clear disagreement with the experiments. The dynamics of Tar populations in higher methylation levels from the LA model also agrees with the data (see Supplementary Figure S4).
Overall, the experimental measurements strongly support the LA model, in which individual receptor activity has an important role in regulating its own methylation level to achieve adaptation. Our experimental observation of a limited (transient) crosstalk is inconsistent with the purely GA models, in which methylation is solely controlled by the total activity of the mixed receptor cluster. It also disagrees with the recently proposed CheA–CheA interaction model by Goldman et al (2009) that predicts the absence of any (even transient) methylation crosstalk. Both the LA model and the experimental measurements show that when a mixed receptor cluster is exposed to a mixture of external chemostimuli, different types of receptors adapt to different methylation levels, depending on the composition of the mixed stimuli. This LA mechanism suggests that bacteria can distinguish and encode complex external ligand information through methylation levels of their corresponding receptors.
Discussion
The ability to adapt to complex environments is essential for organisms to survive (Adler and Tso, 1974). For the bacterial chemosensory system studied here, adaptation is carried out by a reversible receptor covalent modification (methylation/demethylation) process (Falke et al, 1997). The resulting methylation levels of the receptors encode a rudimentary memory of the environment encountered by the cell. In this paper, we proposed a local adaptation (LA) mechanism, in which the receptor adaptation is controlled by its own conformational changes. We showed that this local feedback mechanism allows the cell to adapt accurately to different stimuli in the presence of heterogeneous receptor–receptor interactions. This LA strategy avoids receptor methylation crosstalk, and thus enables the cell to record (remember) the concentrations of different stimuli distinctively using the methylation levels of the corresponding receptors. The LA mechanism is verified by direct experimental measurements of the methylation dynamics of different chemoreceptors Tar and Tsr in response to addition of MeAsp and serine.
For E. coli chemotaxis, the adaptation dynamics after a given environment change can be illustrated by the two-dimensional trajectories of the average Tar and Tsr methylation levels. For the LA model, as shown in Figure 6A, adding MeAsp leads to a methylation level trajectory that ends to the right of the starting point, whereas adding serine gives rise to a trajectory that ends above the starting point. When perfect adaptation is achieved, the methylation coordinate of the end point in the non-binding direction is the same as that of the starting point, indicating no permanent methylation crosstalk. However, when the trajectories approach the maximum methylation level (m=4), perfect adaptation fails, and the end (steady state) point has finite changes in both methylation coordinates even for additions of one single type of stimulus, indicating the start of methylation crosstalk. Contrarily, for the GA model, such as the MWC-type adaptation models, the methylation dynamics always follows the same trajectory independent of the details of the environment changes. As shown in Figure 6B, the end points only depend on an overall strength of the environment changes integrated over all stimuli, and the methylation level trajectories for different ligand perturbations all collapse onto a single line, indicative of severe permanent methylation crosstalk.
Figure 6.

The adaptation trajectories and the mapping from external chemical signal to internal memory. (A) The adaptation dynamics in response to additions of different stimuli, as represented by the (average) methylation level trajectories in the 2D plane spanned by (〈m〉1, 〈m〉2), are shown for the local adaptation model. Each line, started from the same original pre-stimulus state at the lower left corner, represents one trajectory after adding certain amount of ligand (labeled besides the end point of each curve). (B) The adaptation trajectories from the MWC-type model. Trajectories for different stimuli fall onto a single line in the (〈m〉1, 〈m〉2) plane. (C) The ligand concentration space ([L]1, [L]2) is organized by the constant adapted activity contour lines shown in the left panel; the corresponding (average) receptor methylation levels (〈m〉1, 〈m〉2) adapted to the external stimuli ([L]1, [L]2) can be determined from the local adaptation model and are shown in the right panel with the same color as the corresponding ligand concentrations. The mapping from the external stimuli ([L]1, [L]2) to the internal memory (〈m〉1, 〈m〉2) is unique (one-to-one) in the local adaptation model, and there is no loss of information. (D) In the MWC model, each constant kinase activity line in the ([L]1, [L]2) space, shown on the left, is mapped onto a single point in the methylation space, shown on the right. This represents a drastic reduction of information from external chemical signal to the internal memory.
The relevant information about the external chemical environment for an E. coli cell can be specified by the ligand concentrations ([L]1, [L]2) for MeAsp and serine, respectively. From the methylation trajectory analysis, it is clear that the LA mechanism encodes this information distinctively in the methylation levels of Tar and Tsr (〈m〉1, 〈m〉2) in a unique one-to-one manner without loss of information, as shown in Figure 6C. However, for the GA mechanism, the mapping from the chemical information to its intracellular record is not unique (many-to-one). In fact, as shown in Figure 6D, a whole line of different combinations of concentrations are mapped to a single point in the methylation space, representing a severe loss of information. In the following, we study the functional advantages of the LA mechanism that prevents permanent methylation crosstalk and avoids such information losses.
Local adaptation leads to high sensitivity in global activity response
The most important performance measure of a sensory system is its sensitivity to various external stimuli in different backgrounds. For E. coli chemotaxis, after the mixed receptor cluster reaches its steady state in a given ambient chemical background, the response to a sudden change of a stimulus concentration (Δ[L]) can be measured by the relative sensitivity: S≡([Δ]〈a〉/〈a〉/Δ[L]/[L]), where Δa is the immediate activity change before methylation/demethylation takes place and [L] is the ambient level of the ligand whose concentration has been changed. Here, we compare the sensitivities of the Ising-type GA and the LA models in different backgrounds of MeAsp and serine concentrations. In Figure 7A, we plot the sensitivity to MeAsp as a function of the background MeAsp concentration at different levels of serine background. Results show that higher levels of serine background do not change the shape of the sensitivity curve, but lower the overall sensitivity to MeAsp, likely caused by the cell's imperfect adaptation to serine. The serine sensitivity curves in different levels of MeAsp backgrounds, as shown in Figure 7B, have little or no dependence on the MeAsp backgrounds, as the cell can adapt to a wide range of MeAsp concentrations accurately. More systematic evaluations have been performed under all combinations of background MeAsp and serine concentrations, and the results are summarized in Supplementary Figure S7. For responses to all combinations of MeAsp and serine, the LA scheme for the Ising-type model always leads to a higher sensitivity than the global scheme (see also Supplementary Figure S7).
Figure 7.

Response sensitivity in different backgrounds and comparison with experiments. (A) The response sensitivities to MeAsp as functions of the background MeAsp level. Different panels are for different serine backgrounds. (B) The response sensitivities to serine as functions of the background serine level. Different panels are for different MeAsp backgrounds. (C, D) Show the dose–response curves for the LA (black) and GA (red) models at three different backgrounds shown by the dotted lines. The responses in three backgrounds ([L]0=30, 500 and 5000 μM MeAsp) are compared with the corresponding experimental measurements (Sourjik and Berg, 2002; diamond symbols) in (C). For comparison purpose, we subtracted background activity at saturate amount of MeAsp (C) or serine (D) and scaled the experimentally measured adapted activities to a0 in our model. The LA model shows excellent agreement with the experiments. Note that instead of plotting the response to the added concentration Δ[L] as done in Sourjik and Berg (2002), we have plotted the response against the final concentration [L]1=[L]0+Δ[L] so that the sensitivity can be directly determined from the slope of the response curve at [L]1=[L]0 (Mello and Tu, 2007). The results here indicate that for any given backgrounds, the LA model always leads to higher sensitivity than the GA model.
In a given background, the receptor methylation levels reach their steady-state values. The subsequent fast response to a sudden change of ligand concentration can be studied by fixing these methylation levels as they can only change slowly. The immediate activity responses as a function of the final level of ligand concentration (background plus added ligand concentrations) are shown in Figure 7C and D, for MeAsp and serine, respectively. The sensitivities are given by the slopes of the response curves at the positions of the adapted states represented by the dots in Figure 7C and D. The response curves for different adaptation schemes clearly show that the local scheme (black lines) always leads to steeper dose–response curves than the global scheme (red lines). In Figure 7C, the predicted dose–responses in three backgrounds (30, 500 and 5000 μM MeAsp) are compared directly with the corresponding experimental measurements (Sourjik and Berg, 2002; diamond symbols). The LA model shows excellent agreement with the experiments. The high sensitivity of the LA scheme can be understood intuitively as all the individual receptors are tuned (adapted) to their most sensitive operating point (Mello and Tu, 2007). Contrarily, the GA scheme only leads to a state with a fixed globally averaged activity with the individual receptors adapting to activities either higher or lower than their most sensitive operating points. The deviation of the individual receptors from their most sensitive regimes is responsible for the reduction in the overall sensitivity of the system. Note that the MWC model is different from the Ising-type GA model, and it can reproduce the kinase response data (Keymer et al, 2006; Mello and Tu, 2007) due to the effectively infinite receptor coupling strength (within a functional cluster) assumed in the MWC model. However, the MWC model, which automatically adopts the global scheme for the receptor methylation dynamics, would predict incorrect receptor methylation levels in the mixed receptor cluster.
Stability of the methylation dynamics
Although similar in their structures, Tar and Tsr receptors differ in their cytoplasmic regions, including the positions of their methyl-accepting sites. Therefore, even though both types of receptors share the same enzymes for methylation and demethylation reactions, the structural variance between them could lead to different catalytic efficiencies of these enzymes. In our model, this difference can be represented by different kR(q)/kB(q) ratios for Tar (q=1) and Tsr (q=2) receptors, which leads to different preferred steady-state activities a0(q)=kR(q)/(kR(q)+kB(q)) for the Tar and Tsr adaptation dynamics. In the LA model, this difference in preferred activities is allowed as each type of receptor can achieve its own preferred adapted activity separately. However, for the GA scheme, in which both the Tar and Tsr methylation dynamics are controlled by the same global activity a, different ratios kR(q)/kB(q) for Tar and Tsr can be a major problem as can be seen in the following simple linear equations for the Tar and Tsr methylation dynamics:
|
where q=1, 2 represents Tar and Tsr, respectively. There is no steady state solution for the above equations unless the two ratios of kinetic constants are exactly the same kR(1)/kB(1)=kR(2)/kB(2) for Tar and Tsr. If they are not the same kR(1)/kB(1)≠kR(2)/kB(2), the system becomes unstable (frustrated) and the methylation levels of Tar and Tsr will be driven to their extreme values at m=0 or 4, inconsistent with experimental observations. In comparison with the more flexible LA mechanism, the stringent requirement of the exact equality of the two kinetic constant ratios for different receptors makes the GA mechanism much less robust.
Local adaptation prevents the poisoning effect by methylation contamination
In environments with extremely high levels of a given stimulus, the cell can lose its ability to respond to further change of this particular stimulus. A natural question arises as to whether saturation of one type of stimulus can destroy the cell's sensitivity to other types of stimuli. Clustering of different types of chemoreceptors, which has an important role in signal amplification, could mediate methylation of one type of receptor in response to a ligand that binds with another type of receptor. Because a receptor loses its ability to sense concentration change at high-methylation levels (m>3), with a strong methylation crosstalk, the mixed receptor cluster could lose its sensitivity to all types of chemical stimuli when saturated by one type of ligand.
This detrimental ‘poisoning’ effect is particularly severe for the MWC-type GA models. Owing to the effectively infinite coupling strength between receptors within the finite functional cluster in the MWC-type models, the methylation levels of all types of receptors can reach their maximum in their concerted response to extremely high level of one type of stimulus. As a result, the non-binding receptors in the mixed cluster also reach high-methylation levels and therefore either lose the ability to sense any changes in their corresponding ligand (signal) or fail to recover their activity, and hence ability to respond. As shown in Figure 8A–C for the MWC-type model, when two different types of ligands are added successively, the mixed receptor sensory system cannot respond to the second ligand addition when the first ligand is overdosed (Figure 8C).
Figure 8.

Response to successive stimuli of different signals with different strengths. At t=1 (time is in unit of kR−1), certain amount of serine ([L]2=10−1, 10, 103 K2I for the three cases (columns) shown) is added to the mixed receptor system, followed by the addition of MeAsp ([L]1=K1I) at t=11. (A–C) are activity adaptation curves from the MWC-type model, in which saturating amount of serine background, shown in (C), irreversibly inhibits the mixed receptor cluster and prohibits it from responding to further MeAsp addition (the poisoning effect). (D–F) Are activity adaptation curves from the local adaptation model, in which the system still respond to MeAsp partially even with large serine background. (G–I) Show the corresponding methylation level dynamics from the MWC model, and (J–L) show the methylation dynamics of the local adaptation model. (G–L) Clearly show that the local adaptation model limits the strength of methylation contamination, whereas severe methylation contamination exists in the MWC-type model. (M) Schematic illustration of methylation dynamics after adding saturating amount of serine under local adaptation model (upper row) and MWC-type model (bottom row). The blue color represents the Tar-related components and red color are the Tsr-related components. The water level inside each receptor represents activity of that particular receptor.
The situation is much improved for the LA scheme as shown in Figure 8D, E and F. In the LA model, the coupling strength (Cqq′) between receptors is finite, and each receptor undergoes separate adaptation dynamics. Therefore, when one type of ligand is overdosed, the corresponding receptor loses its ability for sensing further change of that type of ligand (red lines in Figure 8D, E and F). However, even though methylation crosstalk does occur in the LA model as the system fails to adapt, the finite coupling strength limits the degree of methylation contamination, and acts as a fire-wall to keep other types of receptors from being driven to their highest methylation levels. As a result, the mixed receptor cluster is still capable (albeit to a less degree) of sensing changes of other stimuli (blue lines in Figure 8D, E and F).
Figure 8 also shows the corresponding methylation trajectories upon successive ligand additions for the MWC (Figure 8G, H and I) and the LA models (Figure 8J, K and L). Not surprisingly, methylation contamination is severe for the MWC model. For the LA model, however, the finite coupling interaction and the LA mechanism work together to limit the degree of methylation contamination and protect the entire sensory machinery from being totally destroyed by overdosing of one single type of ligand.
In summary, highly cooperative interactions between sensors (receptors) within a mixed sensor network can amplify small signals and are directly responsible for high response sensitivity. What we have shown here is that allowing individual sensors in the network to adapt according to its own (local) activity is crucial in maintaining the responsiveness of the system in environments with multiple signals. Both the modeling work and the experimental measurements of the methylation dynamics confirm that this local-activity-dependent adaptation strategy is used in E. coli chemotaxis. Microscopically, certain conformational changes of the chemoreceptors control the activity of the attached histidine kinase. Our study confirms that the same receptor conformational changes also affect the receptor's methylation/demethylation kinetics. This LA scheme prevents methylation crosstalk and enables the cell to differentiate different signals by the methylation levels of the corresponding receptors. This LA process tunes each individual sensor to its most sensitive operating point and thus maintains the high sensitivity of the entire cluster. The absence of methylation crosstalk shows that the receptors in a functional cluster do not work in a all-or-none manner. Instead, the receptor interactions within a mixed cluster can be best described by a Ising-type model with nn interactions. The finite interaction strength between neighboring sensors in a Ising model can also prevent the total disfunction of one type of receptor by the saturation of another type of receptors.
Materials and methods
All strains used in this study are listed in Supplementary Table S1. Methylation experiments were performed in E. coli strain RP2893 [Δ2206 (tap-cheZ)] expressing CheR from plasmid pVS113 and CheBc from plasmid pSB4. To calibrate mobility of different receptor modification states on the SDS–PAGE gel, receptors with a defined number of glutamate residues (E) replaced by glutamine (Q), which mimics methylated glutamate (Dunten and Koshland, 1991), were used. Tar standard was derived from strains VS144 (tsr TarEEEE), VS141 (tsr TarQEEE), VS148 (tsr TarQEQE), VS150 (tsr TarQEQQ) and SB1 (tsr TarQQQQ) that encode Tar mutants on the chromosome. Tsr standard was derived from strain VS164 (tar TsrQEQEE), and strain VS172 (tsr tar) that expressed Tsr from plasmids pVS362 (TsrEEEEE), pVS356 (TsrQEEEE), pVS361 (TsrQQQEE), pVS363 (TsrQQQQE) and pVS502 (TsrQQQQQ).
Cell growth and preparation
Strains were grown in tryptone broth (0.1%. tryptone and 0.5% NaCl) with added antibiotics (100 μg ml−1 ampicillin, 35 μg ml−1 chloramphenicol) and appropriate inducers. Overnight cultures, grown at 30°C, were diluted 1:100 and grown at 34°C and 275 r.p.m. to a final OD600 of 0.45–0.5. Cells were collected by centrifugation (4000 r.p.m., 10 min), washed and resuspended in tethering buffer (10 mM potassium phosphate, 0.1 mM EDTA, 1 μM L-methionine, 67 mM sodium chloride, 10 mM sodium lactate, pH 7). Cells were incubated for 1 h at 4°C to stop growth before methylation experiments.
Determination of optimal induction levels
Strain RP2847 [Δ2241(tap-cheB)] transformed with pVS113 and pSB4 was plated on soft agar plates (1% tryptone, 0.5% NaCl and 0.3% agar) containing varying levels of inducers, L-arabinose and isopropyl β-D-thiogalactoside. Wild type (RP437) and RP2847 transformed with empty vectors pTrc99a and pBAD33 served as positive and negative control on the same plate, respectively. The diameter of formed swarm rings was measured and served as basis for estimation of the optimal induction level, which was defined at 0.01% arabinose for CheR expression and 30 μg ml−1 isopropyl β-D-thiogalactoside for CheBc expression.
Methylation reaction
Cells were five times concentrated, poured into a small beaker and gently mixed at room temperature. Samples of 200 μl were taken before and 30, 60, 180, 360 and 600 s after addition of MeAsp or serine to a final concentration of 1 mM each. Because L-serine is metabolized, 1 mM serine had to be added every minute during incubation. Samples were mixed with 100 μl pre-heated (95°C) 3 × Laemmli buffer and either used immediately or stored at −80°C.
Immunoblotting
Methylation states of receptor populations were resolved on 8% SDS–PAGE gels with a running length of 35 cm. Neutralization of negatively charged glutamate residues through methylation causes enhanced SDS binding and an increased charge-mass-ratio of methylated receptors (Boyd and Simon, 1980). Proteins were transferred from gels onto nitrocellulose paper using a semidry transfer apparatus (Biometra, Fastblot B34 and B44) for 45 min. Membranes were hybridized with rabbit polyclonal anti-Tar antibody and fluorescently labeled secondary antibody (goat anti-rabbit IgG IRDye® 800 conjugate), both at a dilution of 1:5000. Detection was performed using LI-COR Odyssey® Infrared Imaging System, and intensity profiles were analyzed using ImageJ software, Version 1.34 l (W Rasband, National Institutes of Health, Bethesda, MD; http://rsb.info.nih.gov/ij). Data were subsequently processed using KaleidaGraph software, Version 3.6 (Synergy Software). Intensity profiles in individual lanes were measured within a stripe comprising all receptor methylation states. Intensity values were normalized to the integral fluorescence intensity of the distribution. The resulting profile was smoothed by using Smooth function of KaleidaGraph. Estimation of the relative change in receptor methylation with time was made by calculating the area corresponding to low- or high-methylation states.
Supplementary Material
Acknowledgments
We thank Gabi Schwarz for help with plasmid construction and Dr Hazelbauer and Dr Shimizu for helpful discussions. GL and YT were supported by the NIH grant (R01GM081747 to YT); SS and VS were supported by the Deutsche Forschungsgemeinschaft grant SO 421/3-3.
Author contributions: GL and YT developed the models and carried out the simulations; SS and VS designed and carried out the experiments; all analyzed the data, made comparisons with the model results, and wrote the paper.
Footnotes
The authors declare that they have no conflict of interest.
References
- Adler J (1976) The sensing of chemical by bacteria. Sci Am 302: 40–47 [DOI] [PubMed] [Google Scholar]
- Adler J, Tso WW (1974) Decision-making in bacteria: chemotactic response of Escherichia coli to conflicting stimuli. Science 184: 1292–2294 [DOI] [PubMed] [Google Scholar]
- Alon U, Surette MG, Barkai N, Leibler S (1999) Robustness in bacterial chemotaxis. Nature 397: 168–171 [DOI] [PubMed] [Google Scholar]
- Ames P, Studdert CA, Reiser RH, Parkinson JS (2002) Collaborative signaling by mixed chemoreceptor teams in Escherichia coli. Proc Natl Acad Sci USA 99: 7060–7065 [DOI] [PMC free article] [PubMed] [Google Scholar]
- Amin DN, Hazelbauer GL (2010) The chemoreceptor dimer is the unit of conformational coupling and transmembrane signaling. J Bacteriol 192: 1193. [DOI] [PMC free article] [PubMed] [Google Scholar]
- Antommattei FM, Munzner JB, Weis RM (2004) Ligand-specific activation of Escherichia coli chemoreceptor transmethylation. J Bacteriol 186: 7556–7563 [DOI] [PMC free article] [PubMed] [Google Scholar]
- Barkai N, Leibler S (1997) Robustness in simple biochemical networks. Nature 387: 913–917 [DOI] [PubMed] [Google Scholar]
- Berg HC, Brown DA (1972) Chemotaxis in E. coli analysed by three dimensional tracking. Nature 239: 500–504 [DOI] [PubMed] [Google Scholar]
- Berg HC, Tedesco PM (1975) Transient response to chemotactic stimuli in Escherichia coli. Proc Natl Acad Sci USA 72: 3235–3239 [DOI] [PMC free article] [PubMed] [Google Scholar]
- Bornhorst JA, Falke JJ (2000) Attractant regulation of the aspartate receptor-kinase complex: limited cooperative interactions between receptors and effects of the receptor modification state. Biochemistry 39: 9486–9493 [DOI] [PMC free article] [PubMed] [Google Scholar]
- Boyd A, Simon MI (1980) Multiple electrophoretic forms of methyl-accepting chemotaxis proteins generated by stimulus-elicited methylation in Escherichia coli. J Bacteriol 143: 809–815 [DOI] [PMC free article] [PubMed] [Google Scholar]
- Bozorth RM (1993) Ferromagnetism. Piscataway, NJ, USA: Wiley-IEEE Press [Google Scholar]
- Bray D, Duke T (2004) Conformational spread: the propagation of allosteric states in large multiprotein complexes. Annu Rev Biophys Biomol Struct 33: 53–73 [DOI] [PubMed] [Google Scholar]
- Bray D, Levin MD, Morton-Firth CJ (1998) Receptor clustering as a cellular mechanism to control sensitivity. Nature 393: 85–88 [DOI] [PubMed] [Google Scholar]
- Cluzel P, Surette M, Leibler S (2000) An ultrasensitive bacterial motor revealed by monitoring signaling proteins in single cells. Science 287: 1652–1655 [DOI] [PubMed] [Google Scholar]
- Djordjevic S, Goudreau PN, Xu Q, Stock AM, West AH (1998) Structural basis for methylesterase CheB regulation by a phosphorylation-activated domain. Proc Natl Acad Sci USA 95: 1381–1386 [DOI] [PMC free article] [PubMed] [Google Scholar]
- Dunten P, Koshland DE (1991) Tuning the responsiveness of a sensory receptor via covalent modification. J Biol Chem 266: 1491–1496 [PubMed] [Google Scholar]
- Duke TAJ, Bray D (1999) Heightened sensitivity of a lattice of membrane of receptors. Proc Natl Acad Sci USA 96: 10104–10108 [DOI] [PMC free article] [PubMed] [Google Scholar]
- Endres RG, Wingreen NS (2006) Precise adaptation in bacterial chemotaxis through ‘assistance neighborhoods’. Proc Natl Acad Sci USA 103: 13040–13044 [DOI] [PMC free article] [PubMed] [Google Scholar]
- Falke JJ, Bass RB, Butler SL, Chervitz SA, Danielson MA (1997) The two-component signaling pathway of bacterial chemotaxis: a molecular view of signal transduction by receptors, kinases, and adaptation enzymes. Annu Rev Cell Dev Biol 13: 457–512 [DOI] [PMC free article] [PubMed] [Google Scholar]
- Falke JJ, Hazelbauer GL (2001) Transmembrane signaling in bacterial chemoreceptors. Trends Biochem Sci 26: 257–265 [DOI] [PMC free article] [PubMed] [Google Scholar]
- Goldman JP, Levin MD, Bray D (2009) Signal amplification in a lattice of coupled protein kinases. Mol Biosyst 5: 1853–1859 [DOI] [PubMed] [Google Scholar]
- Grebe TW, Stock J (1998) Bacterial chemotaxis: the five sensors of a bacterium. Curr Biol 8: R154–R157 [DOI] [PubMed] [Google Scholar]
- Hazelbauer GL, Falke JJ, Parkinson JS (2008) Bacterial chemoreceptors: high-performance signaling in networked arrays. Trends Biochem Sci 33: 9–19 [DOI] [PMC free article] [PubMed] [Google Scholar]
- Hoch JA, Silhavy TJ (1995) Two-component signal transduction. Washington DC, USA: American Society for Microbiology [Google Scholar]
- Kalinin Y, Neumann S, Sourjik V, Wu M (2010) Responses of Escherichia coli bacteria to two opposing chemoattractant gradients depend on the chemoreceptor ratio. J Bacteriol 192: 1796–1800 [DOI] [PMC free article] [PubMed] [Google Scholar]
- Kentner D, Sourjik V (2009) Dynamic map of protein interactions in the Escherichia coli chemotaxis pathway. Mol Syst Biol 5: 238. [DOI] [PMC free article] [PubMed] [Google Scholar]
- Kentner D, Thiem S, Hildenbeutel M, Sourjik V (2006) Determinants of chemoreceptor cluster formation in Escherichia coli. Mol Microbiol 161: 407–417 [DOI] [PubMed] [Google Scholar]
- Keymer JE, Endres RG, Skoge M, Meir Y, Wingreen NS (2006) Chemosensing in Escherichia coli: two regimes of two-state receptors. Proc Natl Acad Sci USA 103: 1786–1791 [DOI] [PMC free article] [PubMed] [Google Scholar]
- Khursigara CM, Wu X, Zhang P, Lefman J, Subramaniam S (2008) Role of HAMP domains in chemotaxis signaling by bacterial chemoreceptors. Proc Natl Acad Sci USA 105: 16555–16560 [DOI] [PMC free article] [PubMed] [Google Scholar]
- Kim KK, Yokota H, Kim SH (1999) Four-helical-bundle structure of the cytoplasmic domain of a serine chemotaxis receptor. Nature 400: 787–792 [DOI] [PubMed] [Google Scholar]
- Laub MT, Goulian M (2007) Specificity in two-component signal transduction pathways. Annu Rev Genet 41: 121–145 [DOI] [PubMed] [Google Scholar]
- Li G, Weis RM (2000) Covalent modification regulates ligand binding to receptor complexes in the chemosensory system of Escherichia coli. Cell 100: 357–365 [DOI] [PubMed] [Google Scholar]
- Maddock JR, Shapiro L (1993) Polar location of the chemoreceptor complex in the Escherichia coli cell. Science 259: 1717–1723 [DOI] [PubMed] [Google Scholar]
- Mao H, Cremer PS, Manson MD (2003) A sensitive, versatile microfluidic assay for bacterial chemotaxis. Proc Natl Acad Sci USA 100: 5449–5454 [DOI] [PMC free article] [PubMed] [Google Scholar]
- Mello BA, Shaw L, Tu Y (2004) Effects of receptor interaction in bacterial chemotaxis. Biophys J 87: 1578–1595 [DOI] [PMC free article] [PubMed] [Google Scholar]
- Mello BA, Tu Y (2003a) Perfect and near-perfect adaptation in a model of bacterial chemotaxis. Biophys J 84: 2943–2956 [DOI] [PMC free article] [PubMed] [Google Scholar]
- Mello BA, Tu Y (2003b) Quantitative modeling of sensitivity in bacterial chemotaxis: the role of coupling among different chemoreceptor species. Proc Natl Acad Sci USA 100: 8223–8228 [DOI] [PMC free article] [PubMed] [Google Scholar]
- Mello BA, Tu Y (2005) An allosteric model for heterogeneous receptor complexes: understanding bacterial chemotaxis responses to multiple stimuli. Proc Natl Acad Sci USA 102: 17354–17359 [DOI] [PMC free article] [PubMed] [Google Scholar]
- Mello BA, Tu Y (2007) Effects of adaptation in maintaining high sensitivity over a wide range of backgrounds for Escherichia coli chemotaxis. Biophys J 92: 2329–2337 [DOI] [PMC free article] [PubMed] [Google Scholar]
- Mesibov R, Ordal GW, Adler J (1973) The range of attractant concentrations for bacterial chemotaxis and the threshold and size of response over this range: Weber law and related phenomena. J Gen Physiol 62: 203–223 [DOI] [PMC free article] [PubMed] [Google Scholar]
- Monod J, Wyman J, Changeux JP (1965) On the nature of allosteric transitions: a plausible model. J Mol Biol 12: 88–118 [DOI] [PubMed] [Google Scholar]
- Morton-Firth CJ, Shimizu TS, Bray D (1999) A free-energy-based stochastic simulation of the tar receptor complex. J Mol Biol 286: 1059–1074 [DOI] [PubMed] [Google Scholar]
- Neumann S, Hansen CH, Wingreen NS, Sourjik V (2010) Differences in signalling by directly and indirectly binding lignads in bacterial chemotaxis. EMBO J 29: 3484–3495 [DOI] [PMC free article] [PubMed] [Google Scholar]
- Sanders DA, Koshland DE (1988) Receptor interactions through phosphorylation and methylation pathways in bacterial chemotaxis. Proc Natl Acad Sci USA 85: 8425–8429 [DOI] [PMC free article] [PubMed] [Google Scholar]
- Shimizu TS, Aksenov SV, Bray D (2003) A spatially extended stochastic model of the bacterial chemotaxis signalling pathway. J Mol Biol 329: 291–309 [DOI] [PubMed] [Google Scholar]
- Shimizu TS, Tu Y, Berg HC (2010) A modular gradient-sensing network for chemotaxis in E. coli revealed by responses to time-varying stimuli. Mol Syst Biol 6: 382. [DOI] [PMC free article] [PubMed] [Google Scholar]
- Silverman M, Simon M (1977) Chemotaxis in Escherichia coli: methylation of che gene products. Proc Natl Acad Sci USA 74: 3317–3321 [DOI] [PMC free article] [PubMed] [Google Scholar]
- Sims JJ, Cohen RE (2009) Linkage-specific avidity defines the lysine 63-linked polyubiquitin-binding preference of rap80. Mol cell 33: 775–783 [DOI] [PMC free article] [PubMed] [Google Scholar]
- Sims JJ, Haririnia A, Dickinson BC, Fushman D, Cohen RE (2009) Avid interactions underlie the Lys63-linked polyubiquitin binding specificities observed for UBA domains. Nat Struct Mol Biol 16: 883–889 [DOI] [PMC free article] [PubMed] [Google Scholar]
- Sourjik V, Berg HC (2002) Receptor sensitivity in bacterial chemotaxis. Proc Natl Acad Sci USA 99: 123–127 [DOI] [PMC free article] [PubMed] [Google Scholar]
- Sourjik V, Berg HC (2004) Functional interactions between receptors in bacterial chemotaxi. Nature 428: 437–441 [DOI] [PubMed] [Google Scholar]
- Stock AM, Robinson VL, Goudreau PN (2000) Two-component signal transduction. Annu Rev Biochem 69: 183–215 [DOI] [PubMed] [Google Scholar]
- Studdert CA, Parkinson JS (2005) Insights into the organization and dynamics of bacterial chemoreceptor clusters through in vivo crosslinking studies. Proc Natl Acad Sci USA 102: 15623–15628 [DOI] [PMC free article] [PubMed] [Google Scholar]
- Vaknin A, Berg HC (2007) Physical responses of bacterial chemoreceptors. J Mol Biol 366: 1416–1423 [DOI] [PMC free article] [PubMed] [Google Scholar]
- Webre DJ, Wolanin PM, Stock JB (2003) Bacterial chemotaxis. Curr Biol 13: 47–49 [DOI] [PubMed] [Google Scholar]
- Yi TM, Huang Y, Simon MI, Doyle J (2000) Robust perfect adaptation in bacterial chemotaxis through integral feedback control. Proc Natl Acad Sci USA 97: 4649–4653 [DOI] [PMC free article] [PubMed] [Google Scholar]
Associated Data
This section collects any data citations, data availability statements, or supplementary materials included in this article.