Abstract
Efficient and accurate numerical techniques are used to examine similarities of effective diffusion in a void between random overlapping obstacles: essential invariance of effective diffusion coefficients (Deff) with respect to obstacle shapes and applicability of a two-parameter power law over nearly entire range of excluded volume fractions (ϕ), except for a small vicinity of a percolation threshold. It is shown that while neither of the properties is exact, deviations from them are remarkably small. This allows for quick estimation of void percolation thresholds and approximate reconstruction of Deff (ϕ) for obstacles of any given shape. In 3D, the similarities of effective diffusion yield a simple multiplication “rule” that provides a fast means of estimating Deff for a mixture of overlapping obstacles of different shapes with comparable sizes.
INTRODUCTION
In a recent study,1 we revisited a problem of determining effective properties of heterogeneous media in the context of molecular diffusion in living cells. Complex topology of space available for diffusion in cytoplasm was mimicked using an extended three-dimensional (3D) “Swiss-cheese” model2 in which obstacles corresponding to cellular structures, such as long thin cylinders (cytoskeleton), flat disks (endoplasmic reticulum), and spheres (small organelles), were randomly placed and allowed to overlap. This is similar to Boolean reconstruction of complex geometries developed over a decade ago for modeling spatial patterns in problems ranging from transport in porous media to mechanical (and other) properties of composite materials.3
Applying fast homogenization techniques,4 we performed numerical studies of various factors affecting molecular diffusion in complex environments. On scales for which the concept of effective diffusion is applicable,1 we have observed striking similarities. In particular, we found that effective diffusion of a molecule in the Swiss-cheese model is well approximated by a simple two-parameter power law. It should be noted that the law applies not to the actual effective diffusion coefficient, Deff, but rather to the modified diffusion coefficient, :
| (1) |
(Here and throughout the article, the effective diffusion coefficients are normalized by the diffusion coefficient for the space free of obstacles.) Parameters in Eq. 1, ϕc and α, correspond, respectively, to a zero-diffusion point (percolation threshold) and a slope of the curve in the dilute limit. Parameter α, scaled by the volume of an obstacle, is sometimes called “magnetic polarizability”5 in a mathematically equivalent problem of conductivity in presence of dielectric inclusions.4, 6 It is fully determined by the obstacle shape and can be obtained numerically for arbitrary shapes in a straightforward manner.1, 5 The physical meaning of α in the context of effective diffusion is discussed in more detail in Sec. 2.
Equation 1 was first proposed in mid-1980s by McLachlan7 as an “interpolation” between two versions of the effective medium theory,8 the self-consistent formulation, which predicts the existence of a percolation threshold but results in a linear dependence, and the differential effective medium theory that yields a power law with no percolation threshold (Archie's law9). McLachlan showed that Eq. 1 provided a good approximation for effective conductivities of many metal–insulator mixtures over a wide range of volume fractions.10 Consistently with his observations, we found that the function in Eq. 1 provided numerically accurate approximations for effective diffusion in the Swiss-cheese model in the interval > 10−3, both for individual shapes and mixtures of shapes. This interval corresponds to the nearly entire range of ϕ, except for the vicinity of a percolation threshold where the critical dependence, , with a universal scaling exponent μ is expected.11, 12
Another remarkable property of effective diffusion in the Swiss-cheese model, which we observed in our previous study, is the collapse of dependences for various obstacle shapes, after appropriate rescaling of obstacle volumes, to the curve for spheres. Thus, the effective diffusion in a complex 3D matrix of overlapping obstacles is essentially invariant with respect to obstacle shapes. Indeed, in the case of an ideal collapse, a given set of identical obstacles of a certain shape and volume v0, placed randomly with a number density n, could be equivalently replaced with a set of n spheres with an appropriate radius, such that for all volume densities V = nv0, V ∈ [0, Vc],
| (2) |
In Eq. 2, Vsphere = kV where the scaling coefficient . The percolation thresholds directly relate to through the identity ϕ = 1 − e−V.1, 13 A similar collapse was previously reported by Garboczi et al. for the 2D conductance in the presence of random overlapping dielectric inclusions of various shapes.13
In this study, the similarities of effective diffusion outside the critical region are re-examined with enhanced precision. In particular, we perform computations for spheroids whose exact values of α are known. Even though we are not concerned with the critical behavior of the system (the latter was recently studied for overlapping spheres12, 14 and for hard spheres and large-size tracers15), we did perform accurate computations of percolation thresholds because this allowed us to assess the accuracy of approximation 1 without resorting to fitting. Having accurate estimates of Vc also made it possible to verify the existence of a universal curve for diffusivities in two and three dimensions.
We have found that both properties are not exact but deviations from Eqs. 1, 2 are remarkably small. Thus for many practical purposes, such as estimation of effective diffusivities in the cytoplasm, they can be used as if they were exact. One consequence of these similarities is that dependences Deff (ϕ) can be approximated with reasonable accuracy based on the parameter α alone. Indeed, according to Eq. 1, two parameters, α and ϕc, are needed to approximate but both of them are influenced by the obstacle shape and are linked due to Eq. 2. Interestingly, the fact that both parameters in Eq. 1 depend on the obstacle shape is consistent with the findings of Arns et al.16 These authors used general principles of integral geometry to show that the precise description of effective properties of systems with geometries obtained via Boolean reconstruction requires, in addition to n and v0, two parameters that depend on the object's shape. The results of our study show that the number of necessary parameters can be reduced without significant loss of accuracy.
The slight imprecision of the properties described by Eqs. 1, 2 is in fact required for their coexistence. Indeed, Eq. 2 implies that must be a function of V/Vc. This is because for a given obstacle shape,
where and do not depend on the obstacle shape, and therefore Vc enters the function only in combination with V, V/Vc. On the other hand, fα,ϕc(ϕ) in Eq. 1 is obviously not a function of V/Vc. Thus, at least one of the equations is approximate. Because both properties hold with remarkable accuracy, there must be a function of V/Vc that would closely approximatefα,ϕc(ϕ). In 3D, the power function of the “Archie's law” type provides such approximation, leading to an approximate multiplication “rule” for mixtures of obstacles of different shapes with comparable polarizability. We also found that the harmonic average provides accurate estimates of percolation thresholds for these mixtures.
The article is organized as follows. Sections 2, 3 include analyses of effective diffusion for a matrix of identical obstacles whereas Sec. 4 presents results for mixtures of shapes. A brief review of results for the 2D Swiss-cheese model is given in Sec. 5, and the summary of the study is provided in Sec. 6.
SIMILARITIES OF EFFECTIVE DIFFUSION AND A SIMPLE APPROXIMATION FOR
A necessary condition for the existence of a universal curve provides a link between α and Vc. Specifically, the combination αVc must be the same for all obstacle shapes. Indeed, if Eq. 2 holds for any V, linearizing it in the dilute limit yields αV = αsphereVsphere, and the scaling coefficient k that connects equivalent volume densities in Eq. 2 is k = Vsphere/V = α/αsphere; on the other hand, at the percolation threshold, , and we arrive at
| (3) |
The constant in Eq. 3 can be evaluated using the parameters for spheres of which αsphere = 1.5 is exact17 and is an accurate numerical estimate;18 hence C = 5.255. Then the corresponding relationship between ϕc and α involves a natural small parameter e−C, (1 − ϕc)α = e−C = 0.00522.
The link between α and Vc described by Eq. 3 can be qualitatively understood by interpreting the polarizability v0α as the average volume of space, in and around the obstacle, that is largely inaccessible for a diffusive flux in the dilute limit [see Eqs. 5a, 5b and the discussion after Eq. 5b; averaging is done over all directions of the flux]. It is then intuitively clear that for the system to become impermeable for diffusive flow, each such space should overlap, on average, with at least one neighboring obstacle, ncv0α = αVc ∼ 1. This line of reasoning was first applied by Balberg and co-workers19, 20 in the context of “grain” percolation (conducting inclusions in the dielectric medium). They introduced a concept of “average excluded volume” 〈Vex〉, defined as the volume around the object into which the center of another object is not allowed to enter if the overlap of the two is to be avoided, and proposed the relationship nc〈Vex〉 = const. In Eq. 3, the average excluded volume is represented by the polarizability v0α, the parameter that can be computed for an arbitrary obstacle by a regular procedure described at the end of this section. The value of the constant C in Eq. 3 can be interpreted as the number of overlaps per obstacle required to reach the void percolation threshold; the 2D value of C is 2.3 (Sec. 5).
Equation 3 provides a means for assessing the accuracy of the collapse onto a universal curve. A simple test is to see whether it holds for shapes with precise values of α and ϕc. In this study we use spheroids with varying aspect ratios χ, for which exact values of α are known:17
where
For these shapes, we have also obtained accurate numerical values of ϕc by employing a method proposed in Ref. 21. In this method, a large number of obstacles (n ∼ 103–105) are randomly generated in a unit cube. Consistently with periodic boundary conditions used to compute (see below), the positions of obstacles at opposite boundary planes were made identical by duplication. The entire system is discretized using a small mesh size h, , thus reducing the problem to determination of the percolation threshold on the lattice. The latter is achieved by applying a “burning” algorithm where nodes on one side of the cube “are set on fire,” and the fire then propagates to the neighboring nodes until no more nodes are reachable. The system is deemed percolating if and only if the fire reaches the opposite side of the cube. The implementation details and error estimation are described in the Appendix. The procedure has been validated against the case of spheres (χ = 1), for which accurate estimates of ϕc were obtained previously by different algorithms.14, 18, 22
Our results for percolation thresholds are summarized in Table 1. The error of the ϕc values, δϕc, ranges from 10−4 to 7 × 10⁻⁴ (column 5 of Table 1). Given this precision, the differences in (1 − ϕc)α for varying χ (column 6 of Table 1) are significant. We therefore conclude that the collapse onto the curve for spheres, as described by Eq. 2, is not ideal. However, (1 − ϕc)α varies only modestly over a wide range of aspect ratios χ, and the corresponding values of αVc fall in a narrow interval between 4.9 and 5.3 (Table 1).
Table 1.
Verification of existence of a universal curve.
| Aspect ratio, χ | Polarizability, α | Percolation threshold for V, Vc | Percolation threshold for ϕ, ϕc | Absolute error of ϕc, δϕc | (1−ϕc)α | αVc |
|---|---|---|---|---|---|---|
| 4 | 1.600 | 3.281 | 0.9624a | 0.0007a | 0.00525 | 5.25 |
| 1 | 1.5 | 3.503 | 0.9699 | 0.0001 | 0.00522 | 5.254 |
| 1/4 | 1.907 | 2.643 | 0.9289 | 0.0002 | 0.00646 | 5.041 |
| 1/8 | 2.699 | 1.823 | 0.8385 | 0.0004 | 0.00729 | 4.922 |
| 1/16 | 4.365 | 1.125 | 0.6752 | 0.0005 | 0.00737 | 4.91 |
| 1/32 | 7.744 | 0.6333 | 0.4692 | 0.0007 | 0.00741 | 4.905 |
The data were kindly provided by Yi (Ref. 21).
Thus, the approximate equality
| (4) |
will provide a fairly accurate estimate of a percolation threshold for an arbitrary obstacle shape. Equation 4 is structurally similar to the formula for the grain percolation thresholds proposed by Balberg,23 ϕc = 1 − exp ( − Bc/(〈Vex〉/v0)), where Bc is the critical number of overlaps per object required for percolation; the value of Bc was found to vary between 0.7 and 2.8 depending on shape and orientation of objects.
The small variations of αVc do not necessarily guarantee that deviations from Eq. 2 at the intermediate values of V will be small as well. To examine the collapse onto a single curve over the entire range of V, we performed direct computations of using a fast method based on the homogenization analysis.1 The method approximates a disordered medium by a periodic one, in which a large number of obstacles are randomly generated in a basic cubic unit ω. Let ω1 denote the free space inside ω. The transformed effective diffusion coefficient is then computed as
| (5a) |
where the auxiliary functions wi(x) (i = 1, 2, 3) satisfy the equation,
| (5b) |
In Eq. 5b, which is solved in ω with periodic boundary conditions,4 and ei (i = 1, 2, 3) are the orts colinear with the edges of ω. Note that Eq. 5b is formally equivalent to the equation describing the distribution of polarization density induced by the constant external field. For our case, a qualitative interpretation of the “polarization density” vector ∇wi(x) is that the diffusive flow is effectively unable to penetrate the space around obstacles where |∇wi(x)| is large. Equation 5b was solved numerically using VIRTUAL CELL (vcell.org).24 Comparing to our previous study, the accuracy of the solution was enhanced by increasing the number of grid points to 5673 and by using obstacles with a smooth shape (details about the method and error estimates are given in the Appendix).
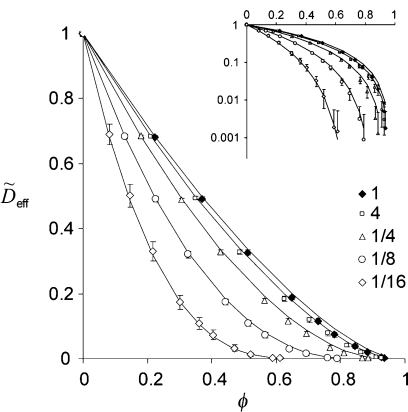
The effective diffusion coefficients were computed for the matrix of random overlapping spheroids with the following aspect ratios: χ = 4, 1, 1/4, 1/8, and 1/16 (Fig. 1). The computations were performed for a number of “levels.” For each of those levels, volume densities of obstacles of different shapes V were picked in the inverse proportion to the corresponding values of α, so that the computations would yield same values of , should Eq. 2 be exact. The results for different shapes were indeed close at each level, with differences typically in the third digit after the decimal point, often within the limits of computational error. A nearly ideal collapse of the data onto the curve for spheres is obtained upon rescaling of volume densities, V → αV/αsphere [Fig. 1(b)]. Still, small systematic deviations of from the values predicted by Eq. 2 can be discerned as the obstacles become more oblate, particularly in the range of small [see inset in Fig. 1(a)].
Figure 1.
(a) Values of obtained for spheroids with aspect ratios χ = 1, 4, 1/4, 1/8, and 1/16 by homogenization method, plotted as functions of obstacle volume density, V. The number of obstacles used in the computations is n = 2560. Dashed lines indicate average values. Inset: a semilog plot of the same data. The error bars are not shown if they are comparable to symbol sizes. (b) Collapse of for spheroids onto for spheres under rescaling of volume densities V → αV/αsphere.
Having precise values of α and ϕc also make it possible to evaluate the accuracy of the power-law approximation of Eq. 1 without fitting. Figure 2 demonstrates that the power function fα,ϕc(ϕ) of Eq. 1 provides a reasonably good approximation for (the values of are the same as in Fig. 1 but plotted as functions of ϕ). The differences in this case are greater than, but still comparable to, computational errors and do not exceed 0.02 (Table 2).
Figure 2.
The data of Fig. 1 plotted vs excluded volume fractions, ϕ. Solid lines are graphs of fα,ϕc(ϕ)=(1−ϕ∕ϕc)αϕc with the corresponding values of α and ϕc. The error bars are not shown if they are comparable to symbol sizes. Inset: a semilog plot of the same data.
Table 2.
Deviation of from fα,ϕc(ϕ), Eq. (1), for spheres (α = 1.5, ϕc = 0.9699).
| Excluded volume fraction, ϕ | Transformed effective diffusivity, | Deviation of from Eq. 1, | Absolute error of , | Relative error of , | Relative deviation of from Eq. 1, |
|---|---|---|---|---|---|
| 0 | 1 | 0 | 0 | 0 | 0 |
| 0.2227 | 0.6817877 | 0.0025 | 0.0037 | 0.00543 | 0.00367 |
| 0.3692 | 0.4915673 | 0.0065 | 0.0054 | 0.01099 | 0.01322 |
| 0.5106 | 0.3267252 | 0.01034 | 0.0068 | 0.02081 | 0.03165 |
| 0.6484 | 0.1876078 | 0.013 | 0.0083 | 0.04424 | 0.06939 |
| 0.7304 | 0.1158310 | 0.0149 | 0.0076 | 0.06561 | 0.12863 |
| 0.7804 | 0.0740143 | 0.019 | 0.0077 | 0.10403 | 0.25671 |
| 0.8441 | 0.0394638 | 0.0118 | 0.0066 | 0.16724 | 0.29901 |
| 0.8841 | 0.0193188 | 0.01 | 0.0051 | 0.26399 | 0.51763 |
| 0.92792 | 0.0049364 | 0.0055 | 0.0036 | 0.72927 | 1.11417 |
| 0.9363 | 0.001777 | 0.0057 | 0.0036 | 2.02592 | 3.20771 |
The properties of effective diffusion described by Eqs. 1, 2 allow one to approximately reconstruct based on α alone. Given α, the percolation threshold ϕc can be estimated using Eq. 4, and then the entire curve can be approximated by the power function fα,ϕc(ϕ) of Eq. 1. Accurate numerical estimates of α for an obstacle of arbitrary shape can be obtained by computing for small excluded volume fractions, ϕ ≪ 1. For this, Eq. 5b is solved for a single obstacle placed at the center of a unit cube ω (note that the obstacle should be much smaller than ω). Once the auxiliary functions wi(x) corresponding to this arrangement are found, is obtained by evaluating the integral in Eq. 5a. Then .
“ARCHIE’S LAW”
The ideal collapse to a single curve of the dependences for individual obstacle shapes would imply that should be a function of V/Vc (Sec. 1). But the function fα,ϕc(Vc)(ϕ(V)) in Eq. 1 does not possess this property. This inconsistence, however, cannot be significant given that both Eqs. 1, 2 hold with remarkable accuracy, and therefore there should be functions of V/Vc that would be good approximations forfα,ϕc(ϕ). Here we show that in 3D, the power function of the “Archie's law” type,9, 20
| (6) |
is both a good approximation for fα,ϕc(ϕ) and, essentially, a function of V/Vc.
That gα(ϕ) is close to a function of V/Vc follows from the necessary condition for the existence of a universal curve, Eq. 3,
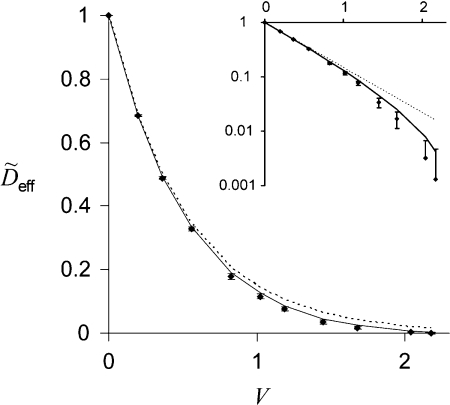
In 3D, Eq. 6 is also a good approximation for fα,ϕc(ϕ). This is due to the existence of the small parameter ε = e−C = 0.00522, which in turn follows from Eq. 3 and from the fact that there is at least one shape (sphere), for which ϕc is close to 1 (Sec. 2). Indeed, for prolate spheroids, α ranges from 3/2 to 5/3, and parameters εα ≡ 1 − ϕc(α) ≈ ε1/α = e−C/α are also small. Then the expansion of fα,ϕc(ϕ) in powers of εα yields fα,ϕc(ϕ)=gα(ϕ)+O(ɛα). More precisely, does not exceed 0.013. For oblate spheroids, α can be arbitrarily large and ϕc can be rather small. Nevertheless, gα(ϕ) remains a good approximation for fα,ϕc(ϕ), in part because it “misses” the zero-diffusion point by only gα(ϕc) = (1 − ϕc)α ≈ ε. This is illustrated by Fig. 3, where the data for oblate spheroids with χ = 1/8 (α = 2.699) are plotted against the corresponding fα,ϕc(ϕ) and gα(ϕ). Overall, Δ(α) is a monotone function bounded from above; it approaches 0.055 as α → ∞.
Figure 3.
Values of obtained for oblate spheroids with χ = 1/8 by homogenization method, plotted as a function of the obstacle volume density V. Solid and dashed curves are the plots of fα,ϕc(ϕ(V))=(1−ϕ(V)∕ϕc)αϕc and gα(ϕ(V)) = (1 − ϕ(V))α = e−αV, respectively; α = 2.699 and ϕc = 1 − exp ( − 5/α). The error bars are comparable to the symbol size. Inset: a semilog plot of the same data.
The “Archie's law,” can be derived from the differential effective medium theory.25 In this theory, an approximate equation describes how the effective diffusion coefficient would change after random addition of a small number of obstacles to an already existed macroscopically large system of the same obstacles. The idea is to replace the existed system of obstacles by a uniform “effective medium” with the diffusion coefficient , so that the added obstacles, corresponding to the infinitesimally small increase of volume density ΔV can be approximated by the equation in the dilute limit, , yielding . The assumption would be exact if the obstacles already present were much smaller than the added ones. But because all obstacles are the same, the substitution of the existed system with a continuum is an approximation. Note that the equation can be interpreted as a multiplication rule, , applied to the superposition of the macroscopic and infinitesimally small subsystems composed of identical obstacles. In Sec. 4, we show that in 3D, both “Archie's law” and the multiplication “rule” extend to superposition of macroscopic subsystems of obstacles of different shapes. However, in 2D these approximations become poor (see Sec. 5). This can be qualitatively understood by taking into account that in the dilute limit, the 2D single-obstacle “polarization density” |∇wi(x)| decays with distance from the obstacle an order of magnitude slower than in 3D. Therefore, multiobject correlations ignored in the equation of the effective medium theory are expected to be much stronger in 2D.
MIXTURES OF SHAPES
In living cells, diffusion of molecules is occluded by structures of different shapes, and therefore it is necessary to be able to compute parameters of effective diffusion for mixtures of shapes.
We first show that Eq. 3 also applies to the mixtures of obstacles of different shapes and comparable polarizability. Consider a mixture of obstacles of two shapes characterized by α1 and α2, and volume densities V1 and V2 (we assume that obstacles have comparable polarizability, α1v1 ∼ α2v2, to exclude possible size dependence18, 26). Percolation thresholds for several compositions of spheres (χ = 1) and oblate spheroids (χ = 1/32), (f1, f2) = {(1∕4, 3∕4),(1∕2,1∕2),(3∕ 4, 1∕4)}, obtained by the “burning” algorithm, are presented in Table 3. Because of the linear superposition in the dilute limit, values of αVc (column 5) were computed using
| (7) |
with f1 = V1/(V1 + V2), f2 = V2/(V1 + V2).
Table 3.
Percolation thresholds ϕc for mixtures of spheroids with aspect ratios χ1 = 1 and χ2 = 1/32.
| Phase fraction of spheres, f1 | Percolation threshold for V, Vc | Percolation threshold for ϕ, ϕc | Absolute error of ϕc, δϕc | αVc |
|---|---|---|---|---|
| 1 | 3.503 | 0.9699 | 0.0001 | 5.254 |
| 3/4 | 1.5878 | 0.7956 | 0.0007 | 4.86 |
| 1/2 | 1.0451 | 0.6483 | 0.0015 | 4.831 |
| 1/4 | 0.7837 | 0.5433 | 0.0012 | 4.846 |
| 0 | 0.6333 | 0.4692 | 0.0007 | 4.905 |
Given that the results for αVc are similar to those for the individual obstacle shapes (Table 1), we conclude that Eq. 3, αVc = C, approximately holds for the mixtures as well. Two corollaries follow from this fact for parameters of effective diffusion in mixtures of shapes.
Void percolation thresholds for mixtures of shapes: Harmonic averaging
Percolation thresholds for systems of objects of different shapes and sizes were studied extensively using continuous models of grain percolation20, 27 and lattice models of void percolation.28 Effects of polydispersity were also studied for the models of void percolation, both discrete28 and continuous.18, 26 Here we show that in the Swiss-cheese model, the void percolation thresholds of mixtures of shapes with comparable sizes, Vc, mix, are well described by the harmonic mean of the thresholds of the components. This immediately follows from Eq. 7 and from the fact that Eq. 3 holds for mixtures of shapes,
and
| (8) |
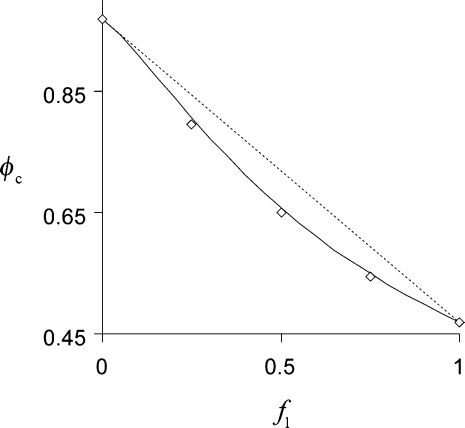
That the nonlinear relationship 8 provides an excellent approximation for percolation thresholds ϕc is illustrated in Fig. 4 where the corresponding concave curve is plotted against the data of Table 3 (column 3). If the percolation thresholds for the components, ϕc,1 and ϕc,2, are not very different, Eq. 8 becomes close to a linear function, ϕc = ϕc, 1f1 + ϕc, 2f2, used in Ref. 1 to interpolate data with only slight concavity. But as evident from Fig. 4, the nonlinear interpolation based on harmonic averaging is generally more accurate.
Figure 4.
Percolation thresholds ϕc for mixtures of spheres (χ1 = 1) and oblate spheroids (χ2 = 1/32), as a function of the phase fraction of spheres, f1 (diamonds). The error bars are smaller than the symbol size. The data, obtained using the “burning” algorithm, are well approximated by Eq. 8 (solid curve); the dashed line represents the linear function ϕc = ϕc, 1f1 + ϕc, 2(1 − f1).
Multiplication “rule”
Equation 1 also holds for mixtures of shapes,1 with α and ϕc determined from Eqs. 7, 8. But one can also use a simple multiplication “rule,” particularly convenient for analyzing experiments which probe effective diffusion by altering (or eliminating) certain components of the system (e.g., dissolving cytoskeletal filaments or varying the tracer size; the latter is equivalent to changing parameters of the filamentous subsystem alone1).
The “rule” follows from the fact that both Eqs. 1, 3 apply to mixtures of shapes. Then, based on the results of Sec. 3, Eq. 6 also provides a good approximation for the mixtures,
We therefore conclude that is approximated well by the product of diffusivities corresponding to the individual submatrices of identical obstacles,
where the total excluded volume fraction ϕ relates to the partial excluded volume fractions ϕ1 and ϕ2 as 1 − ϕ = (1 − ϕ1)(1 − ϕ2). Given this relationship, the same multiplication “rule” holds for the actual effective diffusion coefficients .
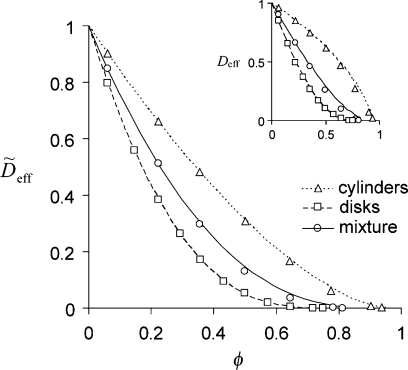
The accuracy of the multiplication “rule” is demonstrated by Fig. 5, where the values of the effective diffusion coefficient obtained by the homogenization method for a mixture of disks and cylinders are shown against the solid line representing the multiplication “rule”. The line is the plot of the function fα1,ϕc,1(ϕ1)×fα2,ϕc,2(ϕ2) where fα1,ϕc,1 and fα2,ϕc,2 are the power-law approximations for cylinders and disks with ϕ1=1−(1−ϕ)f1 and ϕ2=1−(1−ϕ)f2 (f1 and f2 are the phase fractions). Our numerical estimates indicate that the multiplication “rule” provides an accurate approximation with an absolute error less than 0.031.
Figure 5.
Multiplication “rule” for mixtures of shapes. Values of (and Deff, inset) for the mixture of cylinders (χ1 = 4) and disks (χ2 = 1/16) with phase fractions f1 = f2 = 0.5 (circles) and for disks only (squares) and cylinders only (triangles) are plotted against the corresponding power-law approximations fα1,ϕc,1(ϕ) and fα2,ϕc,2(ϕ) (dashed lines), with parameters α1 = 3.6, ϕc,1 = 0.74 and α2 = 1.64, ϕc,2 = 0.953 taken from Ref. 1, and the multiplication rule, fα1,ϕc,1(ϕ1)·fα2,ϕc,2(ϕ2) (solid line); ϕ1=1−(1−ϕ)f1,ϕ2=1−(1−ϕ)f2. Error bars were smaller than the symbol sizes.
SIMILARITIES OF EFFECTIVE DIFFUSION IN 2D
In this section, we examine similarities of effective diffusion in the 2D Swiss-cheese models. A mathematically equivalent problem of effective conductivity in presence of random overlapping dielectric inclusions of various shapes was studied numerically by Garboczi et al.13 They observed the collapse of the data obtained for individual obstacle shapes onto a single curve and found that for a number of different of shapes, αAc varied only slightly (Ac is the critical area density of inclusions, an analogue of Vc in 3D). Based on these observations, Garboczi et al. proposed a universal curve for the 2D conductivity, attributing differences of αAc to computational errors.
Since then, accurate values of Ac have been established for several shapes. In particular, for squares, ϕc = 0.6666(4) and Ac = 1.098(1) (Ref. 29) and for circles, ϕc = 0.6763475(6) and Ac = 1.128085(2).26 Given these values and the exact values of α, αcircle = 2 and αsquare = ,30 the necessary condition for the existence of the universal curve, αAc = const., is not fulfilled exactly. Indeed, with the error less than 10−4, (αAc)circle = 2.25617, whereas (αAc)square = 2.4031.
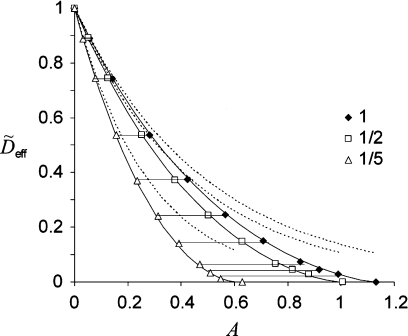
Independently, we have computed accurate values of the effective diffusion coefficients in the presence of elliptical obstacles with χ = 1, 1/2, and 1/5, using the same numerical techniques as for the 3D case. The results obtained for the area densities, such that , are presented in Fig. 6 where the data are plotted against the power function fα,ϕc(ϕ) of Eq. 1 with the exact values of α, α = (1/2)(χ + χ−1) + 1,31 and the accurate numerical values of ϕc (Table 4). Variations of the corresponding values of and the deviations from Eq. 1 were less than 0.01 but slightly greater than computational errors. Overall, as in 3D, the similarities of the effective diffusion in the 2D Swiss-cheese models are not exact but deviations from Eqs. 1, 2 are rather small.
Figure 6.
Effective diffusion in 2D. Effective diffusivities for ellipses with χ = 1, 1/2, and 1/5 obtained by homogenization method are plotted as a function of area density A and compared to fα,ϕc(ϕ(A))=(1−ϕ(A)∕ϕc)αϕc (solid curves) and gα(ϕ(A)) = (1 − ϕ(A))α = e−αA (dashed curves) with the corresponding values of α and ϕc from Table 4. The number of obstacles used in the computations is n = 40 000. Error bars are comparable to the symbol sizes.
Table 4.
Parameters α and ϕc for ellipses with different aspect ratios.
But unlike the 3D case, the similarities in 2D do not result in a multiplication rule for mixtures of shapes. This is because exponential functions e−αA (dashed curves in Fig. 6) provide a poor approximation in 2D, owing to the fact that is insufficiently small. However, given the coexistence of the two properties, there must be other functions of A/Ac that would approximate fα,ϕc(ϕ) well. As an example, the functions (1 − A/Ac)C, where C is the constant in the approximate equality αAc ≈ C = 2.3,26, 29, 32, 33 the 2D equivalent of Eq. 3, approximate the curves in Fig. 6 with errors ∼0.05.
CONCLUSIONS
Earlier studies of effective transport in a matrix of random overlapping obstacles revealed remarkable regularities. It has been shown that effective diffusion coefficients for various shapes of obstacles collapse to a single curve after appropriate rescaling of volume fractions. It has been also observed that a simple two-parameter power law provides an accurate description of effective diffusivities as functions of excluded volume fractions over nearly entire range of values, except for the critical region.
In this article, we re-examined these similarities with enhanced precision and found that while they are not exact, deviations from the equations describing them are small. This has important implications. In particular, the similarities of effective diffusion allow for simple estimation of void percolation thresholds for obstacles of any given shape and for fast reconstruction of Deff (ϕ) over nearly the entire range of excluded volume fractions [Eqs. 4, 1]. In fact, all that is needed is a single parameter, the slope of the curve in the dilute limit; the latter is fully determined by the obstacle shape and can be computed in a straightforward manner (Sec. 2).
The similarities hold for mixtures of shapes as well, leading to simple and accurate approximations. In particular, we found that the void percolation thresholds for the mixture are well approximated by the harmonic mean of the thresholds of components. And in 3D, the effective diffusion coefficient for the mixture can be estimated simply as a product of diffusion coefficients for the components. This multiplication “rule” can be conveniently applied for analyzing results of experiments which probe effective diffusion by altering (or eliminating) certain components of the system.
ACKNOWLEDGMENTS
We thank Daniil E. Barvitsky for his help with optimizing the “burning” algorithm. This work is supported by National Institutes of Health through Grant Nos. P41-RR13186, 1U54-RR022232, and 1U54-GM64346.
APPENDIX: METHODS AND ERROR ANALYSIS
Method of homogenization
Originally formulated for composites with periodic microstructures,34 homogenization is an asymptotic analysis that utilizes a small parameter, the ratio of “micro-” and “macro-” length scales, to obtain accurate effective characteristics of the medium.35 Consider a periodic arrangement of identical obstacles in a large rectangular box Ω with the free space Ω1 in it and ϕ = 1 − |Ω1|/|Ω|. The spatial periods a1, a2, and a3 in respective Cartesian directions are such that the ratio is small: ε ≪ 1. The diffusion coefficient, , oscillates with the same periods. Steady-state diffusive fluxes in Ω are found by solving the equation,
| (A1) |
for the tracer distribution uɛ(x), with Dirichlet boundary conditions maintaining mismatch of the tracer concentrations at the opposite sides of Ω in a certain Cartesian direction and with zero flux conditions at other sides of Ω and at the surfaces of the obstacles.
Because uɛ in Eq. A1 describes behavior of the tracer on two different spatial scales, it is convenient to think of it as a function of two variables: a “macroscopic” slow variable x and a “microscopic” fast variable y ≡ x/ε, so that uɛ is periodic with respect to y: uε(x) ≡ u(x, y) and ∂xuε(x) ≡ ∂xu(x, y) + ε−1∂yu(x, y). Since Dε(x) is also a periodic function with the same period, both Dε(x) ≡ D(x/ε) = D(y) and u(x, y) are periodic in y. A solution to Eq. A1 is then sought in the form of expansion,
where ui(x, y) are found from a cascade of equations obtained by substituting the expansion into Eq. A1 and collecting terms of the same order in ɛ. The result is that the first term of the expansion does not depend on y, u0(x, y) ≡ u0(x), thus representing the “homogenized” solution, , which satisfies a “macroscopic” diffusion equation with the effective diffusion coefficient (the latter is generally a tensor because periodic structures of asymmetric obstacles are anisotropic),
| (A2) |
where the function u′(x) = (1–ϕ) u0(x) is the “macroscopic” density, given that u0(x) is defined only in free space [as is uɛ(x)].6 The elements of ,
are expressed in terms of auxiliary periodic functions wi(y), which satisfy the equation
| (A3) |
in the unit cell Ω0 = (1, a1/ɛ) × (1, a2/ɛ) × (1, a3/ɛ). Equation A3 is to be solved with periodic boundary conditions (ei, i = 1, 2, 3, are the orts colinear with the edges of Ω0).
To extend the concept of homogenization to random structures, for which stochastic homogeneity is the analog of periodicity,4 a disordered medium is approximated with a periodic one, where the unit cell Ω0 includes sufficiently large number of randomly placed obstacles (its effect on the error of computing is described in Computation error of, below). In this case,
| (A4) |
Note that Eqs. A4, A3 are equivalent to Eqs. 5a, 5b, respectively.
Computation of percolation thresholds
The void percolation threshold ϕc for a system of random overlapping obstacles was obtained using the procedure proposed in Ref. 21, with slight modifications aimed at improving precision. In this method, a certain excluded volume fraction ϕ is achieved by randomly generating n obstacles of a particular size in a unit cube. The system is then discretized with a mesh size h, and the “burning” algorithm is applied to determine whether the resulting lattice percolates (see Sec. 2). For each set of n, h, and ϕ, the procedure was repeated multiple times to obtain the probability Pn,h(ϕ) of percolation in a fixed direction. The number of realizations, limited by computation cost per realization that scales as h−3, ranged from 500 to 2000.
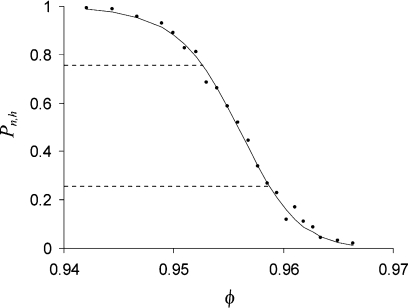
Figure 7 illustrates typical behavior of the percolation probability as a function of ϕ, for given n and h. Clearly, with n → ∞ and h → 0, Pn,h(ϕ) tends to a step function, . Let ϕp(n, h) be the solution of the equation Pn,h(ϕ) = p, for some p∈(0,1). Because for finite n and nonzero h, Pn,h(ϕ) is a continuous and monotone function, this solution exists, is unique, and for any p,.
Figure 7.
Percolation probability Pn,h (ϕ) computed for a system of n = 12 500 random spheres in a unit cube; the total number of nodes is 3133, the corresponding mesh size h = 1/312 = 0.0032. Each data point representing the probability of percolation in a fixed direction was obtained from 500 independent realizations. The curve is drawn for eye guidance only.
A particular choice of p becomes important for optimizing the convergence rate with respect to n and improving accuracy. Based on the results for lattice percolation models,36, 37 it is expected that there exists a limiting probability , independent of h. For periodic boundary conditions used in this study, the known value of π for lattice models is 0.573.37 We therefore use p = 0.573 because convergence is the fastest for this choice of p. Indeed, with defined as hn1/3,
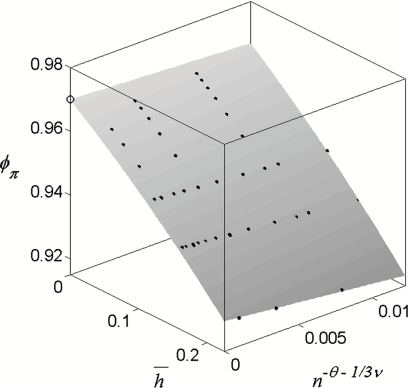
where ν = 0.8811, and, based on our data, θ ∼1/3. The values of were computed for a large set of points in the parameter space (, 1/n). Each value was obtained by linear interpolation of the data points with Pn,h in the interval (1/4, 3/4) (see Fig. 7), and the error was estimated using standard regression analysis. To determine ϕc, the values of were extrapolated to the point (0, 0) by fitting the data to the function, . A typical surface is shown in Fig. 8. The error of the obtained ϕc was estimated as maximum of the errors of all .
Figure 8.
Extrapolation of computed for spheres to the point (0, 0). The extrapolated value is shown as an empty circle.
Computation error of
Error of computing is determined mainly by truncation and statistical errors. The truncation error arises from spatial discretization of the computational domain with a finite mesh size h, which is required for solving Eq. 5b numerically. The statistical error is due to computing for particular random realizations of a system of n obstacles. In this study, was determined from a single realization as , where are effective diffusion coefficients in three orthogonal directions [diagonal elements of , Eq. A2]. Given the large number of obstacles used in the computations, n = 2560, this is equivalent to averaging over three independent random realizations. Yet another error is associated with the finite linear size of the sample. While the latter cannot be diminished by averaging over a large number of realizations because [E( …) stands for the mathematical expectation], it decreases with growing n more rapidly than the statistical error and therefore can be ignored.
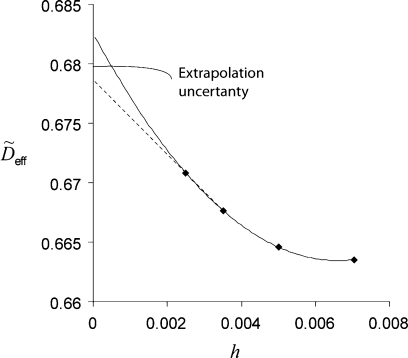
In our computations, the truncation error was O(h). To reduce it, was computed for several mesh sizes h1, h2, h3, … and the results were extrapolated to h = 0 using a least-square fitting to a quadratic polynomial. The accuracy of the procedure was estimated as the absolute difference between the quadratic and linear extrapolations (Fig. 9).
Figure 9.
Determination of the truncation error for computed as a difference between quadratic (solid curve) and linear (dashed line) extrapolations.
Estimation of the statistical error was based on the following observations. The standard deviations, computed as for varying volume densities V, albeit noisy, appeared to be essentially independent of obstacle shapes, in line with the fact that different shapes could be interchanged without affecting appreciably. This reduces the problem of accurate estimation of to that for spheres. The probability distribution of for spheres, inferred from a large number of realizations, was observed to follow closely the probability distribution of the excluded volume fractions ϕ. The standard deviation for the latter can be found analytically: σϕ ≈ n−1/2e−VV1.5(a0 + a1V), where a0 = , a1≈0.046. In fact, our results suggest that for spheres is well approximated by with the same a0 and a1. Then the approximate formula for obstacles of arbitrary shape can be obtained by taking into account that Vsphere = (α/αsphere)V, .
References
- Novak I. L., Kraikivski P., and Slepchenko B. M., Biophys. J. 97(3), 758 (2009). 10.1016/j.bpj.2009.05.036 [DOI] [PMC free article] [PubMed] [Google Scholar]
- Halperin B. I., Feng S., and Sen P. N., Phys. Rev. Lett. 54(22), 2391 (1985). 10.1103/PhysRevLett.54.2391 [DOI] [PubMed] [Google Scholar]
- Mecke K. R., Int. J. Mod. Phys. B 12(9), 861 (1998); 10.1142/S0217979298000491 [DOI] [Google Scholar]; Statistical Physics and Spatial Statistics—The Art of Analyzing and Modeling Spatial Structures and Pattern Formation, Lecture Notes in Physics, edited by Mecke K. R. and Stoyan D. (Springer, Berlin, 2000). [Google Scholar]
- Milton G. W., The Theory of Composites (Cambridge University Press, Cambridge, 2001). [Google Scholar]
- Douglas J. F. and Garboczi E. J., Adv. Chem. Phys. 91, 85 (1995). 10.1002/SERIES2007 [DOI] [Google Scholar]
- Lauffer M. A., Biophys. J. 1, 205 (1961). 10.1016/S0006-3495(61)86884-7 [DOI] [PMC free article] [PubMed] [Google Scholar]
- McLachlan D. S., J. Phys. C 18, 1891 (1985). 10.1088/0022-3719/18/9/022 [DOI] [Google Scholar]
- Bruggeman D. A. G., Ann. Phys. 24, 636 (1935). 10.1002/andp.19354160705 [DOI] [Google Scholar]
- Archie G. E., Trans. AIME 146, 54 (1942). [Google Scholar]
- McLachlan D. S., J. Phys. C 20, 865 (1987). 10.1088/0022-3719/20/7/004 [DOI] [Google Scholar]
- Stauffer D. and Aharony A., Introduction to Percolation Theory (Taylor & Francis, London, 1992). [Google Scholar]
- Hofling F., Munk T., Frey E., and Franosch T., J. Chem. Phys. 128(16), 164517 (2008). 10.1063/1.2901170 [DOI] [PubMed] [Google Scholar]
- Garboczi E. J., Thorpe M. F., DeVries M. S., and Day A. R., Phys. Rev. A 43(12), 6473 (1991). 10.1103/PhysRevA.43.6473 [DOI] [PubMed] [Google Scholar]
- Hofling F., Franosch T., and Frey E., Phys. Rev. Lett. 96(16), 165901 (2006). 10.1103/PhysRevLett.96.165901 [DOI] [PubMed] [Google Scholar]
- Sung B. J. and Yethiraj A., Phys. Rev. Lett. 96(22), 228103 (2006); 10.1103/PhysRevLett.96.228103 [DOI] [PubMed] [Google Scholar]; Sung B. J. and Yethiraj A., J. Chem. Phys. 128(5), 054702 (2008). 10.1063/1.2823735 [DOI] [PubMed] [Google Scholar]
- Arns C. H., Knackstedt M. A., and Mecke K. R., Phys. Rev. Lett. 91(21), 215506 (2003); 10.1103/PhysRevLett.91.215506 [DOI] [PubMed] [Google Scholar]; Arns C. H., Knackstedt M. A., and Mecke K. R., Phys. Rev. E Stat. Nonlinear Soft Matter Phys. 80(5 Pt 1), 051303 (2009). 10.1103/PhysRevE.80.051303 [DOI] [PubMed] [Google Scholar]
- Fricke H., Phys. Rev. 24, 575 (1924). 10.1103/PhysRev.24.575 [DOI] [Google Scholar]
- Rintoul M. D., Phys. Rev. E Stat. Nonlinear Soft Matter Phys. 62(1 Pt A), 68 (2000). 10.1103/PhysRevE.62.68 [DOI] [Google Scholar]
- Balberg I., Anderson C. H., Alexander S., and Wagner N., Phys. Rev. B 30(7), 3933 (1984). 10.1103/PhysRevB.30.3933 [DOI] [Google Scholar]
- Balberg I., Philos. Mag. B 56(6), 991 (1987). 10.1080/13642818708215336 [DOI] [Google Scholar]
- Yi Y. B., Phys. Rev. E Stat. Nonlinear Soft Matter Phys. 74(3 Pt 1), 031112 (2006). 10.1103/PhysRevE.74.031112 [DOI] [PubMed] [Google Scholar]
- Van Der Marck S. C., Phys. Rev. Lett. 77(9), 1785 (1996). 10.1103/PhysRevLett.77.1785 [DOI] [PubMed] [Google Scholar]
- Balberg I. I., Phys. Rev. B: Condens. Matter 33(5), 3618 (1986). 10.1103/PhysRevB.33.3618 [DOI] [PubMed] [Google Scholar]
- Slepchenko B. M. and Loew L. M., Int. Rev. Cell Mol. Biol. 283, 1 (2010). 10.1016/S1937-6448(10)83001-1 [DOI] [PMC free article] [PubMed] [Google Scholar]
- Brinkman H., J. Chem. Phys. 20, 571 (1952). 10.1063/1.1700493 [DOI] [Google Scholar]
- Quintanilla J. A. and Ziff R. M., Phys. Rev. E Stat. Nonlinear Soft Matter Phys. 76(5 Pt 1), 051115 (2007). 10.1103/PhysRevE.76.051115 [DOI] [PubMed] [Google Scholar]
- Mecke K. R. and Wagner H., J. Stat. Phys. 64, 843 (1991). 10.1007/BF01048319 [DOI] [Google Scholar]
- Mecke K. R. and Seyfried A., Europhys. Lett. 58, 28 (2002). 10.1209/epl/i2002-00601-y [DOI] [Google Scholar]
- Baker D. R., Paul G., Sreenivasan S., and Stanley H. E., Phys. Rev. E Stat. Nonlinear Soft Matter Phys. 66(4 Pt 2), 046136 (2002). 10.1103/PhysRevE.66.046136 [DOI] [PubMed] [Google Scholar]
- Thorpe M. F., R. Soc. Proc.: Math. Phys. Sci. 437(1899), 215 (1992). 10.1098/rspa.1992.0058 [DOI] [Google Scholar]
- Landauer R., Proceedings of the First Conference on the Electrical Transport and Optical Properties of Inhomogeneous Media (AIP, New York, 1978).
- Xia W. and Thorpe M. F., Phys. Rev. A 38(5), 2650 (1988). 10.1103/PhysRevA.38.2650 [DOI] [PubMed] [Google Scholar]
- Yi Y.-B. and Sastry A. M., Proc. R. Soc. London, Ser. A 460(2048), 2353 (2004). 10.1098/rspa.2004.1279 [DOI]
- Bensoussan A., Lions J. L., and Papanicolaou G., Asymptotic Analysis for Periodic Structures (Elsevier, North-Holland, Amsterdam, New York, 1978). [Google Scholar]
- Allaire G., SIAM J. Math. Anal. 23, 1482 (1992). 10.1137/0523084 [DOI] [Google Scholar]
- Gimel J. C., Nicolai T., and Durand D., J. Phys. A 32, L515 (1999); 10.1088/0305-4470/32/48/102 [DOI] [Google Scholar]; Stauffer D., Adler J., and Aharony A., J. Phys. A 27, L475 (1994). 10.1088/0305-4470/27/13/003 [DOI] [Google Scholar]
- Lorenz C. D. and Ziff R. M., J. Phys. A 31, 8147 (1998). 10.1088/0305-4470/31/40/009 [DOI] [Google Scholar]


