

Abstract
Water-protein interactions play a direct role in protein folding. The chain collapse that accompanies protein folding involves extrusion of water from the nonpolar core. For many proteins, including apomyoglobin (apoMb), hydrophobic interactions drive an initial collapse to an intermediate state before folding to the final structure. However, the debate continues as to whether the core of the collapsed intermediate state is hydrated and, if so, what the dynamic nature of this water is. A key challenge is that protein hydration dynamics is significantly heterogeneous, yet suitable experimental techniques for measuring hydration dynamics with site-specificity are lacking. Here, we introduce Overhauser dynamic nuclear polarization at 0.35 T via site-specific nitroxide spin labels as a unique tool to probe internal and surface protein hydration dynamics with site-specific resolution in the molten globular, native, and unfolded protein states. The 1H NMR signal enhancement of water carries information about the local dynamics of the solvent within ~10 Å of a spin label. EPR is used synergistically to gain insights on local polarity and mobility of the spin-labeled protein. Several buried and solvent-exposed sites of apoMb are examined, each bearing a covalently bound nitroxide spin label. We find that the hydrophobic core of the apoMb molten globule is hydrated with water bearing significant translational dynamics, only 4–6-fold slower than that of bulk water. The hydration dynamics of the native state is heterogeneous, while the acid-unfolded state bears fast-diffusing hydration water. This study provides a high-resolution glimpse at the folding-dependent nature of protein hydration dynamics.
Keywords: Protein Folding, Hydration Dynamics, Molten Globule, Dynamic Nuclear Polarization, Electron Paramagnetic Resonance
Introduction
It is appreciated that the hydrophobic effect is one of the dominant forces in protein folding1–4. However, the lack of experimental data regarding the location and dynamics of disordered water interacting with proteins, especially in nonnative states, has limited a quantitative assessment of the hydrophobic contributions to folding. Many proteins are known to fold via a rapid chain collapse, followed by a slower search for the native state5,6. The initial collapsed state is often identifiable as a discrete kinetic intermediate, and typically fits the description of a molten globule (MG), i.e., it is compact, highly dynamic and lacks a significant fraction of the native tertiary structure7,8. However, whether MG folding intermediates bear a hydrated or dry nonpolar core, and whether any core-associated water is dynamic or spatially confined are still subjects of debate3,9–14. Experimental evidence on the nature of water interacting with the protein core is sorely needed given the fundamental relevance of this problem to the molecular nature of the hydrophobic effect and the role of solvent-mediated internal friction15,16. More generally, hydration water—water whose dynamics is perturbed by the protein surface, typically extending up to 3 water layers—is increasingly recognized to play a direct role in protein dynamics17–20, thus regulating protein function, activity and binding events, in addition to folding21,22. There is much debate on the timescale, nature, and role of this water11,20,23–27, yet experimental reports lag behind theoretical findings or predictions3,18,19,28–30. To shed light on these questions, new techniques and experimental studies are needed.
The detection of hydration water poses significant challenges since its spectroscopic signature is largely indistinguishable from the orders of magnitude more populated bulk water. Additionally, the landscape of protein hydration dynamics is heterogeneous on the temporal as well as spatial scale18,24–26,29,31,32, requiring tools that can access hydration dynamics within well defined timescales of interest and with site-specific resolution. Despite the availability of a number of powerful techniques to study the dynamics of macromolecular hydration, including the nuclear Overhauser effect (NOE)33, 17O, 2H and 1H nuclear magnetic resonance relaxation dispersion9,34–37, neutron scattering techniques20,22,24,32,38–40, terahertz absorption spectroscopy41,42 and microwave dielectric spectroscopy11, only femtosecond fluorescence spectroscopy25,26,43,44 on tryptophan and NOE spectroscopic studies on a protein confined inside a reverse micelle45 has been reported to map out protein hydration dynamics with site-specificity.
This study introduces a novel experimental approach using Overhauser dynamic nuclear polarization (DNP) at 0.35 T to probe the dynamics of hydration water interacting with sperm whale apomyoglobin (apoMb) with site-specific resolution in the molten globule (MG, pH 4), native (N, pH 6.1) and acid-unfolded (U, pH 2.3) states. The Overhauser DNP approach overcomes the above mentioned challenges by selectively amplifying the 1H NMR signal of water within ~10 Å of protein residues labeled with nitroxide spin labels46. The size of the signal enhancement is sensitive to the timescale modulating the dipolar coupling between the unpaired electron spin and 1H nuclear spin of water47,48. Key advantages of this technique over other methods are the unambiguous assignment of the enhanced NMR signal to hydration water, high sensitivity that enables the study of dilute protein solutions (~100 μM and μl volumes), and the ability to probe core, interfacial or surface protein sites of interest. Given that the same nitroxide spin label is employed for DNP and electron paramagnetic resonance (EPR), these techniques are used synergistically here, with DNP reporting on hydration dynamics and EPR on protein flexibility and local polarity.
ApoMb offers a unique chance to study the role of hydration water in partially folded species as it populates a stable equilibrium MG intermediate at ~ pH 4.1. This species shares a number of key structural features with the apoMb kinetic folding intermediate populated at pH 6, including the MG character9,49–52. Several studies have addressed the hydration dynamics of apoMb9,11,25,26,53, but only two with site-specific resolution25,26 and none focused on the buried protein core. Fig. 1 illustrates the backbone structure of sperm whale Mb derived from x-ray data54 and the sites chosen for site-directed spin labeling (SDSL) with the nitroxide spin label R1 (inset Fig. 1) through a cysteine point mutation55. The three sites buried from the solvent, M131, F138 and I142, belong to the H-helix and participate in the ABGH structural core populated in both the kinetic and equilibrium folding intermediates49,56,57. In addition, M131 is among the most protected sites from hydrogen/deuterium exchange58,59 in the N state, and is known to be involved in nonspecific nonpolar interactions in the equilibrium MG60. Two surface sites, E41 (C-helix) and V66 (E-helix), were chosen as probes of the protein exterior.
Figure 1.
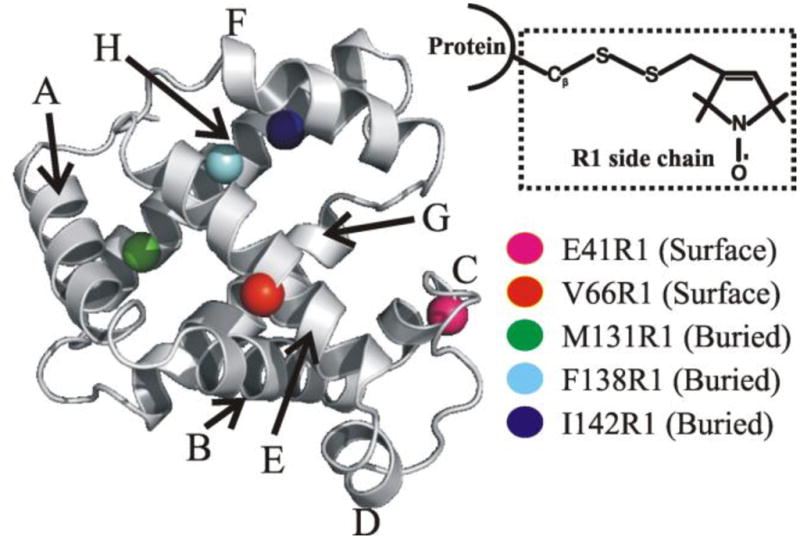
Structure of sperm whale myoglobin (PDB: 2mbw54; the heme prosthetic group is omitted for clarity). The eight α-helices are labeled and the five sites analyzed in this work are highlighted. The inset shows the R1 spin label generated via reaction of a methanethiosulfonate reagent with a cysteine side chain thiol. Image created with PyMOL (version 0.99; DeLano Scientific, San Carlos, CA).
Our study finds that the hydration dynamics of native apoMb is very heterogeneous, with the solvent-exposed sites displaying fast water dynamics and the interior sites behaving as a dry core. In contrast, the equilibrium molten globule has a wet core lubricated with hydration water whose dynamics is intermediate between that of the native and acid-unfolded states.
Materials and Methods
Protein expression, purification and characterization
A modified pET-17b vector (Novagen, Madison, WI) carrying the gene for wild type sperm whale myoglobin was a generous gift from Steven Boxer (Stanford University, CA). Five mutagenic plasmid DNAs, each carrying one of the apoMb cysteine point mutations E41C, V66C, M131C, F138C and I142C were generated via the QuickChange kit (Stratagene, La Jolla, CA), as previously described55. Each plasmid was transformed into E. coli BL21 DE3 cells (Novagen, Madison, WI). In vivo protein expression was carried out in LB medium at 37 and 42°C. ApoMb overexpression was induced upon addition of isopropyl-β-D-thiogalac (1 mM) at OD600 = 0.8. Cells were harvested at OD600 ≈ 1.8. Cell lysis, inclusion body resuspension and HPLC purification were performed according to published procedures61,62. Protein purity and identity were assessed by reverse phase analytical HPLC and either electrospray ionization or MALDI mass spectrometry.
Generation of nitroxide-labeled apoMb
Lyophilized apoMb was solubilized in 6 M urea and 10 mM sodium acetate at pH 6.1 for 30 min at 4°C. For mutants carrying surface Cys (E41C and V66C), the solubilized protein was diluted seven-fold in 10 mM sodium acetate at pH 6.1. A 10-fold molar excess of 1-oxyl-2,2,5,5-tetramethyl-Δ3-pyrroline-3-methyl methanethiosulfonate (MTSL; Toronto Research Chemicals, North York, Ontario) was added under gentle stirring at 4°C. For mutants carrying buried Cys, (M131C, F138C and I142C) the solubilized protein was diluted 2.1-fold with 10 mM sodium acetate at pH 6.1 to a final 2.8 M urea concentration before rapid addition of a 10-fold molar excess of MTSL under stirring at 4°C. Both reactions were allowed to proceed for 18 hrs at 4°C. The reaction mixture for the mutants carrying the buried Cys was diluted 3.3-fold with 10 mM sodium acetate at pH 6.1 and incubated for 30 min at 4°C under gentle stirring, to promote refolding. After the above treatment, each protein solution was dialyzed extensively against 10 mM sodium acetate at pH 6.1 at 4°C to eliminate urea and excess MTSL. Spin-labeled protein solutions were concentrated with an Amicon Ultra device (3,000 MWCO; Millipore, Billerica, MA) and flash-frozen in separate aliquots. Protein concentrations were assessed by absorption spectroscopy (ε280 = 15,200 cm−1M−1). Labeling efficiencies were assessed by reverse phase analytical HPLC on a C18 column (Grace, Deerfield). Labeling efficiencies for the DNP and CD samples were as follows: E41R1 and V66R1 >95%; M131R1, F138R1 and I142R1 61–90%. Successful apoMb spin labeling was confirmed by electrospray ionization or MALDI mass spectrometry and electron spin resonance.
Far-UV circular dichroism (CD)
Far-UV CD experiments were carried out at equilibrium on 10–15 μM protein samples. Data were collected with a MOS-450 spectropolarimeter (Bio-Logic Science Instruments, Claix, France). Quartz cuvettes with 1 and 10 mm path-length (Hellma, Müllheim, Germany) were used for spectral scans and titrations at fixed wavelength, respectively. CD scans were performed at room temperature in 1 nm steps, with 20 s signal averaging per step. Mean residue ellipticity (MRE; deg cm2 dmol−1) was determined according to the relation: MRE = θ/(10C×NA×l), where θ denotes the experimental ellipticity (in mdeg), C is the molar concentration of the protein, NA is the number of amino acids (153 for apoMb), and l is the cuvette path length (in cm). To verify the formation of N, U and the pH 4.1 intermediate, all nitroxide-labeled samples were subject to equilibrium pH titrations, monitored by far-UV CD at 222 nm. The far-UV CD titrations were carried out at room temperature and data were signal-averaged for 20 s. A concentrated protein stock solution (ca. 300 μM in 10 mM sodium acetate, pH 6.1) was diluted into 1 mM sodium acetate at pH 6.1 to generate ca. 20 μM protein solutions. The pH of these starting solutions was progressively lowered upon addition of either 0.1 M or 1 M acetic acid (to pH ca. 3) or concentrated HCl (to pH < 3). Samples were allowed to equilibrate at the desired pH for ≥ 10 min., prior to data acquisition, and data were collected in sequence on the same sample. Independent duplicate pH titrations were performed on each apoMb variant.
DNP and EPR measurements
Prior to DNP experiments, samples at the desired pH were eluted through a 2 ml Sephadex G-25 (fine grade, SIGMA) spin column to remove any aggregated species51. The column was equilibrated by repeated washes with buffer adjusted to the desired pH. Protein concentrations were assessed by electronic absorption (280 nm) after spin column treatment. Typical concentrations were ~ 200 μM. DNP experiments were performed at 0.35 T in a Bruker TE102 rectangular cavity using a homebuilt NMR probe and a Bruker Avance 300 NMR spectrometer. Experiments were performed at room temperature while air was continuously flowed through the cavity to minimize sample heating. ~ 3 μL of sample was loaded into a 0.64 mm inner diameter quartz capillary to minimize the electric field at the sample. Further details of our DNP hardware63 and data analysis48,64 have been previously described.
EPR spectra were recorded at 22 °C in a Bruker ELEXSYS 580 with a high-sensitivity resonator using an incident microwave power of 20 mW and modulation amplitude of 1 Gauss. Samples of at least 6 μl were loaded in sealed capillary tubes (0.6 ID X 0.84 OD; VitroCom, Inc., NJ). Spectra were recorded at X-band frequency with a scan width of 100 Gauss in 25% (w/w) Ficoll 70 to increase the solution viscosity, minimizing the contribution of protein rotational diffusion to the EPR spectral lineshapes. At this concentration, Ficoll has no effect on the internal motion of the spin-labeled side chains55. The final protein concentration of the EPR samples was ~ 200–400 μM. To obtain hyperfine splittings (2Azz′) in the absence of motion, EPR spectra were also recorded at −50 °C using an incident microwave power of 0.2 mW and modulation amplitude of 2 Gauss. The hyperfine splittings were determined by individually fitting of the low- and high-field resonances to a mixture of Lorentzian and Gaussian lineshapes using the Xepr program (Bruker, Germany) and by measuring the magnetic field separation between the low- and high-field resonances to obtain 2Azz′. EPR simulations of room temperature data are described in the supplementary material.
Overhauser DNP Theory
We provide a brief discussion of the relevant theory as detailed reports can be found elsewhere47,48,64,65. Overhauser DNP is a motion-mediated polarization transfer of electron spin polarization to nuclear spin polarization via dipolar or scalar coupling. Upon steady state irradiation at the electron spin resonance frequency, the 1H NMR water signal enhancement, E, given by47
| [1] |
where ρ is the coupling factor, f is the leakage factor, s is the saturation factor describing the extent to which the electron spin population has been driven from equilibrium by microwave irradiation and γS and γI are electron and proton gyromagnetic ratios (γS/γI ~ 660 for an unpaired electron spin and the 1H nucleus). Both ρ and f depend on the rates of nuclear spin transitions caused by the dipolar coupling to the electron spins, and are functions of magnetic field and the timescale modulating the dipolar coupling between the two spins. The leakage factor is determined from 1H T1 relaxation measurements; f = 1 − T1/T10 where T1 (T10) is the 1H spin relaxation time with (without) the spin label present66. The leakage factor is close to 1 if most 1H relaxation occurs via coupling to the unpaired electron. The saturation factor depends on the microwave power and the amount of hyperfine mixing caused by the coupling to the 14N nuclei64. For the tumbling times of spin labeled apoMb we can approximate s at infinite microwave power to be close to 164. By measuring E as a function of applied microwave power and extrapolating to infinite power, we determine Emax for s = 1 and can solve Eq. 1 for ρ. Determining the timescale of the interaction from ρ depends on the model employed to describe the diffusion of the two spins. Unlike in NOE, the electron-nucleus dipolar interaction responsible for DNP is bi-molecular, and the 1H-electron coupling is predominantly modulated by translational diffusion. The force free, hard sphere translational diffusion model (FFHS)67,68 has previously been shown to fit nuclear magnetic resonance dispersion data reasonably well for water interacting with nitroxide radicals in solution48,69, attached to spin labeled vesicles34, and the solvent-exposed sites of a spin labeled protein70. This model is attractive as ρ only depends on the magnetic field and the translational correlation time, τ, (assuming the electron spin relaxation times are long compared to τ) through the spectral density function, j(ω, τ):
| [2] |
| [3] |
where
| [4] |
ωS and ωI are the electron spin and 1H nuclear spin Larmor frequencies, d is the distance of closest approach between the two spins, and DI and Ds are the translational diffusion coefficients of the 1H of water and the electron spin respectively. Using Eqns 1–4 the translational correlation time of water can be determined from DNP measurements. Recent work has applied more sophisticated techniques to model the coupling and saturation factors71–73. Regardless of the dynamic model used, however, ρ decreases as the timescales modulating the electron-1H nucleus dipolar coupling increase, allowing qualitative conclusions to be drawn by comparing ρ values, making DNP a general method for gaining information on hydration dynamics. Although the 1H NMR signal of bulk water is measured, the signal enhancement is heavily weighted toward water within 10 Å of the electron spin due to the strong distance dependence of the dipolar coupling and large gyromagentic ratio of the electron spin that makes it the dominant relaxation source46. The DNP approach has a further advantage of being able to measure a leakage factor to account for 1H spin relaxation not due to the electron spin. This in contrast with the intermolecular 1H NOE experiment where long range dipolar couplings cannot be neglected46.
Results and Discussion
Effect of Spin Label on apoMb Structure
Introduction of the R1 spin label at the 5 sites of apoMb studied here does not have a significant effect on the secondary structure of the native protein, except for a small decrease in helicity observed for F138R1 as shown by the far-UV CD data in Figure 2. Additionally, R1 at buried sites did not cause local unfolding as evidenced by the immobilization of the nitroxide, characteristic of R1 in folded structures74 (see EPR results discussed below). At the tertiary fold level, small-to-large substitutions in the core of the protein, such as the ones made here, may overpack the core and potentially introduce unfavorable steric contacts, unfavorable interactions, and torsional strain75. Earlier studies75,76 showed that the extent of such destabilizing effects depends on the native packing and the internal flexibility of the residue introduced. For example, high resolution structures of several proteins bearing a small-to-large substitution in the interior, including introduction of an R1 spin label74, revealed that the larger side chain can be accommodated by a small shift in the backbone atoms and adjustments of side chain rotamers without major structural rearrangements75,77,78. In fact, substitution of the native residue F138 with a tryptophan in myoglobin had little effect on the tertiary fold of the holo protein (RMSD = 0.19 Å)79. Thus, it is likely that introduction of the R1 side chain at apoMb buried sites does not have a substantial effect on the three dimensional structure of the protein, though small rearrangements of side chains and small shifts of the backbone may be present. In flexible structures such as N or MG states of apoMb, the R1 residue should be accommodated with little energy cost.
Figure 2.
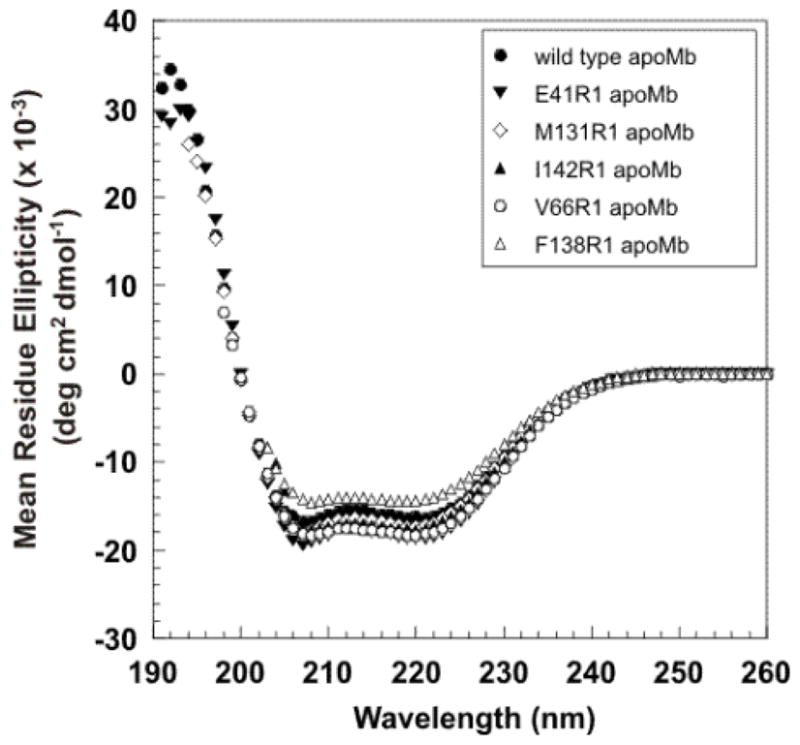
Far-UV circular dichroism spectra of wild type (●) and nitroxide-labeled (▼, ◇, ▲, ○, △) apoMb variants collected at room temperature. The spectra are an average of three independent experiments.
The pH titrations shown in Figure 3 reveal that all species populate an equilibrium folding intermediate, and that the pH-dependence of apoMb equilibrium unfolding is largely preserved in the mutants. Further, previous molecular dynamics simulations with freely dissolved nitroxide radicals80 and bulk water diffusion measurements from DNP with nitroxide radicals81 showed that the hydration dynamics determined from DNP is unaffected by the presence of the spin label.
Figure 3.
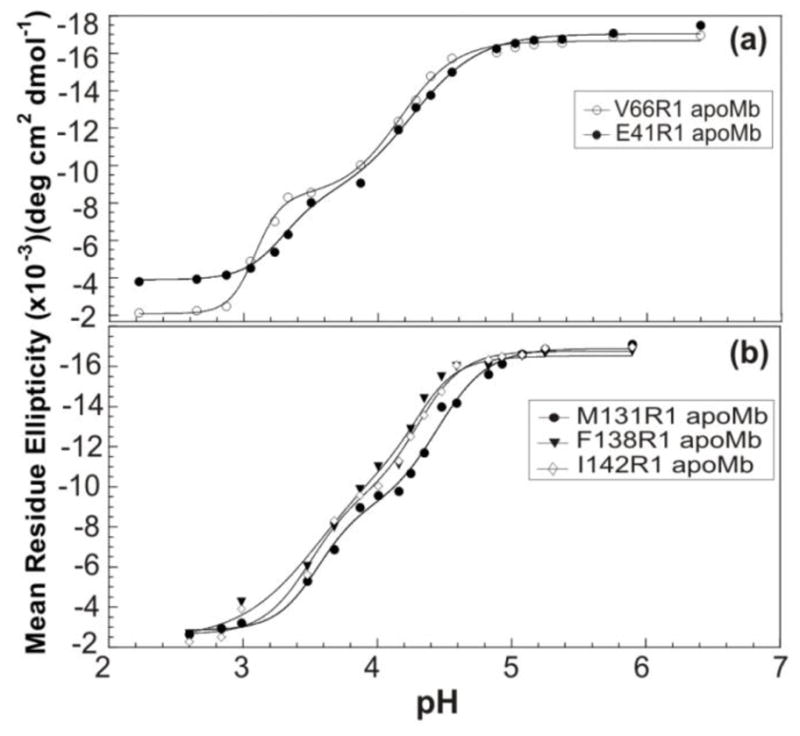
Equilibrium pH titrations of (a) V66R1 (○), E41R1 (●); and (b) M131R1 (●), F138R1 (▼), and I142R1 (◇) apoMb variants followed by far-UV CD at 222nm at room temperature. To guide the eye, the experimental data were fit to a model based on a linear combination of Henderson-Hasselbalch equations where we assumed, for simplicity, that each of the two main phase transitions results from the collective protonation/deprotonation of the pertinent residues with ionizable side chains.
The Nonpolar Core of Native apoMb
1H DNP and T1 measurements of water were used to determine the DNP leakage and coupling factors and to estimate the timescale of diffusion dynamics, τ, of hydration water that is interacting with the nitroxide spin probe (Eqns 1–4). The results are shown in Figure 4 and Table 1. Clear differences in ρ (Table 1), and thus τ, are observed between the interior and exterior sites, as well as between the unfolded, equilibrium molten globule and native states, particularly at interior sites. In the N state, all sites in the nonpolar core display much slower water dynamics than the solvent-exposed sites. Among the interior sites, M131R1 displays the slowest water dynamics (i.e., large τ), followed by F138R1 and I142R1. Large τ values are either due to a large distance of closest approach, d, between the radical’s electron spin and 1H nuclear spin of water, and/or a small translational diffusion coefficient of water near the radical, DI (Eq. 4). In either case, given that a decrease in ρ correlates with slower solvent dynamics with respect to the spin label regardless of the model chosen to describe the dynamics of the system47, it is clear that the interactions of water with the nonpolar core occur on a much slower timescale than those with the solvent-exposed sites.
Figure 4.

τ for the N (pH 6.1), MG (pH 4.1), and U state (pH 2.2) for the different mutants. The FFHS model was used to estimate τ from ρ. The standard deviation of independent measurements of ρ was used to estimate the error bars. Note that the inset has a different vertical scale. Lines are to help guide the eye.
Table 1.
Summary of DNP and EPR parameters. Sample concentrations are ~200 μM. Emax is the extrapolated DNP signal at infinite microwave power (Materials and Methods). Error in f is ~3–5%. The percent of immobile (%i) and mobile (%m) components in the EPR spectra were obtained from spectral simulations. Additional parameters obtained from simulations are provided in Table S1.
| Sample | f | ρ × 10−2 | τ (ps) | Emax | Azz′ (Gauss) | %i | %m |
|---|---|---|---|---|---|---|---|
| M131R1-N | 0.78 | 0.24 ± 0.2 | 1950 ± 1000 | +0.2 ± 1 | 34.90 | 95 | 5 |
| F138R1-N | 0.16 | 0.9 ± 0.1 | 908 ± 70 | −0.1 ± 0.1 | 34.38 | 95 | 5 |
| I142R1-N | 0.36 | 1.6 ± 0.1 | 642 ± 25 | −2.9 ± 0.1 | 35.40 | 61 | 39 |
| E41R1-N | 0.22 | 8.9 ± 1 | 197 ± 20 | −12 ± 2 | 36.40 | 58 | 42 |
| V66R1-N | 0.12 | 5.2 ± 1 | 298 ± 50 | −3.2 ± 0.9 | 36.22 | --- | 100 |
| M131R1-MG | 0.383 | 2.7 ± 0.9 | 460 ± 100 | −6.0 ± 2 | 35.10 | 60 | 40 |
| F138R1-MG | 0.13 | 4.1 ± 0.3 | 351 ± 15 | −2.5 ± 0.2 | 35.38 | 59 | 41 |
| I142R1-MG | 0.27 | 4.3 ± 0.7 | 340 ± 22 | −6.8 ± 1 | 35.40 | 60 | 40 |
| E41R1-MG | 0.34 | 4.9 ± 0.9 | 309 ± 40 | −8.7 ± 0.6 | 35.74 | 57 | 43 |
| V66R1-MG | 0.16 | 5.2 ± 0.4 | 298 ± 20 | −4.4 ± 0.4 | 36.13 | 72 | 28 |
| M131R1-U | 0.24 | 8.1 ± 2 | 213 ± 50 | −12 ± 3 | --- | --- | --- |
| F138R1-U | 0.11 | 10.1 ± 0.7 | 178 ± 12 | −6.1 ± 0.5 | --- | --- | --- |
| I142R1-U | 0.21 | 9 ± 2 | 196 ± 30 | −11 ± 2 | --- | --- | --- |
| E41R1-U | 0.18 | 8.3 ± 0.7 | 209 ± 15 | −8.4 ± 0.5 | --- | --- | --- |
| V66R1-U | 0.12 | 10.7 ± 0.6 | 169 ± 12 | −7.7 ± 0.4 | --- | --- | --- |
Leakage factors are also shown in Table 1 and provide important additional insights. A large τ accompanied by a small f is compatible with the presence of distant water (large d); while a large τ accompanied by a high f for samples with comparable spin label concentration is consistent with slower diffusion of nearby water (small DI). These are general trends regardless of the dynamic model used; however, alternative interpretations are possible. Here, EPR analysis is crucial to narrow the interpretation and further validate the DNP results and will be discussed below. The value of f for F138R1 in the N state is smaller than that observed for the other interior sites; hence we interpret the large τ for this residue as due to remote water on the protein surface and not slowly diffusing water proximal to the spin label. This conclusion is supported by the EPR results discussed below. Residues M131R1 and I142R1 have both large f and τ, suggesting the presence of dynamic water closer to the spin label compared to F138R1. However, EPR analysis was necessary to conclusively assess the origin of the large τ for these two residues.
The N state EPR spectra of M131R1 and F138R1 reporting on the dynamics of the R1 side chain are shown in Fig. 5. The spectral lineshapes are characteristic of a nitroxide with restricted motion and tight packing around the side chain. EPR data on frozen samples (−50°C) were also collected to determine the effective hyperfine splitting, Azz′, as this parameter is sensitive to local polarity82–84 (Table 1; Fig. S1). For example, a free nitroxide spin label has Azz′ values of 36.88 Gauss in water and 33.78 Gauss in toluene84. The Azz′ values for residues M131R1 and F138R1 in the N state are close to the value for a free nitroxide in toluene, clearly implying a nonpolar environment around the spin label. These EPR results point to the existence of a ‘dry’ hydrophobic core in the N state suggesting that the small, but measurable, DNP effect arises from water remotely located from the spin labeled core (i.e. larger d compared to surface sites). Given this conclusion, the significantly larger f for M131R1 compared to F138R1 suggests the interesting possibility of dynamically restricted bound water closer to M131R1 than F138R1, since distances to rapidly diffusing surface water cannot explain the large observed difference in f. A few bound water molecules (surface or internal) rotating with the global protein motion can contribute significantly to electron spin-mediated 1H nuclear spin relaxation rates37,85. This extra relaxation competes with the DNP effect, lowering ρ and increasing f. As this effect falls off as 1/r6, bound water molecules closer to M131R1 would explain the much larger f than F138R1, consistent with our results that both sites are still “dry”.
Figure 5.
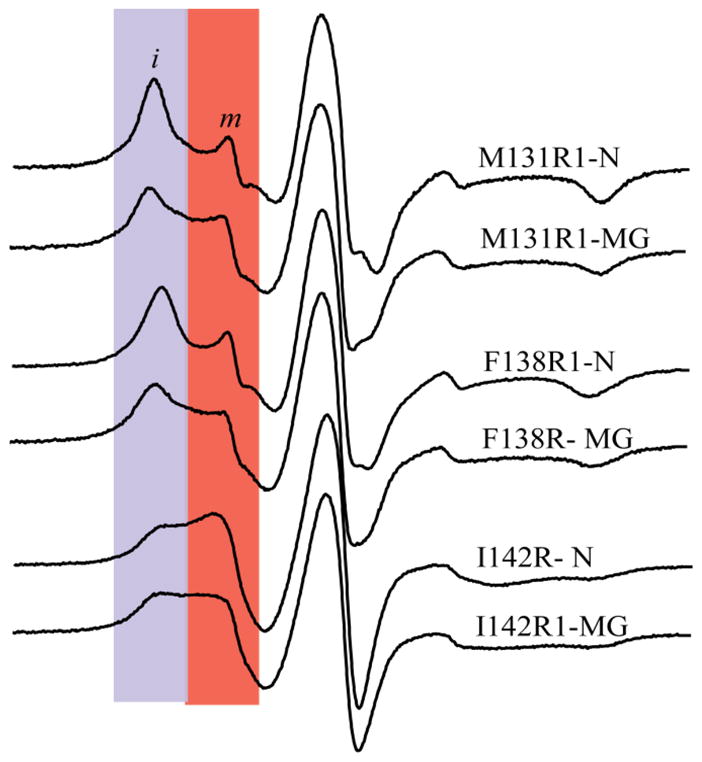
EPR spectra of R1 at the buried sites. Regions shaded in blue and red identify relatively immobile (i) and mobile (m) states, respectively. The m population of M131R1 and F138R1 in the N state is ≈ 5% (Table S1) and likely arises from a small amount of free spin label or unfolded protein. This amount is negligible for DNP so we only consider the i component in the discussion of the N state. In the MG states of M131R1 and F138R1 the m component is ≈ 40% and contributes significantly to the DNP experiments. For I142R1, both i and m components are important in the N and MG states.
Among the buried sites in the N state, I142R1 has the smallest τ, largest Azz′, value and displays a multi-component EPR spectrum (Table 1; Fig. 5). As shown in Fig. 6, I142 is packed against the F-helix in the holo-protein. Both NMR and EPR studies have shown that the F helix in the N state experiences conformational exchange resulting from removal of the heme in the apo-protein55,57,86. Thus, it is likely that the two-component EPR spectrum arises from changes in packing and solvent exposure around I142R1 due to the conformationally fluctuating F helix. Taken together with the DNP data, this observation implies that I142R1 is partially exposed to hydration water possessing a slow apparent diffusion coefficient.
Figure 6.
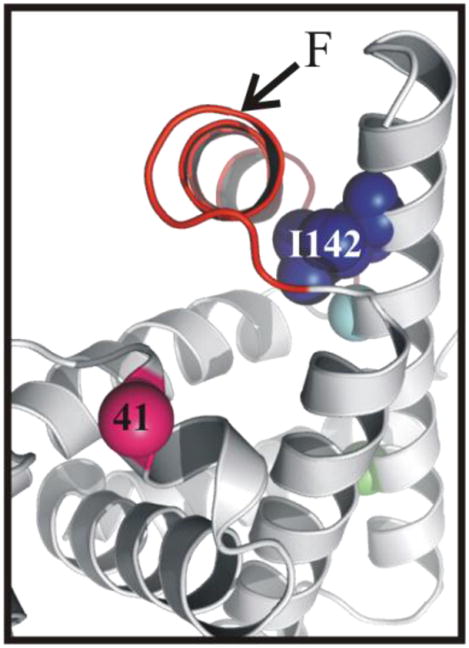
Ribbon diagram of myoglobin showing the position of the native isoleucine 142 in the holo-protein (PDB: 2mbw).
In summary, the small ρ, f and Azz′ values of F138R1 imply that this residue is ‘dry’ in the native state with the small DNP effect arising from water on the protein surface. M131R1 also displays a small ρ and Azz′, implying that this residue is ‘dry’ as well. The large leakage factor arises from significant 1H relaxation by the unpaired electron, which we suggest is due to nearby bound water. In contrast, I142R1 displays ρ, f and Azz′ values consistent with the presence of slowly diffusing water directly interacting directly with this residue. Therefore, I142R1 is partially hydrated in the native state of the protein, consistent with the less structured environment of this residue in the apo form of the protein.
The MG Core
As shown in Fig. 4 and Table 1, the core of the MG state interacts with water that displays significantly faster translational dynamics than the N state with τ ~350–450 ps. This is only a two-fold retardation compared to the hydration dynamics around the same residues in the U state. The decrease in τ for these sites is accompanied by a decrease in f in the MG relative to the N state (except F138R1 where f remains relatively constant), implying that the observed DNP effects result from faster diffusing local water compared to the core of the N state. This result suggests that the core of the MG state interacts directly with dynamic water, unlike the core of the N state.
The EPR spectra of all mutants studied here in the MG state display two spectral components that could arise from either different rotamers of R1 or distinct protein conformations55. Given that high resolution NMR studies of the MG state show conformational exchange extended over several regions of the protein, the latter possibility is likely50,57. The EPR data further show that the M131R1 and F138R1 side chains are more dynamic in the MG compared to the N state, suggesting reduced side-chain packing in the MG core. The higher Azz′ value for F138R1 also indicates that this side chain experiences a more polar environment in the MG than in the N state, consistent with the DNP results which imply the presence of dynamic water in the MG core. In contrast, the MG state EPR spectrum of I142R1 reflects an overall reduction in mobility of the side chain relative to the N state as seen by the decrease in the intensity of the more mobile component in Figure 5 and by spectral simulations (Fig. S2, Table S1). However, the DNP τ and f values are still significantly smaller in the MG state, implying faster water dynamics near I142R1 in the MG compared to the N state. This result shows that trends of water dynamics around the R1 side chain are not always correlated with side chain dynamics. Lastly, it is important to note that the estimated τ of 350–450 ps represents a weighted average between the exchanging conformations sampled by the MG. From both the DNP and EPR results; we conclude that the core of the apoMb MG is hydrated with dynamic water. This finding does not necessarily imply there is much water in the MG core. In fact, the relatively low Azz′ values (e.g. compared to the exterior sites, see Table 1) suggest there may be only a few, yet dynamic, water molecules interacting with the core of the MG.
The N and MG Solvent-Exposed Surface
The large differences in τ observed between the buried and solvent-exposed sites (E41R1 and V66R1) in the folded state confirm that water is able to more freely diffuse at the protein surface. At the same time, the observation of heterogeneous surface hydration dynamics, especially in the N state, emphasizes the importance of employing site-specific probes as charge, polarity, local structural, and chemical topology may all contribute to distinct variations in local water dynamics24,31,32. The τ values of 190 and 300 ps for E41R1 and V66R1, respectively, are about 2–4 times slower than the measured τ value of bulk water48,87, in agreement with previous results that surface hydration water is slowed by a factor of 2–5 compared to bulk water20,32,37,81. The EPR spectra for both surface sites display higher mobility compared to the buried sites, as expected (Fig. 7). E41R1 in the N state displays a two-component EPR spectrum with a relatively immobile and a mobile component that has a lineshape consistent with weakly ordered anisotropic motion characteristic of R1 at helix surface sites88,89. Spectral simulations confirm this qualitative description and provide quantitative values for rates and order of motion (Fig. S2 and Table S1).
Figure 7.

EPR spectra of E41R1 and V66R1 in the N and MG state. i and m identify components corresponding to relatively immobile and mobile states of R1. Note that V66R1 in the N state displays only one component (see text).
In the MG state, E41R1 also displays two EPR spectral components distinct from those of the N state. In particular, a more strongly immobilized component appears, while the more mobile component has lower order (Fig. 7, Fig. S3, Table S1). The Azz′ value of E41R1 is also lower than in N, suggesting that this site has reduced polarity in the MG. A dramatic increase in τ and f is also observed for E41R1 in the MG state compared to the N state. From the DNP and EPR results, we propose that the MG samples non-native conformations in which E41R1 is partially buried. This finding is interesting because non-native conformations of intermediates were suggested to be important in protein folding90,91. A previous study by time-resolved Trp fluorescence also mapped out hydration dynamics around E41, but found faster hydration dynamics in the MG compared to the N state for this residue26. This study, however, also found that the hydration dynamics of E41 was similar to that of more buried sites in the N state—a trend not observed by DNP nor generally expected. As mentioned for the MG interior sites, the DNP results report on hydration dynamics averaged over exchanging conformations. It is possible that tryptophan fluorescence spectroscopy is not equally sensitive to conformations with distinctly different exposure to water, which may explain the conflicting observations.
The EPR spectrum of V66R1 in the N state reflects a single dynamic component with ordered anisotropic motion88 (Fig. 7 and Fig. S3, Table S1). In the MG, the EPR spectrum is quite different from the N state and displays two components, likely caused by conformational exchange in the E helix as previously reported57. However, the DNP results show similarly high hydration dynamics between the MG and N state, and the local polarity measured through the Azz′ values for V66R1 are similarly high for both the N and MG state. Although the EPR spectrum of V66R1 reveals differences between the local protein motions of N and MG, the DNP results suggest similarly high hydration dynamics for this site in both states.
The Acid Unfolded State
In the U state, all residues display significant solvent exposure with τ between 169–219 ps. The dispersion in τ is much smaller than observed in the MG and N states, though small differences remain (Fig. 4; Table 1). The dramatic decrease in the dispersion of τ points to the presence of a highly dynamic and largely unstructured U state, consistent with prior findings57,92. This result suggests that the local topology, charge, hydrophobicity, and polarity upon formation of the native tertiary structure are stronger determinants of local hydration dynamics than characteristics of the primary sequence.
Conclusions
Using dynamic nuclear polarization and electron paramagnetic resonance of site specifically spin-labeled proteins, we were able to probe the diffusion dynamics of hydration water interacting with the surface and core sites of apoMb. In the native state, all residues studied here have distinctly different hydration dynamics. Specifically, the surface sites (E41R1 and V66R1) display a relatively fast hydration dynamics that is only 2–4 times slower than that of bulk water. In contrast, the DNP and EPR data of M131R1 and F138 confirm the existence of a ‘dry’ core in the native state. Unlike M131R1 and F138R1, the core residue I142R1 interacts directly with dynamic water, likely due to the disordered F-helix of the apo-protein, but on a timescale much slower than the solvent exposed sites.
The equilibrium molten globule is characterized by a much smaller dispersion in τ. The nonpolar core still displays slower water dynamics than the solvent-exposed sites, consistent with the idea that the MG adopts some of the native state features. From the DNP and EPR data we conclude that all the MG core sites studied here directly interact with dynamic water, and are therefore “wet”.
The U state displays the fastest water dynamics and is characterized by fairly uniform behavior across all sites investigated. The large progressive dispersion in τ, as U turns into MG and then into N, implies that the local protein topology significantly impacts the hydration dynamics landscape.
The role of hydration dynamics in protein folding and other biomolecular processes involving conformational transitions is of active interest. This work shows that the hydration dynamics of apoMb is site-specific and folding-state dependent. Our DNP results indicate that the investigated core sites of the MG are wet, with hydration dynamics significantly slower than in the U state. Surprisingly, the exterior site E41R1 is hydrated by less dynamic water in the MG than in the N state, suggesting the presence of non-native contacts and highly dynamic side chains in the MG. Consistent with this observation, the EPR spectra of all the MG sites show reduced side chain packing and increased local conformational heterogeneity, compared to N. Thus, the emerging scenario is a conformationally flexible equilibrium MG with a ‘loose’ wet core actively sampling non-native conformations that enable surface residues to become transiently buried. In general, the presence of slowly-diffusing hydration water in the MG core may prove to be particularly important in nature. This water may play key roles in protein folding, including, as has been proposed, lubricating or facilitating the conformational sampling necessary to consolidate the loosely packed core side chains into a highly compact (and virtually water-free) N state12.
The dramatically different hydration dynamics observed for the different states of apoMb demonstrates that the water within about 10 Å of a protein has distinctly variable properties that are exquisitely sensitive to protein conformation. The dynamics of this hydration water is important in that it is likely to affect thermodynamic stability and interconversion mechanisms among different protein states.
Supplementary Material
Acknowledgments
The authors thank Peter E. Wright for helpful discussions and Anna Pavlova for help with sample preparation. S.H. acknowledges funding from a Packard Fellowship and the NSF CAREER Award (CHE 0645536), S.C. was funded by NSF grants MCB-095129 and MCB-0544182, and W.H. received funding from NIH Grant 5R01 EY005216 and the Jules Stein Professor Endowment.
Footnotes
Supplementary information is available and contains more details of the EPR simulation techniques and results. This material is available free of charge via the Internet at http://pubs.acs.org.
References
- 1.Kauzmann W. Adv Protein Chem. Vol. 14. Academic Press; 1959. pp. 1–63. [DOI] [PubMed] [Google Scholar]
- 2.Dill KA. Biochemistry. 1990;29:7133–7155. doi: 10.1021/bi00483a001. [DOI] [PubMed] [Google Scholar]
- 3.Cheung MS, Garcia AE, Onuchic JN. Proc Nat Acad Sci. 2002;99:685–690. doi: 10.1073/pnas.022387699. [DOI] [PMC free article] [PubMed] [Google Scholar]
- 4.Dyson HJ, Wright PE, Scheraga HA. Proc Nat Acad Sci. 2006;103:13057–13061. doi: 10.1073/pnas.0605504103. [DOI] [PMC free article] [PubMed] [Google Scholar]
- 5.Kim PS, Baldwin RL. Annu Rev Biochem. 1982;51:459–489. doi: 10.1146/annurev.bi.51.070182.002331. [DOI] [PubMed] [Google Scholar]
- 6.Roder H, Colon W. Curr Opin Struc Biol. 1997;7:15–28. doi: 10.1016/s0959-440x(97)80004-8. [DOI] [PubMed] [Google Scholar]
- 7.Kuwajima K. Proteins. 1989;6:87–103. doi: 10.1002/prot.340060202. [DOI] [PubMed] [Google Scholar]
- 8.Ptitsyn OB. Adv Protein Chem. 1995;47:83–229. doi: 10.1016/s0065-3233(08)60546-x. [DOI] [PubMed] [Google Scholar]
- 9.Denisov VP, Jonsson BH, Halle B. Nat Struct Biol. 1999;6:253–260. doi: 10.1038/6692. [DOI] [PubMed] [Google Scholar]
- 10.Jha SK, Udgaonkar JB. Proc Nat Acad Sci. 2009;106:12289–12294. doi: 10.1073/pnas.0905744106. [DOI] [PMC free article] [PubMed] [Google Scholar]
- 11.Kamei T, Oobatake M, Suzuki M. Biophys J. 2002;82:418–425. doi: 10.1016/S0006-3495(02)75406-4. [DOI] [PMC free article] [PubMed] [Google Scholar]
- 12.Sheinerman FB, Brooks CL. Proc Nat Acad Sci. 1998;95:1562–1567. doi: 10.1073/pnas.95.4.1562. [DOI] [PMC free article] [PubMed] [Google Scholar]
- 13.Baldwin RL, Frieden C, Rose GD. Proteins-Structure Function and Bioinformatics. 2010;78:2725–2737. doi: 10.1002/prot.22803. [DOI] [PMC free article] [PubMed] [Google Scholar]
- 14.Shakhnovich EI, Finkelstein AV. Biopolymers. 1989;28:1667–1680. doi: 10.1002/bip.360281003. [DOI] [PubMed] [Google Scholar]
- 15.Kramers HA. Physica. 1940;7:284–304. [Google Scholar]
- 16.Manke CW, Williams MC. Macromolecules. 1985;18:2045–2051. [Google Scholar]
- 17.Ansari A, Jones CM, Henry ER, Hofrichter J, Eaton WA. Science. 1992;256:1796–1798. doi: 10.1126/science.1615323. [DOI] [PubMed] [Google Scholar]
- 18.Frauenfelder H, Chen G, Berendzen J, Fenimore PW, Jansson H, McMahon BH, Stroe IR, Swenson J, Young RD. Proc Nat Acad Sci. 2009;106:5129–5134. doi: 10.1073/pnas.0900336106. [DOI] [PMC free article] [PubMed] [Google Scholar]
- 19.Frauenfelder H, Fenimore PW, McMahon BH. Biophys Chem. 2002;98:35–48. doi: 10.1016/s0301-4622(02)00083-2. [DOI] [PubMed] [Google Scholar]
- 20.Jansson H, Kargl F, Fernandez-Alonso F, Swenson J. J Chem Phys. 2009;130:205101–13. doi: 10.1063/1.3138765. [DOI] [PubMed] [Google Scholar]
- 21.Bhat TN, Bentley GA, Boulot G, Greene MI, Tello D, Dallacqua W, Souchon H, Schwarz FP, Mariuzza RA, Poljak RJ. Proc Nat Acad Sci. 1994;91:1089–1093. doi: 10.1073/pnas.91.3.1089. [DOI] [PMC free article] [PubMed] [Google Scholar]
- 22.Kurkal V, Daniel RM, Finney JL, Tehei M, Dunn RV, Smith JC. Chem Phys. 2005;317:267–273. doi: 10.1529/biophysj.104.058677. [DOI] [PMC free article] [PubMed] [Google Scholar]
- 23.Halle B, Nilsson L. J Phys Chem B. 2009;113:8210–8213. doi: 10.1021/jp9027589. [DOI] [PubMed] [Google Scholar]
- 24.Johnson ME, Malardier-Jugroot C, Murarka RK, Head-Gordon T. J Phys Chem B. 2009;113:4082–4092. doi: 10.1021/jp806183v. [DOI] [PubMed] [Google Scholar]
- 25.Zhang L, Wang L, Kao YT, Qiu W, Yang Y, Okobiah O, Zhong D. Proc Nat Acad Sci. 2007;104:18461–18466. doi: 10.1073/pnas.0707647104. [DOI] [PMC free article] [PubMed] [Google Scholar]
- 26.Zhang L, Yang Y, Kao YT, Wang L, Zhong D. J Am Chem Soc. 2009;131:10677–10691. doi: 10.1021/ja902918p. [DOI] [PubMed] [Google Scholar]
- 27.Rupley JA, Gratton E, Careri G. Trends Biochem Sci. 1983;8:18–22. [Google Scholar]
- 28.Chandler D. Nature. 2005;437:640–647. doi: 10.1038/nature04162. [DOI] [PubMed] [Google Scholar]
- 29.Daidone I, Ulmschneider MB, Di Nola A, Amadei A, Smith JC. Proc Nat Acad Sci. 2007;104:15230–15235. doi: 10.1073/pnas.0701401104. [DOI] [PMC free article] [PubMed] [Google Scholar]
- 30.Levy Y, Onuchic JN. Annu Rev Bioph Biom. 2006;35:389–415. doi: 10.1146/annurev.biophys.35.040405.102134. [DOI] [PubMed] [Google Scholar]
- 31.Makarov VA, Andrews BK, Smith PE, Pettitt BM. Biophys J. 2000;79:2966–2974. doi: 10.1016/S0006-3495(00)76533-7. [DOI] [PMC free article] [PubMed] [Google Scholar]
- 32.Russo D, Hura G, Head-Gordon T. Biophys J. 2004;86:1852–1862. doi: 10.1016/S0006-3495(04)74252-6. [DOI] [PMC free article] [PubMed] [Google Scholar]
- 33.Otting G, Liepinsh E, Halle B, Frey U. Nat Struct Mol Biol. 1997;4:396–404. doi: 10.1038/nsb0597-396. [DOI] [PubMed] [Google Scholar]
- 34.Hodges MW, Cafiso DS, Polnaszek CF, Lester CC, Bryant RG. Biophys J. 1997;73:2575–2579. doi: 10.1016/S0006-3495(97)78286-9. [DOI] [PMC free article] [PubMed] [Google Scholar]
- 35.Persson E, Halle B. Proc Nat Acad Sci. 2008;105:6266–6271. doi: 10.1073/pnas.0709585105. [DOI] [PMC free article] [PubMed] [Google Scholar]
- 36.Venu K, Anders Svensson L, Halle B. Biophys J. 1999;77:1074–1085. doi: 10.1016/s0006-3495(99)76957-2. [DOI] [PMC free article] [PubMed] [Google Scholar]
- 37.Qvist J, Persson E, Mattea C, Halle B. Faraday Discuss. 2009;141:131–144. doi: 10.1039/b806194g. [DOI] [PubMed] [Google Scholar]
- 38.Nakagawa H, Joti Y, Kitao A, Kataoka M. Biophys J. 2008;95:2916–2923. doi: 10.1529/biophysj.107.128546. [DOI] [PMC free article] [PubMed] [Google Scholar]
- 39.Smith JC. Q Rev Biophys. 1991;24:227–291. doi: 10.1017/s0033583500003723. [DOI] [PubMed] [Google Scholar]
- 40.Zanotti JM, Hervé G, Bellissent-Funel MC. BBA-Proteins Proteom. 2006;1764:1527–1535. doi: 10.1016/j.bbapap.2006.08.006. [DOI] [PubMed] [Google Scholar]
- 41.Ebbinghaus S, Kim SJ, Heyden M, Yu X, Heugen U, Gruebele M, Leitner DM, Havenith M. Proc Nat Acad Sci. 2007;104:20749–20752. doi: 10.1073/pnas.0709207104. [DOI] [PMC free article] [PubMed] [Google Scholar]
- 42.Kim SJ, Born B, Havenith M, Gruebele M. Angew Chem Int Ed. 2008;47:6486–6489. doi: 10.1002/anie.200802281. [DOI] [PubMed] [Google Scholar]
- 43.Pal SK, Peon J, Zewail AH. Proc Nat Acad Sci. 2002;99:1763–1768. doi: 10.1073/pnas.042697899. [DOI] [PMC free article] [PubMed] [Google Scholar]
- 44.Pal SK, Peon J, Zewail AH. Proc Nat Acad Sci. 2002;99:15297–15302. doi: 10.1073/pnas.242600399. [DOI] [PMC free article] [PubMed] [Google Scholar]
- 45.Nucci NV, Pometun MS, Wand AJ. Nat Struct Mol Biol. 2011;18:245–249. doi: 10.1038/nsmb.1955. [DOI] [PMC free article] [PubMed] [Google Scholar]
- 46.Halle B. J Chem Phys. 2003;119:12372–12385. [Google Scholar]
- 47.Hausser KH, Stehlik D. Advan Magn Reson. 1968;3:79–139. [Google Scholar]
- 48.Armstrong BD, Han S. J Am Chem Soc. 2009;131:4641–4647. doi: 10.1021/ja809259q. [DOI] [PubMed] [Google Scholar]
- 49.Hughson F, Wright P, Baldwin R. Science. 1990;249:1544–1548. doi: 10.1126/science.2218495. [DOI] [PubMed] [Google Scholar]
- 50.Eliezer D, Chung J, Dyson HJ, Wright PE. Biochemistry. 2000;39:2894–2901. doi: 10.1021/bi992545f. [DOI] [PubMed] [Google Scholar]
- 51.Eliezer D, Jennings PA, Dyson HJ, Wright PE. FEBS Lett. 1997;417:92–96. doi: 10.1016/s0014-5793(97)01256-8. [DOI] [PubMed] [Google Scholar]
- 52.Eliezer D, Wright PE. J Mol Biol. 1996;263:531–538. doi: 10.1006/jmbi.1996.0596. [DOI] [PubMed] [Google Scholar]
- 53.Nishiguchi S, Goto Y, Takahashi S. J Mol Biol. 2007;373:491–502. doi: 10.1016/j.jmb.2007.08.003. [DOI] [PubMed] [Google Scholar]
- 54.Kuriyan J, Wilz S, Karplus M, Petsko GA. J Mol Biol. 1986;192:133–154. doi: 10.1016/0022-2836(86)90470-5. [DOI] [PubMed] [Google Scholar]
- 55.López CJ, Fleissner MR, Guo Z, Kusnetzow AK, Hubbell WL. Protein Sci. 2009;18:1637–1652. doi: 10.1002/pro.180. [DOI] [PMC free article] [PubMed] [Google Scholar]
- 56.Jennings PA, Wright PE. Science. 1993;262:892–896. doi: 10.1126/science.8235610. [DOI] [PubMed] [Google Scholar]
- 57.Eliezer D, Yao J, Dyson HJ, Wright PE. Nat Struct Mol Biol. 1998;18:148–155. doi: 10.1038/nsb0298-148. [DOI] [PubMed] [Google Scholar]
- 58.Nishimura C, Dyson HJ, Wright PE. Proc Nat Acad Sci. 2005;102:4765–4770. doi: 10.1073/pnas.0409538102. [DOI] [PMC free article] [PubMed] [Google Scholar]
- 59.Uzawa T, Nishimura C, Akiyama S, Ishimori K, Takahashi S, Dyson HJ, Wright PE. Proc Nat Acad Sci. 2008;105:13859–13864. doi: 10.1073/pnas.0804033105. [DOI] [PMC free article] [PubMed] [Google Scholar]
- 60.Bertagna AM, Barrick D. Proc Nat Acad Sci. 2004;101:12514–12519. doi: 10.1073/pnas.0404760101. [DOI] [PMC free article] [PubMed] [Google Scholar]
- 61.Chow CC, Chow C, Raghunathan V, Huppert TJ, Kimball EB, Cavagnero C. Biochemistry. 2003;42 doi: 10.1021/bi0273056. [DOI] [PubMed] [Google Scholar]
- 62.Jennings PA, Stone MJ, Wright PE. J Biomol NMR. 1995;6:271–276. doi: 10.1007/BF00197808. [DOI] [PubMed] [Google Scholar]
- 63.Armstrong BD, Lingwood MD, McCarney ER, Brown ER, Bluemler P, Han S. J Magn Reson. 2008;191:273–281. doi: 10.1016/j.jmr.2008.01.004. [DOI] [PubMed] [Google Scholar]
- 64.Armstrong BD, Han S. J Chem Phys. 2007;127:104508–10. doi: 10.1063/1.2770465. [DOI] [PubMed] [Google Scholar]
- 65.Muller-Warmuth W, Meise-Gresch K. Advan Magn Reson. 1983;11:1–45. [Google Scholar]
- 66.Hausser KH, Stehlik D. Advan Magn Reson. 1968;3:79–139. [Google Scholar]
- 67.Freed JH. J Chem Phys. 1978;68:4034–4037. [Google Scholar]
- 68.Hwang LP, Freed JH. J Chem Phys. 1975;63:4017–4025. [Google Scholar]
- 69.Hofer P, Parigi G, Luchinat C, Carl P, Guthausen G, Reese M, Carlomagno T, Griesinger C, Bennati M. J Am Chem Soc. 2008;130:3254–3255. doi: 10.1021/ja0783207. [DOI] [PubMed] [Google Scholar]
- 70.Polnaszek CF, Bryant RG. J Chem Phys. 1984;81:4038–4045. [Google Scholar]
- 71.Bennati M, Luchinat C, Parigi G, Turke MT. Phys Chem Chem Phys. 2010;12:5902–5910. doi: 10.1039/c002304n. [DOI] [PubMed] [Google Scholar]
- 72.Sezer D, Gafurov M, Prandolini MJ, Denysenkov VP, Prisner TF. Phys Chem Chem Phys. 2009;11:6638–6653. doi: 10.1039/b906719c. [DOI] [PubMed] [Google Scholar]
- 73.Sezer D, Prandolini MJ, Prisner TF. Phys Chem Chem Phys. 2009;11:6626–6637. doi: 10.1039/b905709a. [DOI] [PubMed] [Google Scholar]
- 74.Guo Z, Cascio D, Hideg K, Kálái T, Hubbell WL. Protein Sci. 2007;16:1069–1086. doi: 10.1110/ps.062739107. [DOI] [PMC free article] [PubMed] [Google Scholar]
- 75.Baldwin E, Xu J, Hajiseyedjavadi O, Baase WA, Matthews BW. J Mol Biol. 1996;259:542–559. doi: 10.1006/jmbi.1996.0338. [DOI] [PubMed] [Google Scholar]
- 76.Anderson DE, Hurley JH, Nicholson H, Baase WA, Matthews BW. Protein Sci. 1993;2:1285–1290. doi: 10.1002/pro.5560020811. [DOI] [PMC free article] [PubMed] [Google Scholar]
- 77.Richards FM, Wynn R, Harkins PC, Fox RO. Protein Sci. 1997;6:1621–1626. doi: 10.1002/pro.5560060803. [DOI] [PMC free article] [PubMed] [Google Scholar]
- 78.Wynn R, Harkins PC, Richards FM, Fox RO. Protein Sci. 1996;5:1026–1031. doi: 10.1002/pro.5560050605. [DOI] [PMC free article] [PubMed] [Google Scholar]
- 79.Olson JS, Soman J, Phillips GN. IUBMB Life. 2007;59:552–562. doi: 10.1080/15216540701230495. [DOI] [PubMed] [Google Scholar]
- 80.Armstrong BD, Soto P, Shea JE, Han S. J Magn Reson. 2009;200:137–141. doi: 10.1016/j.jmr.2009.05.013. [DOI] [PubMed] [Google Scholar]
- 81.Kausik R, Han S. J Am Chem Soc. 2009;131:18254–18256. doi: 10.1021/ja9060849. [DOI] [PubMed] [Google Scholar]
- 82.Griffith OH, Dehlinger PJ, Van SP. J Membrane Biol. 1974;15:159–192. doi: 10.1007/BF01870086. [DOI] [PubMed] [Google Scholar]
- 83.Marsh D. Proc Nat Acad Sci. 2001;98:7777–7782. doi: 10.1073/pnas.131023798. [DOI] [PMC free article] [PubMed] [Google Scholar]
- 84.Owenius R, Engstrom M, Lindgren M, Huber M. J Phys Chem A. 2001;105:10967–10977. [Google Scholar]
- 85.Kiihne S, Bryant RG. Biophys J. 2000;78:2163–2169. doi: 10.1016/S0006-3495(00)76763-4. [DOI] [PMC free article] [PubMed] [Google Scholar]
- 86.Lecomte JTJ, Kao YH, Cocco MJ. Proteins. 1996;25:267–285. doi: 10.1002/(SICI)1097-0134(199607)25:3<267::AID-PROT1>3.0.CO;2-D. [DOI] [PubMed] [Google Scholar]
- 87.Value for free Tempo is taken from ref 47. As noted in the Materials and Methods section there are more recent reports on the coupling factor with different values (refs 68, 70–72,). The data on apoMb presented here was taken with the same experimental setup and conditions as ref 47 and is therefore the relevant number for this comparison.
- 88.Columbus L, Kalai T, Jeko J, Hideg K, Hubbell WL. Biochemistry. 2001;40:3828–3846. doi: 10.1021/bi002645h. [DOI] [PubMed] [Google Scholar]
- 89.McHaourab HS, Lietzow MA, Hideg K, Hubbell WL. Biochemistry. 1996;35:7692–7704. doi: 10.1021/bi960482k. [DOI] [PubMed] [Google Scholar]
- 90.Gardino AK, Villali J, Kivenson A, Lei M, Liu CF, Steindel P, Eisenmesser EZ, Labeikovsky W, Wolf-Watz M, Clarkson MW, Kern D. Cell. 2009;139:1109–1118. doi: 10.1016/j.cell.2009.11.022. [DOI] [PMC free article] [PubMed] [Google Scholar]
- 91.Fraser JS, Clarkson MW, Degnan SC, Erion R, Kern D, Alber T. Nature. 2009;462:669–673. doi: 10.1038/nature08615. [DOI] [PMC free article] [PubMed] [Google Scholar]
- 92.Yao J, Chung J, Eliezer D, Wright PE, Dyson HJ. Biochemistry. 2001;40:3561–3571. doi: 10.1021/bi002776i. [DOI] [PubMed] [Google Scholar]
Associated Data
This section collects any data citations, data availability statements, or supplementary materials included in this article.